

Constr_materials
.pdfFigure 3.8 A tilt boundary results from an alignment of edge dislocations
In spite of this disordered arrangement of atoms and lack of regular bonding along grain boundaries, a polycrystalline material is still very strong; cohesive forces within and across the boundary are present. Furthermore, the density of a polycrystalline specimen is virtually identical to that of a single crystal of the same material.
3.4.BULK OR VOLUME DEFECTS
Other defects exist in all solid materials that are much larger than those heretofore discussed. These include pores, cracks, foreign inclusions, and other phases. They are normally introduced during processing and fabrication steps.
Figure 3.9 Photomicrograph shows non-metallic inclusion in steel, which is a place of crack origin
Questions and problems
1.What principle underlies of classification of crystalline structure defects?
2.Point defects. Concept of vacancy, self-interstitial and impurity.
3.Linear defects. What are the edge and screw dislocations?
4.How the number of dislocations in metal is characterized? What units is dislocation density measured in?
5.Which defects are surface defects?
6.Which defects are bulk defects?
31
Created with novaPDF Printer (www.novaPDF.com). Please register to remove this message.
4. MECHANICAL PROPERTIES OF METALS
Many materials, when in service, are subjected to forces or loads. So, it is necessary to know the characteristics of the material and to design the parts of the machine such that any resulting deformation will not be excessive and fracture will not occur. The mechanical behavior of a material reflects its response to an applied load. Important mechanical properties are strength, hardness, ductility, stiffness, and toughness.
The mechanical tests are conducted using standardized testing techniques.
This chapter is devoted to the stress–strain behavior of metals and the related mechanical properties, and also examines other important mechanical characteristics.
4.1.TENSILE TESTS
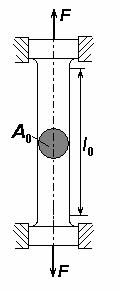
A simple stress–strain test is most commonly conducted for metals at room temperature. A specimen is deformed to fracture with a gradually increasing tensile load that is applied along its long axis. A standard tensile specimen is shown in Figure 4.1. Normally, the cross section is circular, but
|
rectangular specimens are also used. The specimen is |
|
|
mounted by its ends into the holding grips of the |
|
|
testing apparatus. The tensile testing machine is |
|
|
designed to elongate the specimen at a constant rate, |
|
|
and continuously measure the applied load and the |
|
|
resulting elongations. A stress–strain test typically |
|
|
takes several minutes to perform and is destructive; |
|
|
that is, the test specimen is permanently deformed and |
|
|
fractured. |
|
|
The output of such a test is recorded by a |
|
|
computer as load versus elongation. To minimize the |
|
|
geometrical factors, load and elongation are |
|
|
normalized to the respective parameters of engineering |
|
Figure 4.1 |
stress and engineering strain. Engineering stress σ is |
|
defined by the relationship |
|
|
A standard tensile |
σ = F/A0 |
(4.1) |
specimen of circular |
in which F is the load applied perpendicular to the |
|
cross section
specimen cross section, in units of newtons (N), and A0
is the original cross-sectional area before the test (m2). The units of engineering stress are megapascals, MPa.
Engineering strain ε is defined according to
ε = (lf – l0)/l0 |
(4.2) |
32 |
|
Created with novaPDF Printer (www.novaPDF.com). Please register to remove this message.
in which l0 is the original length before the test and lf is the instantaneous length. Strain is unitless, but sometimes it is also expressed as a percentage.
4.2.ELASTIC DEFORMATION. STRESS–STRAIN BEHAVIOR
The degree to which a structure deforms or strains depends on the magnitude of an imposed stress. For most metals that are stressed in tension and at relatively low levels, stress and strain are proportional to each other through the relationship
σ = Е·ε. |
(4.3) |
This is known as Hooke’s law, and the constant of proportionality E
(GPa or psi) is the modulus of elasticity, or Young’s modulus. For most typical metals the magnitude of this modulus ranges between 45 GPa, for magnesium, and 407 GPa, for tungsten. Modulus of elasticity values for several metals at room temperature are presented in Table 4.1.
Table 4.1 Room-Temperature Elastic and Shear Moduli, and Poisson's Ratio for Various Metal Alloys
Metal Alloy |
Modulus of |
Shear Modulus, GPa |
Poisson’s Ratio |
elasticity, GPa |
|||
Aluminum |
69 |
25 |
0.33 |
Brass |
97 |
37 |
0.34 |
Copper |
110 |
46 |
0.34 |
Magnesium |
45 |
17 |
0.29 |
Nickel |
207 |
76 |
0.31 |
Steel |
207 |
83 |
0.30 |
Titanium |
107 |
45 |
0.34 |
Tungsten |
407 |
160 |
0.24 |
Deformation in which stress and strain are proportional is called elastic deformation; a plot of stress (ordinate) versus strain (abscissa) results in a linear relationship, as shown in Figure 4.2, before point a.
The slope of this linear segment corresponds to the modulus of elasticity E. This modulus may be thought of as stiffness, or a material’s resistance to elastic deformation. The greater the modulus, the stiffer the material, or the smaller the elastic strain that results from the application of a given stress. The modulus is an important design parameter used for computing elastic deflections.
Elastic deformation is recoverable, which means that when the applied load is released, the piece returns to its original shape.
There are some materials (e. g., gray cast iron, concrete, and many polymers) for which this initial elastic portion of the stress-strain curve is not linear.
33
Created with novaPDF Printer (www.novaPDF.com). Please register to remove this message.
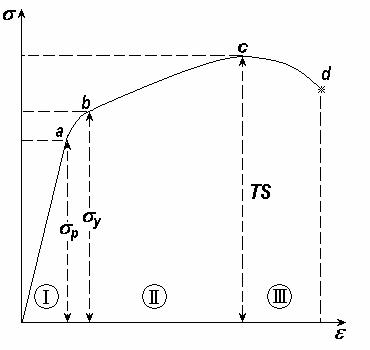
Figure 4.2 A stress–strain diagram
On an atomic scale, macroscopic elastic strain is manifested as small changes in the interatomic spacing and the stretching of interatomic bonds. As a consequence, the magnitude of the modulus of elasticity is a measure of the interatomic bonding forces.
4.3.PLASTIC DEFORMATION
For most metallic materials, elastic deformation persists only to strains of about 0.005. As the material is deformed beyond this point, the stress is no longer proportional to strain (Hooke’s law, Equation 4.3, ceases to be valid), and permanent, non recoverable or plastic deformation occurs. Figure 4.2 plots schematically the tensile stress-strain behavior into the plastic region for a typical metal. The transition from elastic to plastic is a gradual one for most metals.
From an atomic perspective, plastic deformation corresponds to the breaking of bonds with original atom neighbors and then reforming bonds with new neighbors as large numbers of atoms move relativly to one another; upon removal of the stress they do not return to their original positions. The mechanism of this deformation is different for crystalline and amorphous materials. For crystalline solids, deformation is accomplished by means of a process called slip, which involves the motion of dislocations. Plastic deformation in noncrystalline solids (as well as liquids) occurs by a viscous flow mechanism.
34
Created with novaPDF Printer (www.novaPDF.com). Please register to remove this message.
4.4.YIELDING AND YIELD STRENGTH
Most structures are designed to ensure that only elastic deformation will result when a stress is applied. It is therefore desirable to know the stress level at which plastic deformation begins, or where the phenomenon of yielding occurs. For metals that experience this gradual elastic-plastic transition, the point of yielding may be determined as the initial departure from linearity of the stress-strain curve; this is sometimes called the proportional limit, as indicated by point a in Figure 4.2. In such cases the position of this point may not be determined precisely. As a consequence, a convention has been established wherein a straight line is constructed parallel to the elastic portion of the stress–strain curve at some specified strain offset, usually 0.002. The stress corresponding to the intersection of this line and the stress-strain curve as it bends over in the plastic region is defined as the yield strength σY. This is demonstrated in Figure 4.2, point b. Of course, the units of yield strength are MPa or psi.
Some steels and other materials exhibit the tensile stress–strain behavior where the elastic-plastic transition is very well defined. At the upper yield point, plastic deformation is initiated with an actual decrease in stress. Continued deformation fluctuates slightly about some constant stress value; stress subsequently rises with increasing strain. For metals that display this effect, the yield strength is taken as the average stress that is associated with the lower yield point, since it is well defined and relatively insensitive to the testing procedure. Thus, it is not necessary to employ the strain offset method for these materials.
The magnitude of the yield strength for a metal is a measure of its resistance to plastic deformation. Yield strengths may range from 35 MPa for a low-strength aluminum to over 1400 MPa for high-strength steels.
4.5.TENSILE STRENGTH
After yielding, the stress necessary to continue plastic deformation in metals increases tо а maximum, point c in Figure 4.2, and then decreases to the eventual fracture, point d. The tensile strength TS, or σT (MPa or psi) is the stress at the maximum on the engineering stress–strain curve (Fig. 4.2). This corresponds to the maximum stress that can be sustained by a structure in tension; if this stress is applied and maintained, fracture will result. All deformation up to this point is uniform throughout the narrow region of the tensile specimen. However, at this maximum stress, a small constriction or neck begins to form at some point, and all subsequent deformation is confined at this neck. This phenomenon is termed “necking,” and fracture
35
Created with novaPDF Printer (www.novaPDF.com). Please register to remove this message.
ultimately occurs at the neck. The fracture strength corresponds to the stress at fracture.
Tensile strengths may vary anywhere from 50 MPa for an aluminum to as high as 3000 MPa for the high-strength steels. Ordinarily, when the strength of a metal is cited for design purposes, the yield strength is used. This is because by the time a stress corresponding to the tensile strength has been applied, often a structure has experienced so much plastic deformation that it is useless. Furthermore, fracture strengths are not normally specified for engineering design purposes.
4.6.DUCTILITY
Ductility is another important mechanical property. It is a measure of the degree of plastic deformation that has been sustained at fracture. A material that experiences very little or no plastic deformation upon fracture is termed brittle. The tensile stress–strain behaviors for both ductile and brittle materials are schematically illustrated in Figure 4.3.
Ductility may be expressed quantitatively as either percent elongation or percent reduction in area. The percent elongation %EL is the percentage of plastic strain at fracture, or
%EL = ((lf – l0)/l0) ? 100, |
(4.4) |
where lf is the fracture length, and l0 is the original gauge length as above. Inasmuch as a significant proportion of the plastic deformation at fracture is confined to the neck region, the magnitude of %EL will depend on specimen gauge length. The shorter l0, the greater is the fraction of total elongation from the neck and, consequently, the higher the value of %EL. Therefore, l0 should be specified when percent elongation values are cited; it is commonly 50 mm (2 in). Percent reduction in area %RA is defined as
%RA= ((Аf – А0)/А0) ? 100, (4.5)
where А0 is the original cross-sectional area and Аf is the crosssectional area at the point of fracture. Percent reduction in area values is independent of both l0 and A0. Furthermore, for a given material the magnitudes of %EL and %RA will, in general, be different. Most metals possess at least a moderate degree of ductility at room temperature; however, some become brittle as the temperature is lowered.
A knowledge of the ductility of materials is important for at least two reasons. First, it indicates to a designer the degree to which a structure will deform plastically before fracture. Second, it specifies the degree of allowable deformation during fabrication operations.
36
Created with novaPDF Printer (www.novaPDF.com). Please register to remove this message.

Brittle materials are approximately considered to be those having a fracture strain of less than about 5 %.
Thus, several important mechanical properties of metals may be determined from tensile stress-strain tests. Table 4.2 presents some typical roomtemperature values of yield strength, tensile strength, and ductility for several of the common metals. These properties are sensitive to any prior deformation, the presence of impurities, and/or any heat treatment to which the metal has been subjected. The modulus of elasticity is one mechanical parameter that is insensitive to these treatments. As
with modulus of elasticity, the magnitudes of both yield and tensile strengths decline with increasing temperature just the reverse holds for ductility; it usually increases with temperature.
Table 4.2 Typical Mechanical Properties of Several Metals and Alloys
in an Annealed State
Metal Alloy |
Yield Strength, |
Tensile Strength, |
Ductility, %EL |
|
MPa |
MPa |
[in 50 mm] |
||
|
||||
|
|
|
|
|
Aluminum |
35 |
90 |
40 |
|
Copper |
69 |
200 |
45 |
|
Brass (70%Cu–30%Zn) |
75 |
300 |
68 |
|
Iron |
130 |
262 |
45 |
|
Nickel |
138 |
480 |
40 |
|
Steel (1020) |
180 |
380 |
25 |
|
Titanium |
450 |
520 |
25 |
|
|
|
|
|
|
Molybdenum |
565 |
655 |
35 |
4.7.TOUGHNESS
Toughness is an ability of a material to resist fracture under impact loads, or dynamic loads.
37
Created with novaPDF Printer (www.novaPDF.com). Please register to remove this message.

The toughness characteristic is defined at blow-bending test. It is a dynamic test, unlike all previous, at which the loading is applied to the specimen with major speed, for one thousandth of a second.
The test is carried out at impact pendulum-type testing machine (Fig. 4.4).
Figure 4.4 Impact test
Impact strength (resilience) is the fracture energy of a specimen, referred to its cross-sectional area:
E f
KC A [J/m2],
where Ef is a fracture energy,
A is cross-sectional area of the specimen.
The specimen should have a notch, which plays a role of stress concentrator. The impact strength value depends on a type of a notch (Fig. 4.6).
For the same material KCU> KCV> KCT, i. e. the more acute the notch, the easier the material fractures.
Impact strength is a criterion of material’s reliability, in other words, an assurance, that it will not be destroyed suddenly, in brittle manner.
Strictly speaking, impact strength is a complex characteristic which includes specific energy of a crack origin ao and specific energy of its propagation ap. For more valid estimate of a material reliability an extrapolation method is used (Fig. 4.7). It defines impact strength for vanishing concentrator radius r. It is the energy of crack propagation
38
Created with novaPDF Printer (www.novaPDF.com). Please register to remove this message.

ap, which allows to estimate reliability (crack nucleus almost always are present in a material; a question is, whether they will grow).
Figure 4.6 Types of specimens |
Figure 4.7 Definition of ap value |
for the impact test |
|
Questions and problems
7.Which properties of metals are called mechanical?
8.What is an engineering stress? What units is it measured in?
9.Strength. Definition; characteristics and dimensions of their quantity.
10.Tension test. A scheme and purpose.
11.Stress-strain diagram for ductile and brittle metal.
12.Ductility. Definition; characteristics and dimensions of their quantity.
13.Hardness. Definition; characteristics, hardness testers. (Study laboratory instructions.)
14.Toughness. Definition; characteristics and dimensions of their quantity.
15.Impact fracture testing. A scheme and purpose.
16.What parameters make it possible to estimate the material reliability?
17.What is a metal fatigue? How is it exerted? Fatigue failure.
18.Endurance. Definition; characteristics, fatigue testing.
19.Cold shortness. Definition; characteristics, testing.
39
Created with novaPDF Printer (www.novaPDF.com). Please register to remove this message.

5. DISLOCATIONS AND PLASTIC DEFORMATION
With a knowledge of the nature of dislocations and the role they play in the plastic deformation process, we are able to understand the underlying mechanisms of the techniques that are used to strengthen and harden metals and their alloys; thus, it becomes possible to design and tailor the mechanical properties of materials – for example, the strength or toughness of a metalmatrix composite.
Materials may experience two kinds of deformation: elastic and plastic. Plastic deformation is permanent, and strength and hardness are measures of a material resistance to this deformation. On a microscopic scale, plastic deformation corresponds to the net movement of large numbers of atoms in response to an applied stress. During the process, interatomic bonds must be ruptured and then reformed. In crystalline solids, plastic deformation most often involves the motion of dislocations, linear crystalline defects.
Early materials studies led to the computation of the theoretical strength of perfect crystals, which were many times greater than those actually measured. During the 1930s it was theorized that this discrepancy in mechanical strength could be explained by a type of linear crystalline defects that has since to be known as dislocations. It was not until the 1950s, however, that the existence of such dislocation defects was established by direct
observation with the electron microscope. Since then, a theory of dislocations has evolved that explains many of the physical and mechanical phenomena in crystalline materials, primarily metals and ceramics.
Edge and screw are the two fundamental dislocation types. In an edge dislocation, localized lattice exists along the end of an extra half-plane of atoms, which also defines the dislocation line (Fig. 5.1). A screw dislocation may be thought of as resulting from shear distortion; its dislocation line passes through the center of a spiral, atomic plane ramp (see Fig. 3.4).
Many dislocations in crystalline materials have both edge and screw components; these are mixed dislocations (see Fig. 3.5).
40
Created with novaPDF Printer (www.novaPDF.com). Please register to remove this message.