

SYNTENY 59
these cells multiply and differentiate, a two-colored animal emerges; the pattern of color distribution reveals the clonal origin of the cells that generated it. The tortoise shell phenotype is only seen in the female. Thus there are truly fundamental differences between the sexes; females are mosaics in all their tissues for most of the genes on the X chromosome; males are
monosomic. |
|
|
|
|
Abnormalities |
in sex |
chromosome balance reveal the interplay |
between |
factors di- |
rected by genes on |
the X |
and Y chromosomes. An individual with only |
one X |
chromo- |
some is called XO. This individual is female, but she is short and has other marked abnor-
malities. It |
is |
not |
clear how |
much of this is due to |
deleterious recessive |
alleles on the X |
and how much |
is |
due |
to gene |
dosage. The abnormality |
is called Turner’s |
syndrome. An |
XXY individual is male, but he has some feminine characteristics such as breasts. This syndrome is called Kleinfelter’s. This individual will have a Barr body because X-inacti- vation occurs in cells with more than one X chromosome. An individual with XYY is a male, mostly normal, but tall.
SYNTENY
In general, from some of the items discussed in the last few sections, we can conclude that the relative number of chromosomes (or even parts of chromosomes) matters a great deal, but the actual number of different chromosomes is not terribly important. A classic case is two closely related deer that are phenotypically extremely similar. The Reeves Muntjak has only 3 autosomes plus sex chromosomes. These autosomes are enormous. The Indian Muntjak has 22 autosomes plus sex chromosomes, a number far more typical
of other mammals. The two deer must have very similar genomes, but these are distributed differently. The chromosome fusion events that resulted in the Reeves Muntjak must be fairly recent in evolution. Their major consequence is that the two species cannot interbreed because the progeny would have numerous chromosome imbalances.
The Muntjak example suggests that chromosome organization can vary, in a dramatic way, superficially, without much disruption of gene organization and gene content. This notion is fully borne out when the detailed arrangement of genes is observed in different species. For example, in most closely related species, like human and chimp, the detailed
appearance |
of chromosome bands is nearly identical. Humans and chimps in fact show |
only two |
regions of significant chromosome morphological differences in the entire |
genome. These regions are clearly of some interest for future study, since they could reveal hints of genes that differ significantly in the two species.
When more distantly related organisms are compared, their chromosomes appear, superficially, to be very different. For example, the mouse has 19 autosomes; the human has 22. All of the mouse chromosomes are acrocentric: Their centromeric constrictions occur at one
end of the chromosome. In essence each mouse chromosome has only one arm. In contrast, most of the human chromosomes have an internally located centromere; in many cases it is near the center and the two arms are comparable in size. Only five human chromosomes are
acrocentric, and each of these is a special case: Chromosomes 13, 14, |
15, 21, |
and 22 all |
||||
have tiny short arms containing large numbers of tandemly repeated rDNA genes (see Fig. |
||||||
2.13). However, when the detailed arrangement of genes along chromosomes |
is |
compared |
||||
in the mouse and human, a much more conserved structural pattern is seen. |
|
|
|
|
||
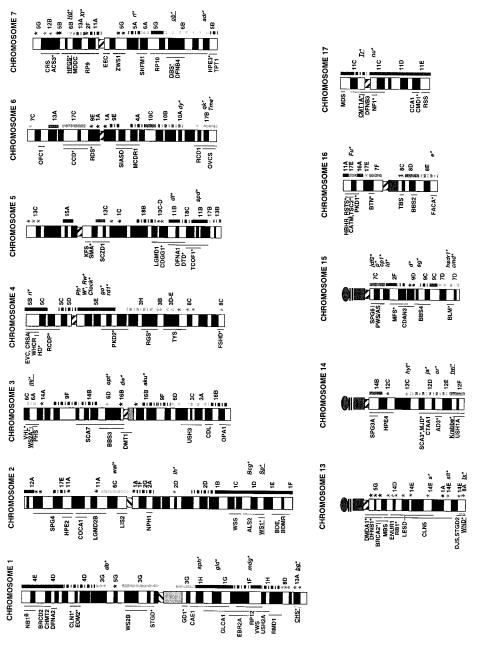
Synteny is the term used to describe similar arrangements of genes on maps, whether |
||||||
these are genetic maps or chromosome |
morphology. Most |
regions of |
the |
mouse |
and |
|
human genomes display a high degree of |
synteny. This is |
summarized |
in |
Figure |
2.25, |
|
60

Figur e 2.25 |
Correspondences |
between |
human |
and mouse |
chromosomes. |
Corresponding |
mouse |
re gions |
are indicated |
on each |
human |
chromo- |
some. (Kindly pro |
vided by Lisa Stubbs; Carv |
|
er and Stubbs, |
1997.) |
|
|
|
|
|
|
|
|
62 A GENOME OVERVIEW AT THE LEVEL OF CHROMOSOMES
which reveals that a typical mouse chromosome has genes that map to two to four human |
|
chromosomes, and vice versa. If we look at genes that are neighbors in the mouse, these |
|
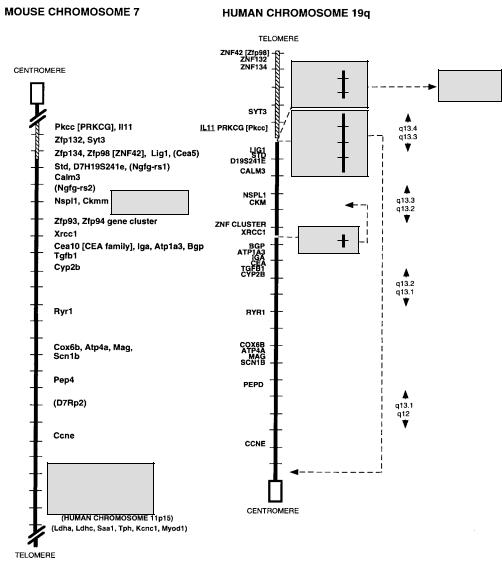
are almost always neighbors in the human. Figure 2.26 illustrates this for mouse chromo- |
|
some |
7: The corresponding human 19q regions contain blocks of the same genes in the |
same |
order. This is extremely useful because it means that genetic or physical mapping |
data in one species can usually be applied |
to other species. It speeds, enormously, the |
search for corresponding genes in different |
species. The superficial differences between |
the mouse and human genome have presumably |
been caused largely by gross chromo- |
ZnF160
ZFP40
FPR1
LIM2
ETFB
CD33
KLK1
RRAS NGFG
CD37
HRC
SNRP70
LHB
DBP
CEA2 [PSG FAMILY]
PSG
FAMILY
Lim2, Etfb, Cd33
Kal1, Ngfg, Cd37, Rras,
Hrc, Snrp70, Lhb, Dbp
to MOUSE CHROMOSOME
17
Figure 2.26 An example of a detailed synteny map. Shown are sections of mouse chromosome 7 corresponding to regions of human chromosome 19q which contain similarly ordered blocks of markers. (Kindly provided by Lisa Stubbs; Stubbs et al., 1996.)
SOURCES AND ADDITIONAL READINGS |
63 |
some rearrangements in both species. It has been estimated that only a few hundred such rearrangements will ultimately account for all of the differences we see in the contemporary versions of these chromosomes.
SOURCES |
AND |
ADDITIONAL READINGS |
|
|
|
|
|
|
|
|
Buckle, V. J., Edwards, J. H., Evans, E. P., Jonasson, J. A., Lyon, M. F., Peters, J., and Searle, A. G. |
|
|
|
|||||||
1984. Chromosome maps of man and mouse II. |
|
|
Clinical Genetics |
1: 1–11. |
|
|
|
|||
Cantor, C. R., and Schimmel, P. R. 1980. |
|
Biophysical Chemistry. |
San Francisco: W. H. Freeman, |
|||||||
chapter 24. |
|
|
|
|
|
|
|
|
||
Carver, E. A., and Stubbs, L. 1997. Zooming in on the human-mouse comparative trap: Genome |
|
|
|
|
||||||
conservation re-examined on a high resolution scale. |
|
Genome Research |
7: 1123–1137. |
|||||||
Cozzarelli, N. R., and Wang, J. C., eds. 1990. |
|
DNA Topology and Its Biological Effects. |
|
|
Cold Spring |
|||||
Harbor, NY: Cold Spring Harbor Laboratory Press. |
|
|
|
|
|
|
||||
Harrington, J. J., Van Bokkeln, G., Mays, R. W., Gustashaw, K., and Willard, H. F. 1997. Formation |
|
|
|
|||||||
of de novo centromeres and construction of first-generation human artificial microchromosomes. |
|
|
|
|
||||||
Nature Genetics |
15: 345–355. |
|
|
|
|
|
|
|
||
Holmquist, G. P. 1992. Review article: Chromosome bands, their chromatin flavors, and their func- |
|
|
|
|
||||||
tional features. |
American Journal of Human Genetics |
51: 17–37. |
|
|
|
|||||
König, P., and Rhodes, D. 1997. Recognition of telomeric |
DNA. |
|
Trends in Biochemical |
Sciences |
||||||
22: 43–47. |
|
|
|
|
|
|
|
|
||
Levy, M. Z., Allsopp, R. C., Futcher, A. B., Greider, C. W., and Harley, C. B. 1992. Telomere end- |
|
|
|
|||||||
replication problem and cell aging. |
Journal of Molecular Biology |
225: 951–960. |
|
|
||||||
Manuelidis, L. 1990. A view of interphase chromosomes. |
|
Science |
250: 1533–1540. |
|
|
|||||
Moyzis, R. K., Buckingham, J. M, Cram, L. S., Dani, M., Deaven, L. L., Jones, M. D., Meyne, J., |
|
|
|
|||||||
Ratliff, R. L., and Wu, J. R. 1988. A highly conserved |
repetitive |
DNA sequence, (TTAGGG) |
|
|
|
n , |
||||
present at the telomeres of human chromosomes. |
|
|
Proceedings of the National |
Academy |
of |
|||||
Sciences USA |
85: 6622–6626. |
|
|
|
|
|
|
|
||
Niklas, R. B. 1997. How cells get the right chromosomes. |
|
Science |
275: 632–637. |
|
|
|||||
Therman, |
E. |
1986. |
Human Chromosomes: |
Structure, |
Behavior, |
Effects, |
|
2nd |
ed. |
New York: |
Springer-Verlag. |
|
|
|
|
|
|
|
|
||
Saccone, S., De Sario, A., Wiegant, J., Raap, A. K., Valle, |
G. D., and Bernardi, |
G. 1993. |
|
|
|
|||||
Correlations between isochores and chromosomal bands in the |
human genome. |
|
|
|
Proceedings of |
|||||
the National Academy of Sciences USA |
|
90: 11929–11933. |
|
|
|
|
||||
Stubbs, L., Carver, E. A., Shannon, M. E., Kim, J., Geisler, J., Generoso, E. E., Stanford, B. G., |
|
|
|
|||||||
Dunn, W. C., Mohrenweiser, H., Zimmermann, W., et al. 1996. Detailed comparative map of hu- |
|
|
|
|
||||||
man chromosome 19q and related regions of the mouse genome. |
|
|
Genomics |
35: 499–508. |
||||||
Wallace, D. C. 1995. Mitochondrial DNA variation in human evolution, degenerative disease, and |
|
|
|
|
||||||
aging. |
American Journal of Human Genetics |
|
|
57: 201–223. |
|
|
|
|
||