

264 |
PHYSICAL MAPPING |
|
|
|
|
|
probes |
will be correlated across a |
set |
of |
cell |
lines |
in a precise way. Furthermore one |
should |
see a band in some cell lines |
that |
is |
the |
sum of |
the two fragment lengths seen in |
others. This provides evidence that the two probes are, in fact, seeing neighboring bands.
More |
complex cases |
exist where |
there |
are multiple |
polymorphisms |
in a |
small region. |
|
These |
become very hard |
to analyze. In fact such regions may not be |
that |
rare; there |
is |
|||
some evidence from a few of the restriction maps that have been made thus far that poly- |
|
|||||||
morphism, at the level of macrorestriction maps is a patchy phenomenon with regions rel- |
|
|||||||
atively homogeneous across a set of cell lines alternating with regions that are much more |
|
|||||||
variable. Methylation |
differences |
are |
probably at |
the heart of |
this |
phenomenon, |
but |
|
whether it has any biological significance or is just an artifact of in vitro tissue culture conditions is not yet known.
PLACING SMALL FRAGMENTS ON MAPS
In most macrorestriction maps that have been constructed to date, occasional very small restriction fragments have been missed. These fragments add little value to the map, and they inevitably show up in subsequent work when a region is mapped more finely or con-
verted to an ordered clone bank. However, from a purely aesthetic standpoint, it is undesirable to leave gaps in a map. The real question is how to fill these gaps with minimum effort. One approach that has been reasonably successful, is to end label DNA fragments from a complete digest with an infrequently cutting enzyme and use PFG with short short
pulses |
or conventional |
electrophoresis to detect the presence of |
any |
small |
fragments. |
|
Once these are identified, a simple way |
to place them on the restriction |
map is to use |
||||
them as a probe in hybridization against a |
partial digest. As shown by Figure 8.33, the |
|||||
small |
fragment itself is |
invisible in such a |
digest. However, when |
it is |
fused to fragments |
|
on either side, the sizes of these pieces will be detected in the partial digest, and in almost all cases these sizes will be sufficiently characteristic to place the small fragment uniquely on the map.
An alternative approach to identifying small fragments is to use PCR. Splints are ligated onto the sticky ends generated by the restriction enzyme digestion. Primers specific
for the splints are then used for PCR amplification. Given the limited size range of typical PCR amplifications, no macrorestriction fragments will be amplified. The PCR product will consist of only small restriction fragments if any of these were generated by the digest. These can be fractionated by size and individually used to probe a partial digest, as described above, in order to determine the position of the small fragments on the macrorestriction map.
Figure 8.33 Placing a small DNA fragment on a macrorestriction map.
|
|
REACHING THE ENDS OF THE PHYSICAL MAP: CLONING TELOMERES |
265 |
|||||
REACHING THE ENDS OF THE PHYSICAL MAP: |
|
|
|
|
||||
CLONING |
TELOMERES |
|
|
|
|
|
|
|
Ten years ago there was a tremendous flurry of activity in cloning mammalian telomere- |
|
|||||||
associated sequences. This was motivated by several factors. The simple sequence repeat |
|
|||||||
at the very end of mammalian chromosomes had been determined, but little was known |
|
|||||||
about what kinds of DNA sequences lay immediately proximal to this. Such sequences |
|
|||||||
should be of considerable biological |
interest, since they ought to play a role in chromo- |
|
||||||
some function, |
and they might help determine the identity of different chromosomes. |
|
||||||
Clones near telomeres will be extremely useful probes for partial digests, as we have al- |
|
|||||||
ready described. Finally telomeres are, by definition, the ends of all linear chromosome |
|
|||||||
maps, and until they are anchored to the remainder of a genetic or physical map, one can- |
|
|||||||
not say that that map is truly complete. |
|
|
|
|
||||
True telomeres would not be expected to be present in plasmid, bacteriophage, or cos- |
|
|||||||
mid libraries, and in fact it has |
been all but impossible to find them there. There are at |
|
||||||
least two explanations for this. First, the structure of the simple sequence telomere repeat |
|
|||||||
contains a hairpin rather than a normal duplex or single-stranded overhang (Chapter 2). |
|
|||||||
This hairpin is quite stable |
under the conditions used for |
ordinary |
DNA cloning. It will |
|
||||
not ligate under these conditions, and thus one would expect that the telomeres would fail |
|
|||||||
to be cloned. Second, simple tandem repeats are not very stable in typical cloning vec- |
|
|||||||
tors; they are easily lost by recombination; the 10to 30-kb simple human telomeric re- |
|
|||||||
peat would almost |
certainly |
not be |
stable in typical bacterial cloning strains. The se- |
|
||||
quences |
distal to |
the simple |
repeat |
are themselves rich in medium-size tandem repeats, |
|
|||
and whole blocks of such sequences are repeated. Thus these regions are also likely to be |
|
|||||||
quite unstable in |
E. coli. |
For all these reasons it is |
not surprising that early attempts |
to |
||||
find telomeres in conventional libraries failed. |
|
|
|
|
||||
To |
circumvent |
the problems discussed above and find mammalian |
telomeric |
DNA, |
|
|||
about six research groups simultaneously developed procedures for |
selectively |
cloning |
|
|||||
these sequences in |
the yeast, |
S. cerevisiae. |
The standard cloning vector used in yeast is a |
|||||
yeast artificial chromosome (YAC; see Box 8.2). We and others have reasoned that be- |
|
|||||||
cause telomeres are such key elements in chromosome function, and because the proper- |
|
|||||||
ties of telomeres are so well conserved through most species, there was a chance that a |
|
|||||||
mammalian telomere can function in yeast even if its structure is not identical to the yeast |
|
|||||||
telomere and associated sequences. To test this idea, we used half YACs as cloning vec- |
|
|||||||
tors. To survive in yeast as a stable species, the half YAC would have to become ligated to |
|
|||||||
another telomere-containing DNA fragment. |
|
|
|
|
||||
We did not expect that the process of cloning telomeres would be very efficient. To en- |
|
|||||||
hance the chances for a human telomere to be successfully cloned, we developed the pro- |
|
|||||||
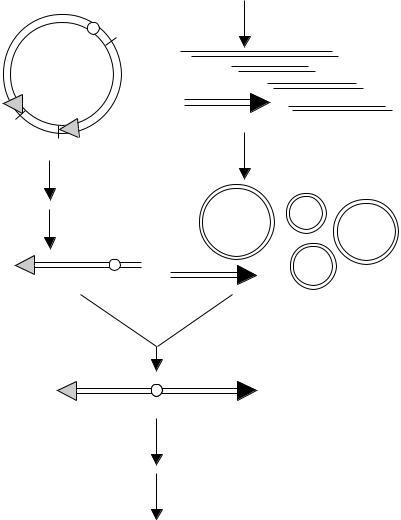
cedure shown in Figure 8.34. Total genomic human DNA was digested with the restric- |
|
|||||||
tion enzyme |
Eco R I. The reaction mixture was diluted, and ligase was added. All normal |
|
||||||
Eco R I DNA fragments have two sticky ends generated by the original restriction enzyme |
|
|||||||
digest. These are capable of ligation, and at the reduced concentrations the primary liga- |
|
|||||||
tion products become intramolecular circles (just as in the case of the jumping library |
|
|||||||
construction). The only fragments that do not lose their sticky ends by ligation are telo- |
|
|||||||
meres, |
which have only one |
sticky |
end and cannot circularize, and very |
short |
Eco R I |
|||
fragments, which cannot bend enough to form a circle. By this ligation procedure most of
the nontelomeric restriction fragments can be selectively eliminated; in practice, about a 10 4 enrichment for telomeric restriction fragments is produced.
266 PHYSICAL MAPPING
human genomic DNA
digested with EcoRl
EcoRl
pYAC4 DNA
BamHl
BamHl
digested with EcoRl and BamHl
isolate the 6 kb fragment
Tel Trp CEN
Tel
recircularize the internal fragments in a low DNA concentration
Tel
ligate the recircularized human DNA to the YAC vector
Tel |
Trp |
CEN |
Tel |
select for Trp+ clones
screen the transformants with (TTAGGG)7 probe
human telomere clones
Figure 8.34 Strategy used to pre-enrich human DNA for telomeric fragments and then to clone these fragments. (From Cheng et al., 1989.)
The resulting mixture was then ligated to an |
Eco |
R I-digested YAC vector. DNA was |
transfected into yeast, and colonies that grew in the presence of the selectable marker car- |
||
ried on the half YAC arm were screened for the presence of human |
repeated sequences |
|
and human telomere simple repeats. The first clone found in this way proved to be an au- |
||
thentic human telomere. Its structure is shown in Figure 8.35. The human origin of the |
||
clone is guaranteed by the presence of a human |
Alu |
repeat, and a short stretch of human- |
specific telomere simple sequence. Most of the simple sequence that originally had to be |
||
present at the authentic human telomere has been lost, and some of |
it has been |
replaced |
REACHING THE ENDS OF THE PHYSICAL MAP: CLONING TELOMERES |
267 |
|||||||||||||||||||||
YAC |
human DNA |
0 |
|
|
|
|
|
1Kb |
||||||||||||||
|
|
|
|
|
|
|
|
|
|
|
|
|
||||||||||
|
|
|
|
|
|
|
|
|||||||||||||||
|
|
|
|
|
|
|
|
|
||||||||||||||
E Bg |
Ps Pu |
Pu |
BssHll |
|
K Ps |
|||||||||||||||||
|
|
|
|
|
|
|
|
|
|
|
|
|
|
|
|
|
|
|
|
|
|
|
|
|
|
|
|
|
|
|
|
|
|
|
|
|
|
|
|
|
|
|
|
|
|
|
|
|
|
|
|
|
|
|
|
|
|
|
|
|
|
|
|
|
|
|
|
|
|
|
|
|
|
|
|
|
|
|
|
|
|
|
|
|
|
|
|
|
|
|
|
|
|
|
|
|
|
|
|
|
|
|
|
|
|
|
|
|
|
|
|
|
|
|
|
|
|
|
|
|
|
|
|
|
|
|
|
|
|
|
|
|
|
|
|
|
|
|
|
|
|
|
|
|
|
|
|
|
|
|
|
|
|
|
|
|
|
|
|
|
6 kb YAC portion |
AT-rich |
|
Alu |
|
HTF (CpG) |
< 1 kb TTAGGG |
|
of the chromosome |
region |
repeat |
|
island |
repeating |
||
|
|
|
|
|
|
|
sequence |
Figure 8.35 Structure of a cloned human telomere, as isolated in yeast. Clone yHT1 is a chimeric |
|
||||||
minichromosome containing human DNA (filled arrow) and yeast DNA (open arrow). Arrowheads |
|
|
|||||
represent regions of telomeric simple repeats. The open |
circle |
represents a |
yeast |
centromere. |
|
||
Locations of |
Eco R I(E),Bgl |
II (Bg), |
Pst I |
(Ps), Pvu |
II |
(Pv), and Kpn I (K) |
restriction sites are |
shown above the map. The position of an |
|
Alu repetitive element is indicated by a solid arrowhead |
|||||
below the map, which points in the direction of the poly(dA) stretch. (From Cheng et al., 1989.) |
|
||||||
BOX 8.2
CLONING LARGE DNA FRAGMENTS AS
ARTIFICIAL CHROMOSOMES
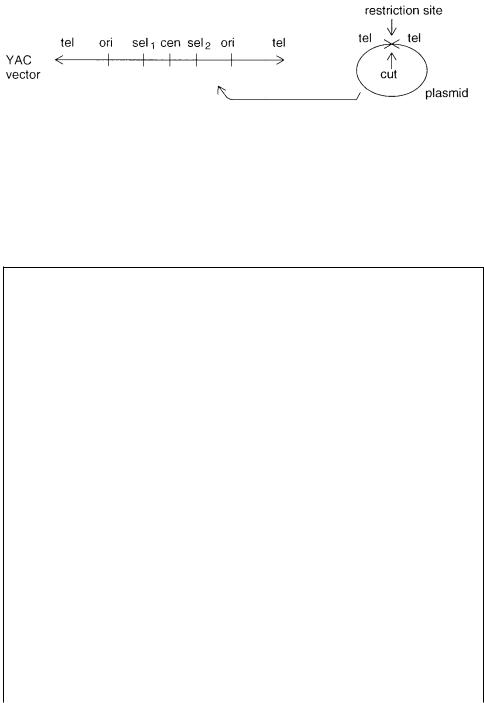
Both yeast and bacterial large fragment cloning systems are developed. Yeast artificial |
|
|||||||||||
chromosomes |
(YACs) are constructed |
using small plasmids that are grown in |
|
|
E. coli, |
|||||||
as shown in Figure 8.36. The YAC vectors have telomere sequences at each of their |
|
|||||||||||
ends, |
a |
centromere |
sequence, |
and usually a DNA replication origin |
and |
selectable |
|
|||||
marker in each arm of the vector. Large fragments are cloned into a multicloning site |
|
|||||||||||
occurring between the two arms of |
the YAC. Initially both arms of |
the YAC were |
|
|||||||||
cloned into the same plasmid. This meant that the plasmid was cleaved |
both |
at |
the |
|
||||||||
cloning site and at a site between |
the converging telomeric sequences. Subsequently |
|
||||||||||
the |
vector |
arms were |
divided |
between two plasmids. The vector arms are |
ligated |
to |
|
|||||
high molecular DNA that has |
been partially digested with a |
restriction |
enzyme |
like |
|
|||||||
Eco |
R |
I. The recombinant |
DNAs |
are introduced |
into |
|
|
|
S. cerevisiae |
cells chemically |
||
treated |
so |
that they |
could take up |
DNA. YACs up |
to about |
1 Mb have been |
created. |
|
||||
Figure 8.36 General design of yeast artificial chromosome (YAC) cloning vectors and how
they are propagated in bacteria: tel, telomere, ori, replication origin, cen, centromere, sel1 and sel2, selectable markers.
(continued)
268 |
PHYSICAL MAPPING |
|
|
|
|
|
|
BOX 8.2 |
(Continued) |
|
|
|
|
|
|
Even though transformation frequencies were very low (hundreds per mg |
of |
input |
|
|
|||
DNA), eventually most of the human genome was cloned in this manner. The YAC li- |
|
|
|||||
braries have facilitated the cloning of many human genes. YACs are not as easy to ma- |
|
|
|||||
nipulate as bacterial clones, and many are chimeric, containing DNA from more than |
|
|
|||||
one region of the human genome, or contain interstitial deletions. |
|
|
|
|
|||
The |
large insert bacterial cloning systems are based on well-characterized au- |
|
|
||||
tonomously replicating extrachromosomal DNA elements of |
|
E. coli. |
P1 artificial chro- |
||||
mosomes (PACs) use vector sequences for P1 bacteriophage (Box 2.3), whereas bacte- |
|
|
|||||
rial artificial chromosomes (BACs) are based on the fertility factor (F-factor, Figure |
|
|
|||||
8.37). P1 bacteriophage replicates as an extrachromosomal low-copy plasmid and as a |
|
|
|||||
high-copy |
lytic |
phage. Induction |
of the lytic replicon in PACs ensures |
that large |
|
|
|
amounts of recombinant PAC DNA can be synthesized. Although both the P1 bacterio- |
|
|
|
||||
phage and F-factors genomes are 100 kb in size, only a small portion of these genome |
|
|
|||||
codes for essential functions and can be deleted for cloning. Up to about 2.5 Mb of |
|
E. |
|||||
coli DNA has been known to be stably maintained in F-plasmids. Initially PACs were |
|
|
|||||
developed |
so that |
efficient transfection systems could be used to introduce |
recombi- |
|
|
||
nant DNA into cells. This limited the recombinant DNA size to |
|
|
100 kb so |
that it |
|||
could be packaged into bacteriophage particles. Later recombinant PAC DNAs up to |
|
|
|||||
about 250 kb were introduced into cells using electroporation. Unlike YACs which are |
|
|
|||||
linear DNA molecular, PACs and BACs must be circular to be stable in |
|
|
E. coli. |
The ef- |
|||
ficiency of circulation in vitro by DNA ligase decreases with the size of the molecule. |
|
|
|||||
Hence BAC and PAC systems were developed that took advantage of a P1 coded site- |
|
|
|||||
specific recombination enzyme, namely cre recombinance. This enzyme promotes re- |
|
|
|||||
combination between two loxP sites. Cre-promoted recombination circularizes a linear |
|
|
|||||
DNA fragment containing loxP sites |
at both ends. Genes specifying proteins |
such as |
|
|
|||
the cre enzyme are moved to the host chromosome to minimize the BAC or PAC vec- |
|
|
|||||
tor sequences and to allow for independent gene expression. Bacterial-based BAC or |
|
|
|||||
PAC cloning systems are easier to |
manipulate than YAC systems, appear |
to |
contain |
|
|
||
much fewer rearrangements and allow for easy manipulation of clone DNA. |
|
|
|
|
|||
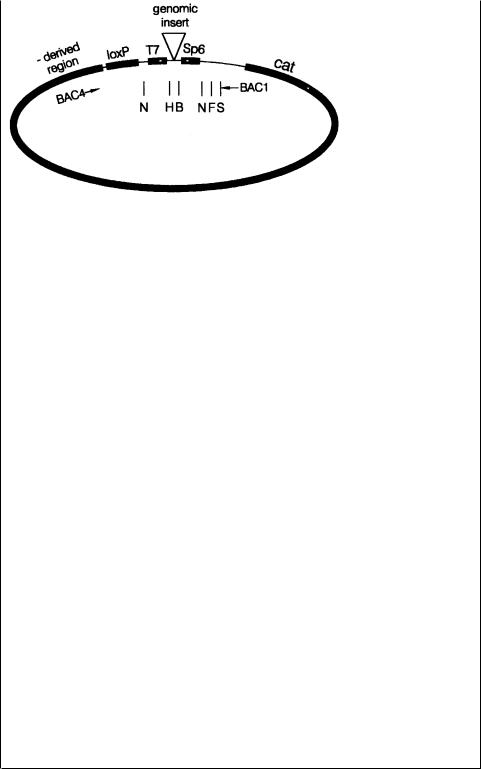
Figure 8.37 A typical bacterial artificial chromosome (BAC) cloning vector. It contains a loxP sequence to promote circularization, and bacteriophage T7 and Sp6 promoters to allow strandspecific transcription of the cloned insert. Also shown inside the circle are restriction enzyme cleavage sites and useful PCR primers.

|
|
|
BOTTOM-UP LIBRARY ORDERING |
269 |
|
by |
yeast |
telomeric simple sequence repeats. This indicates |
that the human simple se- |
|
|
quence is unstable in yeast but that some feature of it is |
eventually recognized |
by the |
|
||
yeast telomerase, which then converts the end of the clone into a yeastlike telomere. |
|
|
|||
|
The particular clone that we first isolated turned out to be useful in mapping a few Mb |
|
|||
of DNA at the long-arm telomeres of human chromosomes 4 and 21. However, it could |
|
||||
only be used in a hybrid cell line because no where on this clone could any single-copy |
|
||||
human DNA be found. Since this early work, others have systematically cloned and char- |
|
||||
acterized single-copy probes from a number of human telomeres. These findings promise |
|
|
|||
to be useful also for clinical diagnostics, since DNA rearrangements at telomeres are not |
|
||||
uncommon in diseases like cancer. |
|
|
|
||
OPTICAL |
MAPPING |
|
|
|
|
Recently |
an optical method for restriction mapping has been described that could speed |
|
|||
the process considerably (Kai et al., 1995; Samad et al., 1995). This method has success- |
|
||||
fully been applied to bacteriphage and YAC clones and to natural yeast chromosomes. |
|
||||
Recently it has been semi-automated and extended to even larger DNAs. In optical map- |
|
||||
ping DNA molecules are elongated by gentle flow as they are fixed by capture onto poly- |
|
||||
L -lysine |
derivatized glass surfaces. The restriction enzyme |
cleavage is used to fragment |
|
||
the fixed molecules. A small portion of the stretched chain relaxes at each cleavage site. |
|
||||
This leaves a gap that is visible by fluorescence microscopy after staining the DNA sam- |
|
||||
ples. The contour length of each fragment seen indicates its size. However, a very signifi- |
|
||||
cant feature of this method is that the pattern of organization of the fragments is main- |
|
||||
tained by the initial fixation, and thus the order of the fragments is immediately known. |
|
||||
Because this is a single-molecule method, it can deal effectively with any sample hetero- |
|
||||
geneity. If sufficient numbers of molecules are examined, a complete map of each class of |
|
||||
species in the sample should be revealed. |
|
|
|
||
BOTTOM-UP LIBRARY ORDERING |
|
|
|
||
The conventional approach to constructing an ordered library of clones is to fingerprint a |
|
||||
dense set |
of samples and look for clones that share overlapping |
properties. A key variable |
|
||
in designing such strategies is the minimum fraction of the clones that must be in common |
|
|
|||
in |
order |
for their overlap to be detectable. The smaller the overlap required, |
the fewer |
|
|
clones needed to produce an ordered set, and the faster the |
process proceeds (Fig. |
8.38). |
|
||
Figure 8.38 The degree of overlap, |
f,of two clones of length |
L1 and L2 will determine the resolu- |
tion of the fingerprinting procedure needed to identify them.
270 |
PHYSICAL MAPPING |
|
|
|
|
|
|
|
|
|
|
|
Typical methods usually require a fiveto tenfold redundant set of clones to ensure that |
|
|
|
|
||||||||
there is a good chance of sampling the entire target at sufficient density to allow overlap |
|
|
|
|||||||||
detection. A simplistic estimate based on this redundancy would indicate that overlaps be- |
|
|
|
|
||||||||
tween clones should be perfectly scored at the 80 to 90% overlap level and perhaps half |
|
|
|
|||||||||
detected at the 40 to 50% overlap level. The key thing is to avoid false positives: predict- |
|
|
|
|||||||||
ing an overlap where none exists in fact. This is a serious error because it will result in the |
|
|
|
|||||||||
assignment |
of clones to incorrect regions of the |
target. A number |
of |
different |
methods |
|
|
|
|
|||
have been used to detect overlaps in past studies. In all of these |
a |
key |
requirement is |
to |
|
|
|
|||||
have some sort of statistical way of determining the most likely set of overlaps in cases |
|
|
|
|||||||||
where there are ambiguities or potential inconsistencies. One very effective approach for |
|
|
|
|||||||||
evaluating overlap data is summarized in Box 8.3. |
|
|
|
|
|
|
|
|
|
|
||
The earliest clone fingerprinting methods used restriction fragment sizes seen in single |
|
|
|
|||||||||
and double digests with 6-base specific enzymes like |
|
|
|
|
|
Eco |
R I and |
Hind |
III. This approach |
|||
was first used to order bacteriophage lambda clones of |
|
|
|
|
|
S. cerevisiae. |
It |
was actually |
very |
|||
difficult because of inaccuracies in sizing DNA fragments in the 1 to 10 kb range, particu- |
|
|
|
|||||||||
larly when results obtained on different gels electrophoresed on different days had to be |
|
|
|
|
||||||||
compared. More accurate sizing is possible with smaller DNA fragments, but the number |
|
|
|
|
||||||||
of such fragments that result from digestion of a bacteriophage or larger clone with a 4- |
|
|
|
|||||||||
base specific restriction enzyme is too large to allow all of them to be separated cleanly. |
|
|
|
|||||||||
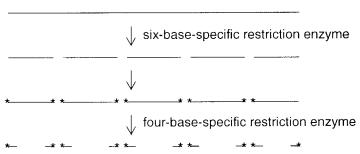
One way around this problem is to use an end-labeling strategy as shown in Figure 8.39. |
|
|
|
|||||||||
This was first developed to order a cosmid library from the nematode |
|
|
|
|
|
|
|
C. elegans. |
First the |
|||
clone is digested with a 6-base specific enzyme. The ends of the resulting fragments clone |
|
|
|
|||||||||
are labeled. Then a second digest is done with a |
4-base specific |
enzyme. This |
results in |
|
|
|
||||||
DNA pieces |
that can be analyzed with single-base |
resolution of |
DNA |
sequencing |
gels, |
|
|
|
|
|||
but their number is restricted to a manageable set. |
|
|
|
|
|
|
|
|
|
|
|
|
An alternative approach for clone fingerprinting by restriction enzyme digestion is il- |
|
|
|
|||||||||
lustrated |
in Figure 8.40. This procedure was first used by |
Kohara |
in |
constructing an |
|
|
|
|||||
E. coli |
library in bacteriophage lambda clones. Indirect end labeling from probes in the |
|
|
|
||||||||
vector sequence was used to determine the positions of restriction sites seen in separate |
|
|
|
|||||||||
partial digests, each generated with one of eight different restriction enzymes. The key |
|
|
|
|||||||||
advantage of this approach was that all eight digests were analyzed in a single gel elec- |
|
|
|
|||||||||
trophoresis. Under these circumstances, even though the DNA size information |
might be |
|
|
|
|
|||||||
Figure 8.39 End-labeling procedure (asterisk) to produce a set of discrete DNA sizes which serve as a fingerprint.

BOTTOM-UP LIBRARY ORDERING |
271 |
BOX 8.3
STATISTICAL EVALUATION OF CLONE OVERLAPS
A very effective method that can be used for clone analysis is an adaptation of the pro- |
|
||||||||||||
cedure originally developed by Branscomb et al. (1996) for contig building by restric- |
|
||||||||||||
tion fragment fingerprinting. However, the method can also be applied to hybridization |
|
||||||||||||
based |
fingerprinting like the |
S. |
pombe |
example discussed |
in Chapter 9. Clones are |
||||||||
considered in pairs; each pair either overlaps ( |
|
|
|
|
O ), with a fraction of overlap |
f,defined |
|||||||
in Figure 8.38, or does not overlap ( |
|
N ). Each |
piece of fingerprinting data available is |
||||||||||
tested for its support of the hypothesis that two |
clones overlap with a fraction |
|
f.The |
||||||||||
data can be a concordant or a discordant hybridization result with a particular probe or |
|
||||||||||||
the presence or absence of particular size restriction fragments or restriction site order. |
|
||||||||||||
Let |
q |
represent the |
fraction |
of all of the clones |
that do |
not |
have |
a particular |
restriction |
|
|||
fragment |
size or order |
(or alternatively that do not |
hybridize |
to a |
certain |
probe). Then |
|
||||||
1 q |
is the fraction that would be expected to show that fragment size (or hybridize to |
|
|||||||||||
a certain probe) due to chance alone. We consider six cases in all: |
|
|
P |
( ) means that |
|||||||||
both clones are |
detected, |
P ( ) |
means |
that |
only |
one clone is detected (scored posi- |
|
||||||
tive), |
and |
P ( ) means that neither clone is detected. Simple statistical considera- |
|
||||||||||
tions have been used to develop the following equations: |
|
|
|
|
|
|
|||||||
|
|
|
|
|
P ( ,N ) (1 q )2 |
|
|
|
|
||||
|
|
|
|
|
P ( ,N ) 2q (1 q ) |
|
|
|
|||||
|
|
|
|
|
P ( ,N ) q 2 |
|
|
|
|
|
|
||
|
|
|
|
|
P( ,O ) 1 P ( ,O ) P( ,O ) |
|
|||||||
|
|
|
|
|
P( ,O ) 2(1 |
f |
|
|
|
||||
|
|
|
|
|
)q |
|
|
|
|||||
|
|
|
|
|
P ( ,O ) q 2q f |
|
|
|
|
||||
The first three equations are obvious because they derive from simple binomial sta- |
|
||||||||||||
tistics for two uncorrelated clones. The remaining terms are not rigorous, but they do |
|
||||||||||||
model the statistics of coincident detection of partially overlapping clones approxi- |
|
||||||||||||
mately. For example, the sixth equation, if the overlap, |
|
|
|
f,is zero, becomes equal to the |
|||||||||
third equation. If the overlap is 1, |
|
P ( ,O ) q |
which is reasonable, since in effect |
||||||||||
one now is dealing with only a |
single distinct clone. The |
fifth equation, |
in |
the limit |
|
||||||||
f 0, is equal to the second equation. In |
the limit |
|
|
|
f 1, the fifth equation is zero |
||||||||
which is the desired behavior because identical clones cannot be expected to show dis- |
|
||||||||||||
cordant behavior. The fourth equation, |
|
|
P ( ,O ) |
also observes the correct limits. |
|||||||||
These |
equations |
have been used |
successfully in the |
construction of |
ordered |
libraries |
|
||||||
by fingerprinting and by hybridization. A more exact treatment must take into account
the relative lengths of the probes and the clones in hybridization assays. For example, if two clones partially overlap, a probe larger than the clones has a higher chance of detecting both than a probe smaller than the clones.
(continued)
272 |
PHYSICAL MAPPING |
|
|
|
|
|
||
|
BOX |
8.3 |
(Continued) |
|
|
|
|
|
|
|
|
|
|
|
|||
|
|
To use the |
above equations |
one must evaluate |
P ( ,O ) and |
P ( ,O ) before |
||
|
P ( ,O ) can be calculated. When these results are considered for the entire set of |
|
|
|||||
|
restriction digests or hybridization results seen, we can compute |
the likelihood, |
|
L,of |
||||
|
any particular overlap value, |
f,for each pair of clones as |
|
|
||||
|
|
|
|
L( f) |
P (X n ,O ) |
|
|
|
|
|
|
|
P (X n ,N ) |
|
|
||
|
|
|
|
n |
|
|
||
|
where the outcome for the comparison of the two clones with the |
|
|
n th test is |
xn , and the |
|||
|
product is taken over the entire set of tests. The calculation is very time intensive be- |
|
|
|||||
|
cause all pairs of probes must be considered separately for all probes and all overlap |
|
|
|||||
|
values. The procedure can be simplified by using results with longer clones to arrange |
|
|
|||||
|
the shorter clones into bins (see Fig. 9.4). Then overlap calculations need to be carried |
|
|
|||||
|
out only within bins and between the edges of neighboring bins. |
|
|
|
|
|||
|
|
|
|
|
|
|
|
|
imprecise, the relative order of the different restriction sites would be known with great
accuracy. This order information was |
the major source of data used to fingerprint |
the |
clones. |
|
|
Some of these approaches can be improved upon by using the power of current auto- |
||
mated four-color DNA sequence readers (see Chapter 10). An example is shown in Figure |
|
|
8.41. Here restriction fragments are |
filled in by end labeling in order to reduce the |
num- |
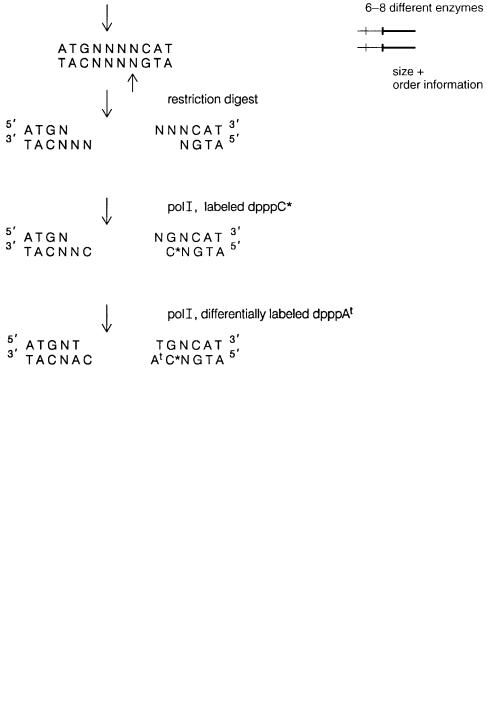
ber of fragments seen to a manageable level, as just described. In this case, however, instead of just labeling with a single color (radioactive phosphate), a restriction site is filled in with a mixture of four different colored dpppNs. By chosing a restriction enzyme that
cuts outside of its recognition sequence, as shown in the figure, one develops a very informative fingerprint of the end of the restriction fragments labeled. Now, instead of knowing that two clones share a common length restriction fragment, one learns that they share
this length, plus they share a particular terminal sequence that will only occur, by chance, in 1/16 of the sites cleaved by the particular enzyme used. Thus the chances of distinguishing true overlaps, from accidental similarities, become greatly enhanced.
The example just described shows the power of obtaining “color” information about a clone; that is, more information beyond just fragment sizes. Another way to do this is shown schematically in Figure 8.42. Here each clone is digested with several restriction enzymes, the fragments are separated by electrophoresis, and the resulting gel is blotted
and hybridized |
with several different interspersed repeating sequence probes. These |
probes provide a |
signature that goes beyond pure size measurements and indicates those |
sizes that contain particular repeats. This adds considerable information to each analysis, and it makes it much less likely that coincident similarities will be scored as false positives. The kind of clarity with which this approach allows overlaps to be viewed is shown
by the example in Figure 8.43.
Several |
other |
powerful variations of clone fingerprinting |
have been |
described, and |
some of these are now being tested intensively. If repeats can be |
nulled out, then the use |
|||
of clones or |
sets of clones as hybridization probes against other clones or sets of clones |
|||
becomes an effective |
fingerprinting method. This approach will be |
described |
in detail in |
|
BOTTOM-UP LIBRARY ORDERING |
273 |
Figure 8.40 Fingerprinting clones by Smith-Birnstiel restriction mapping. An indirect end label is used to probe the pattern of fragments seen in a set of different, separate partial digests.
the next chapter. An extreme version is to use individual or mixtures of arbitrary, short oligonucleotides as hybridization probes to fingerprint individual clones. In the limit of this approach, one would actually determine the DNA sequence of all of the clones by re-
peated hybridization experiments. The powers and limitations of oligonucleotide hybridization fingerprinting will be discussed in Chapter 12. Here it is sufficient to note that this approach has worked well in the construction of ordered libraries.
Figure 8.41 Use of restriction enzymes with imperfectly defined cutting sites to label different restriction sites with characteristic colors. This greatly increases the informativeness of the fingerprint pattern generated by the sizes of these fragments.