

TABLE |
|
8.1 Restriction Enzymes Useful for Genomic Mapping |
|
|
||||
Enzyme a |
|
|
Recognition Site (5 |
–3 )b |
Source a,c |
|||
|
|
|
|
|
|
|
||
|
|
|
|
Enzymes with Extended Recognition Sites |
|
|
||
I-Sce |
I |
|
|
TAGGGATAA/CAGGGTAAT |
|
|
B |
|
VDE |
|
|
|
|
TATSYATGYYGGTGY/ |
|
|
O |
|
|
|
|
|
GGRGAARKMGKKAAWGAAWG |
|
|
|
I-Ceu |
I |
|
|
TAACTATAACGGTCCTA/AGGTAGCGA |
N |
|
||
I-Tli |
I |
|
|
GGTTCTTTATGCGGACAC/TGACGGCTTTATG |
N |
|
||
I-Ppo |
I |
|
|
CTCTCTTAA/GGTAGC |
|
|
P |
|
|
|
|
|
|
Enzymes with |
6-bp Recognition Site |
|
|
Pac |
|
I |
|
|
TTAAT/TAA |
|
|
N |
Pme |
|
I |
|
|
GTTT/AAAC |
|
|
N |
Swa |
|
I |
|
|
ATTT/AAAT |
|
|
B |
Sse |
83888t1 |
|
CCTGCA/GC |
|
|
T |
||
|
|
|
|
Enzymes with |
6-bp Recognition that Cut in CpG Islands |
|
||
Rsr |
|
II (Csp |
*) |
|
CG/GWCCG |
|
|
N, P* |
SgrA |
|
I |
|
|
CR/CCGGYG |
|
|
B |
Not |
|
I |
|
|
GC/GGCCGC |
|
|
B, N, S, P |
SrfI |
|
|
GCCC/GGGC |
|
|
P, S |
||
Fse |
|
|
|
|
GGCCGGCC |
|
|
B |
Sfi |
Id |
|
|
GGCCNNNN/NGGCC |
|
|
B, N, P |
|
Asc |
|
I |
|
|
GG/CGCGCC |
|
|
N |
|
|
|
|
Enzymes that cut in CpG Islands: Fragments Average |
|
200 kb |
||
Mlu |
|
I |
|
|
A/CGCGT |
|
|
B, N, P, S |
Sal |
|
I |
|
|
G/TCGAC |
|
|
N |
Nru |
|
I |
|
|
TCG/CGA |
|
|
N |
Bss |
|
HII |
|
|
G/CGCGC |
|
|
|
Sac |
|
II |
|
|
CCGC/GG |
|
|
N |
Eag |
|
I (EcI |
XI*,Xma |
III) |
C/GGCCG |
|
|
B*, N |
|
|
|
|
Enzymes that cut in CpG Islands: Fragments Average |
|
200 kb |
||
Nar |
|
I |
|
|
GG/CGCC |
|
|
N, P |
Sma |
|
I |
|
|
CCC/GGG |
|
|
N |
Xho |
|
I |
|
|
C/TCGAG |
|
|
N |
Pvu |
|
I |
|
|
CGAT/CG |
|
|
N |
Apa |
|
I |
|
|
GGGCC/C |
|
|
N |
|
|
|
|
Enzymes with TAG in their Recognition Sequence |
|
|
||
Avr |
|
II (Bln |
I*) |
|
C/CTAGG |
|
|
N, T* |
Nhe |
|
I |
|
|
G/CTAGC |
|
|
N, P, S |
Xba |
|
I |
|
|
T/CTAGA |
|
|
B, N, P, S |
Spe |
|
I |
|
|
A/CTAGT |
|
|
B, N, P, S, T |
Nhe |
|
I |
|
|
G/CTAGC |
|
|
P |
Dra |
|
I |
|
|
TTT/AAA |
|
|
B, P, S |
Ssp |
|
I |
|
|
AAT/ATT |
|
|
P |
aAsterisk indicates preferred enzyme and source.
bR, A, or G; Y, C, or T; M, A, or C; K, G, or T; S, G, or C; W, A, or T; N, A, or C or G or T.
cB, Boehringer Mannheim; N, New England Biolabs; O, not commercially available; P, Promega; S, Stratagene; T, Takara.
dTwo sites are needed in order for cleavage to occur at both of them.

|
|
|
|
|
|
HTF ISLANDS |
|
245 |
|
Note that the recognition site for |
|
Sfi |
I contains no CpG’s, while the site recognized by |
|
|
|
|||
Not I contains 2 CpG’s. In Chapter 1 we showed that the frequency of occurrence of this |
|
|
|
|
|||||
dinucleotide sequence is reduced in mammalian DNA to about 1/4 of the level expected |
|
|
|
|
|||||
statistically. On this basis |
|
|
Not |
I can be expected to behave like a ten-base specific enzyme |
|
|
|
||
rather than an eight-base specific enzyme; as a result the expected fragment sizes are pre- |
|
|
|
|
|||||
dicted to lie around 1 Mb, in agreement with experimental results. However, this is an |
|
|
|
|
|||||
oversimplified argument for it ignores the effect of DNA methylation. Overall, in the hu- |
|
|
|
|
|||||
man genome about 80% of the CpG sequences are methylated to 5-meC, and |
|
|
Not |
I (and |
|||||
most other restriction nucleases) is unable to cleave at sites that are methylated. If we fac- |
|
|
|
|
|||||
tor this effect into the calculation, we can now predict that for random methylation only |
|
|
|
|
|||||
about 1/25 of the |
Not |
I |
sites |
have no |
m C and thus are cleavable. This yields |
an average |
|
|
|
DNA fragment size of 25 Mb, making |
|
Not I all but useless for conventional macrorestric- |
|
|
|
||||
tion mapping. Fortunately the distribution of CpG methylation is not random. In practice, |
|
|
|
|
|||||
it appears that about 90% of the |
|
|
Not I sites in the human genome are not methylated, and |
|
|
|
|||
so they are accessible to cleavage by the enzyme. This explains why |
Not |
I can |
generate |
||||||
fragments that average about 1 Mb in size. |
|
|
|
|
|
|
|||
HTF |
ISLANDS |
|
|
|
|
|
|
|
|
|
|
|
|
The peculiar distribution of methylated CpG, which has such a dramatic effect on the |
|
|
|
|
|
||||||||
frequency of |
Not I cutting sites, is a reflection of a more general statistical unevenness |
|
|||||||||||
in mammalian genomes. This was first discovered when genomic digestions were car- |
|
|
|
|
|
||||||||
ried out with a much less specific restriction enzyme, |
|
Hpa |
II. A typical genomic digest |
|
|||||||||
generated by this |
enzyme that |
recognizes |
the sequence CCGG is shown in |
|
|
|
|
Figure |
8.9. |
||||
A statistically random genome would be expected to give a roughly Gaussian distribu- |
|
|
|
|
|
||||||||
tion of fragment sizes. Instead, the two-phase distribution observed in practice is strik- |
|
|
|
|
|||||||||
ing. |
Hpa |
II |
is inhibited by DNA methylation. It |
cannot cut the sequence C |
|
|
|
m CGG. To |
|||||
as good approximation, the fragment sizes shown in Figure 8.9 can be fit by assuming |
|
|
|
|
|
||||||||
that |
the |
genome |
is divided |
into |
regions |
where no methylation occurs and |
regions |
|
|
|
|
|
|
where most of the CpG’s are methylated. The large fragments in the latter regions are |
|
|
|
|
|
||||||||
what were expected from an |
|
|
Hpa |
II digest. The small |
fragments |
were |
unexpected. |
|
|||||
They |
were |
named |
Hpa |
II tiny fragments (HTFs), and the |
regions that |
contain |
them |
|
|||||
have |
been |
called |
HTF islands. |
As we have learned more about |
the properties |
of |
these |
|
|||||
regions, many researchers have preferred to call them |
|
CpG islands, |
but for others, |
the |
|||||||||
original term has stuck. |
|
|
|
|
|
|
|
|
|
|
|||
Figure 8.9 |
Distribution of the sizes of the DNA fragments generated by a complete |
Hpa |
II digest |
of a typical mammalian genome. |
|
|
|
246 |
|
PHYSICAL |
MAPPING |
|
|
|
|
|
|
|
|
||
|
HTF islands have a number of very interesting properties. They tend to be located near |
|
|
|
|
|
|||||||
genes, most often at the 5 |
-edge of genes. They are very rich in G |
|
|
|
|
C. The frequency |
of |
||||||
CpG is as expected from binomial statistics—that is, there is no suppression of CpG in |
|
|
|
||||||||||
these regions and no elevation of TpG (which results from |
|
|
m |
CpG |
mutagenesis as de- |
|
|||||||
scribed in Chapter 1.) In HTF islands the CpG sequences are unmethylated. These results |
|
|
|
|
|
||||||||
are self-consistent: If there is no methylation in these regions, there should be no progres- |
|
|
|
||||||||||
sive loss of CpG by mutation, and thus the frequency of this sequence should just reflect |
|
|
|
||||||||||
the |
local |
C |
G content. More than 90% of the known |
Not |
I sites appear to be located in |
|
|||||||
HTF islands; this is understandable. To produce a cleavable |
|
|
Not |
I site requires two nearby |
|
||||||||
unmethylated CpG’s. This is an event most unlikely to occur in the bulk of the genome |
|
|
|
|
|
||||||||
where CpG’s are both very rare and methylated. |
|
|
|
|
|
|
|||||||
|
Many HTF islands have been studied by sequencing the DNA flanking |
|
|
|
|
Not |
I sites. |
||||||
This is relatively easy to do because, as we will discuss later in the chapter, there are |
|
|
|
||||||||||
straightforward ways to clone DNA that contains a cutting site for this enzyme (or al- |
|
|
|
|
|||||||||
most any other enzyme for that matter). Two representative human DNA sequences |
|
|
|
|
|
||||||||
flanking |
Not |
I |
sites on chromosome 21 are described in |
|
|
Figure 8 |
.10, which shows |
the |
|||||
local base composition as a function of distance from the |
|
|
Not I site. The first of these |
||||||||||
examples is extraordinarily G |
|
C rich throughout a 600–800 base region. The second |
|
||||||||||
example |
shows a |
transition from an HTF island to more ordinary genomic DNA; the |
|
|
|
|
|
||||||
Not |
I site is near the edge of the island. The distribution of CpG, GpC, and TpG se- |
|
|
||||||||||
quences in the |
first |
of these examples |
is plotted as a function of position |
in Figure |
|
|
|
||||||
8.11. It is evident that GpC’s and GpC’s are extraordinarily prevalent; more signifi- |
|
|
|||||||||||
cantly, their prevalence is roughly equivalent, showing the lack of any significant CpG |
|
|
|
||||||||||
suppression. |
|
|
|
|
|
|
|
|
|
|
|
||
ORDERING |
RESTRICTION |
FRAGMENTS |
|
|
|
|
|
|
|
|
|||
The simplest way to view top-down |
mapping is by projecting a low-resolution |
map |
|
|
|
|
|
||||||
with ill-defi |
ned |
distances |
onto |
a higher-resolution map with more carefully |
defined |
|
|
|
|||||
distances. Suppose that a genetic |
or cytogenetic map already exists for a chromosome |
|
|
|
|
|
|||||||
of interest, and this is actually the case today for almost all regions |
of the |
human |
|
|
|
||||||||
genome, at least at 2 Mb resolution (Chapter 6). Each genetically mapped or cytoge- |
|
|
|
||||||||||
netically |
mapped |
DNA marker can be radiolabeled and used as a hybridization probe |
|
|
|
|
|
||||||
to |
identify the |
corresponding large DNA fragments that it resides on, as |
shown |
|
in |
|
|
|
|||||
Figure 8.12. If DNA fragments can be generated that are comparable in size to |
the |
|
|
|
|||||||||
density of available DNA markers, then most of the construction of a restriction map |
|
|
|
|
|||||||||
would be accomplished with a relatively |
small number of direct DNA hybridizations. |
|
|
|
|
|
|||||||
In reality, for almost all regions |
of the genome, the probes available |
today |
|
are not |
|
|
|
||||||
dense enough to order a complete set of restriction fragments. Instead one must utilize |
|
|
|
|
|||||||||
procedures that allow the restriction map to be extended outward from the position of |
|
|
|
|
|
||||||||
known fragments |
into |
neighboring regions. A second problem is that the DNA frag- |
|
|
|
|
|
||||||
ment sizes generated by total digestion with available rare-cutting enzymes are quite |
|
|
|
||||||||||
diverse. Thus, although the average fragment size seen with |
|
|
Not I is about 1 Mb, many |
||||||||||
fragments |
are 3 |
Mb |
in size, |
and many are 0.2 Mb or smaller. Available |
DNA probes |
|
|
|
|||||
are |
very |
likely |
to |
be found that |
recognize the 3-Mb fragments; it is much less |
likely |
|
|
|
||||
that any preexisting probes will correspond to the 0.2-Mb fragments at typical probe densities of 1 per 1 to 2 Mb.
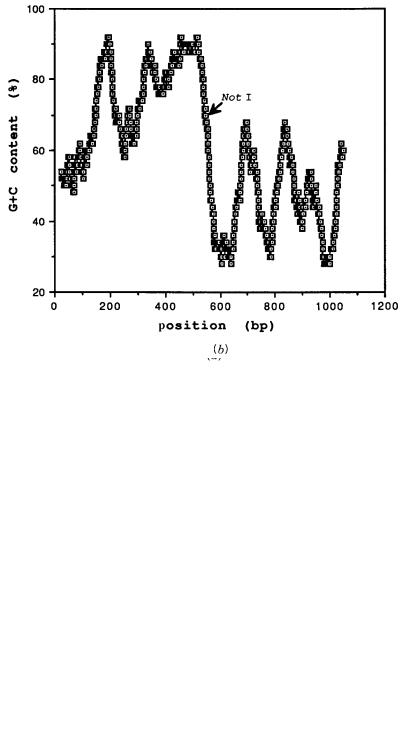
Figure 8.10 |
Base composition of two cloned DNA segments derived from |
HTF islands on human |
|
|||
chromosome 21. Plotted is the local average base composition as a function of the |
position |
within the |
|
|||
clone. A |
Not |
I site |
that allowed the selective cloning of these DNA pieces is also |
indicated. ( |
a ) Clone |
|
centered |
in an HTF island. ( |
b ) Clone at one edge of an HTF island. (Adapted from Zhu et al., 1993.) |
|
|||
247

248 PHYSICAL MAPPING
Figure 8.11 Distribution of three dinucleotide sequences within the clone described in Figure 8.10 a.
To carry out macrorestriction mapping projects efficiently, a number of needs must be met that allow one to circumvent the general problems raised above:
1.Probes must be isolated that are not preferentially located on large restriction fragments.
2.DNA must be cut less frequently to generate large fragments in any desired area of the genome.
3.Isolated probes must correspond to fragments of interest, those fragments where probes are needed to complete a map.
4.Neighboring fragments must be unequivocally identified.
5. Any tiny fragments generated |
by chance, by enzymes that on average yield very |
large fragments, must not be ignored. |
|
Methods now exist that deal with all |
of these problems reasonably efficiently. Most will |
be described in this chapter; a few |
will be deferred to Chapter 14 where we deal with |
some of the specialized methods that have been developed to manipulate particular DNA sequences.
Figure 8.12 The genetic or cytogenetic map provides a set of anchor points to place selected large DNA fragments in order.
IDENTIFYING THE DNA FRAGMENTS GENERATED BY A
RARE-CUTTING RESTRICTION ENZYME
The restriction digestion pattern generated by any enzyme that yields pieces large enough to be useful in genomic or chromosomal restriction mapping must be analyzed by PFG. Since this separation technique has a limited window of high resolution, under any fixed
DNA FRAGMENTS GENERATED BY A RARE-CUTTING RESTRICTION ENZYME |
249 |
experimental conditions it is usually necessary to fractionate the digest by PFG using a
range of three or four different pulse times: 30-second pulses for fragments 0 to 200 kb,
60-second pulses for fragments 200 |
to 1000 kb, 1000-second pulses at lower field |
strengths for 1 to 3 Mb pieces, and 3600-second pulses or secondary PFG for fragments |
|
larger than this. |
|
The entire distribution of DNA fragments can be visualized by staining the PFG frac- |
|
tionated material in the gel with ethidium bromide. This dye binds in between every other |
|
base pair (total stoichiometry 0.5 dye per base pair), and shows a more than 25-fold fluo- |
|
rescence enhancement when bound. Ethidium bromide appears to have no significant |
|
specificity for any particular base compositions or base sequences. It is sensitive enough |
|
for all routine use. Recently a number of |
other dyes have been reported that may offer |
the promise of higher-sensitivity DNA detection than ethidium bromide. However, the |
|
interactions of these dyes with very large DNA molecules have not yet been fully |
|
characterized. |
|
If the genome under analysis is a relatively simple one, ethidium staining allows all the |
|
pieces to be visualized, as we showed earlier in Figure 8.5. Since the amount of ethidium |
|
bound is proportional to the size of the DNA |
fragment, the resulting distribution of fluo- |
rescence |
intensity |
in a |
result like Figure 8.5 gives |
the weight |
average distribution |
of |
|||||||||||||||||
DNA. Small fragments are very hard to see. In general, a monotonic increase in fragment |
|
|
|||||||||||||||||||||
intensity is expected as fragment size increases. Deviations from this pattern indicate |
|||||||||||||||||||||||
multiplets: size fractions that contain two or more unresolved DNA pieces, or heterogene- |
|
|
|||||||||||||||||||||
ity; DNA fragments present in substoichiometric amounts because they arise from a con- |
|
|
|
||||||||||||||||||||
taminant |
in the |
sample, |
from a restriction site that has |
been only partially cleaved, or |
|||||||||||||||||||
from DNA partially degraded (by nuclease or even by electrophoresis itself). These com- |
|
|
|
||||||||||||||||||||
plications aside, a quantitative analysis of the pattern of ethidium staining will usually al- |
|||||||||||||||||||||||
low an accurate analysis of the number of DNA fragments in the genome. When these |
|
|
|
|
|||||||||||||||||||
sizes are summed, an estimate for the total genome size is produced. Indeed, when ethid- |
|||||||||||||||||||||||
ium staining is carried out very carefully, the stained intensity of DNA bands is not just a |
|
||||||||||||||||||||||
monotonic function of their size; it is very close to a linear function of their size |
up |
to a |
|||||||||||||||||||||
few Mb. Thus from the relative staining intensity alone it is sometimes possible to make |
|
|
|||||||||||||||||||||
reliable |
estimates |
of DNA |
sizes, |
even when |
proper size |
standards, for |
some |
reason, |
are |
||||||||||||||
not present or useable. |
|
|
|
|
|
|
|
|
|
|
|
|
|
|
|
|
|
|
|
||||
|
With complex |
genomes |
only a smear of ethidium staining |
intensity |
is generally |
seen. |
|
|
|||||||||||||||
At |
the highest |
obtainable |
PFG resolution, the entire human |
and mouse |
genome actually |
|
|
|
|||||||||||||||
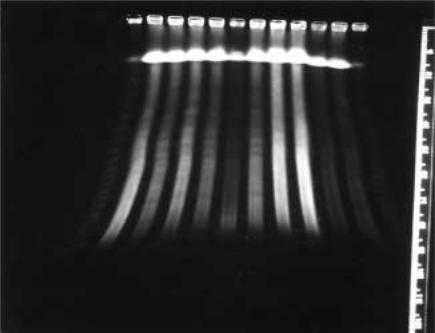
show a very discrete and reproducible banding pattern in ethidium-stained gels of DNA |
|
|
|
||||||||||||||||||||
digested |
with |
|
Not |
I or other rare-cutting restriction enzymes (Fig. 8.13). The significance |
|||||||||||||||||||
of |
this |
pattern |
has never |
been |
explained—but |
it |
does |
allow |
DNA from |
different |
species |
|
|
||||||||||
to be identified. In those unusual cases |
where |
a |
major |
repeating |
sequence |
has |
a |
rare- |
|
|
|||||||||||||
cutting site in it, a bright DNA band will sometimes be seen |
above |
the |
background ethid- |
|
|
||||||||||||||||||
ium smear. |
|
|
|
|
|
|
|
|
|
|
|
|
|
|
|
|
|
|
|
|
|
||
|
To |
develop |
a |
restriction |
map |
of |
a |
chromosome |
from |
a |
complex |
genome, |
like |
the |
|
||||||||
human genome, it is best to |
start |
with |
that chromosome in a hybrid cell. Even |
better, |
|||||||||||||||||||
for |
the |
larger |
mammalian |
chromosomes, |
are |
hybrid |
cells |
that |
contain |
only |
a |
10 |
to |
||||||||||
50 Mb fragment of the chromosome of interest. There are two major advantages for starting with such a hybrid cell. First, the chromosome of interest will almost certainly have a
unique genotype. Even if multiple copies are present, these are likely to be identical. In effect the sample is homozygous. This eliminates any confusion that would otherwise re-
sult if two different polymorphic structures of a region were merged into the same map.
250 PHYSICAL MAPPING
Figure 8.13 |
Ethidum-stained PFG fractionation of |
Not |
I digested human and mouse DNA from |
|
different cell lines. Fragments resolved in this gel range |
in size from 50 kb to 1 Mb. The distinct |
|||
pattern of banding seen depends on the particular species and |
enzyme used. |
|
|
|
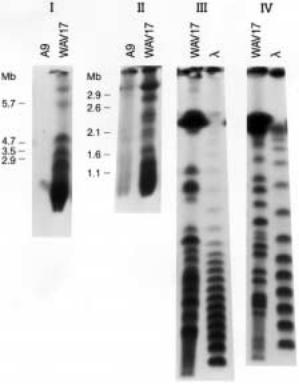
An example of such a useful cell line is WAV17 which has two to three identical copies of |
|
|
||||||
human chromosome 21 in a mouse background. |
|
|
|
|
|
|
||
The second advantage of using a hybrid cell is that it is possible to view most or all of |
|
|||||||
the human component above the background of DNA from the rodent. This is accom- |
|
|
||||||
plished by hybridizing a blot of a PFG-fractionated restriction enzyme digest of the cellu- |
|
|
||||||
lar DNA with various human-specific repeating DNA sequences. For example, the most |
|
|
||||||
common human-specific repeat is the |
Alu |
sequence. |
This will |
be |
described in much |
|||
greater detail in Chapter 14. Here, however, it is sufficient to note that this sequence oc- |
||||||||
curs on average about once every 3 kb in some regions of the human genome and about |
|
|
||||||
once every 10 kb in others. Probes for |
Alu |
exist that show |
little significant cross- |
|||||
hybridization with rodent DNA. These can then be used as a human-specific stain to de- |
|
|
||||||
tect the presence of human restriction fragments in a mouse |
or hamster |
cell. An |
example |
|
|
|||
of such an analysis is shown in Figure 8.14. |
|
|
|
|
|
|
||
The human |
Alu |
sequence should be seen on |
almost every large fragment of |
human |
||||
DNA if our genome were well fit by a statistically random model. This can be shown by |
|
|
||||||
using a simple Poisson model for the distribution of |
|
|
|
Alu ’s. From the Poisson distribution |
||||
(Chapter 6) we can estimate that the probability of an |
|
|
|
Alu |
not occurring on a fragment of |
|||
interest will be |
|
|
|
|
|
|
|
|
P (no |
Alu ) e ( average fragment size/ |
Alu spacing) |
DNA FRAGMENTS GENERATED BY A RARE-CUTTING RESTRICTION ENZYME |
251 |
Figure 8.14 |
PFG fractionation of |
Not |
I-digested DNA from a mouse cell line that contains chro- |
mosome 21 as the only human component. After electrophoresis |
the gel was blotted, and the blot |
||
was hybridized with the highly repeated human-specific |
|
Alu sequence. Shown in some of the panels |
|
are size standards used to estimate the length of particular human DNA fragments. (Taken from |
|||
Sainz et al., 1992.) |
|
|
|
The smallest fragments of much interest in human macrorestriction mapping are around |
|
|
|
|
|
||||||||||||
50 kb; the least |
Alu |
-dense |
regions of |
the |
genome |
have a 10-kb spacing |
between |
|
|
Alu ’s; |
|||||||
thus in these regions the chance that a 50-kb fragment has no |
|
|
|
|
|
|
|
Alu |
is exp( |
5). The chance, |
|||||||
at random, that a 1 Mb fragment should lack an |
|
|
|
|
|
Alu |
is infinitesimal. We have actually |
||||||||||
characterized the |
distribution of |
|
Alu |
’s |
on |
more |
than |
50 |
Not |
I fragments of |
human chro- |
||||||
mosome 21. In practice, all but one contain |
|
|
|
Alu |
as detected by hybridization experiments. |
||||||||||||
The sole exception, however, is a 2.3 Mb fragment. |
The probability |
of seeing |
such |
an |
|
|
|||||||||||
event at |
random is |
|
|
e 230 assuming it |
derives from |
an |
|
|
|
Alu |
-poor region of the chromosome. |
||||||
Clearly we will have to refine our statistical picture of human DNA sequences quite con- |
|
|
|
|
|||||||||||||
siderably as more cases like this surface. |
|
|
|
|
|
|
|
|
|
|
|
|
|||||
When human DNA fragments are detected by hybridization with human-specific re- |
|
|
|
|
|||||||||||||
peated sequences the resulting distribution of intensity should still be generally propor- |
|
|
|
||||||||||||||
tional to fragment size. Note, however, that considerable variations around this mean will |
|
|
|
||||||||||||||
occur because repeated sequences tend to cluster and because small fragments with small |
|
|
|
|
|
||||||||||||
numbers of repeats on average will show typical small number fluctuations. One way to |
|
|
|
|
|||||||||||||
generate |
labeling |
intensity |
that is |
independent |
of |
fragment |
size |
is |
to |
label |
the |
ends. |
|
|
|||
252 |
PHYSICAL MAPPING |
|
|
This can |
be done |
with enzymes like polynucleotide kinase that place a |
phosphate on the |
5 -end |
of a DNA |
chain, or it can be done by filling in any inset 3 |
-ends of duplex DNA |
with DNA polymerase and radiolabeled dppN’s. This procedure is readily applied within agarose gels, and it has been useful in the analysis of small genomes. For mammalian genomes the procedure is not useful because there is no specific way to label just the ends of the human DNA fragments in a rodent hybrid cell.
MAPPING IN CASES WHERE FRAGMENT LENGTHS CAN BE
MEASURED DIRECTLY
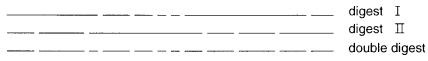
The classical approach to constructing restriction maps of small DNAs like plasmids and viruses is illustrated in Figure 8.15. Two or more restriction enzymes are used separately and in double digests to fragment the DNA of interest. The sizes of all pieces seen in an ethidium-stained gel are measured. Usually the pattern of sizes allows alignment of the different cutting sites in a single map. This procedure is clearly not a rigorous one, and it breaks down severely once the maps become complex, or when many similar-sized frag-
ments are involved. In principle, each fragment could be isolated by electrophoretic fractionation, radiolabeled, and used as a probe. This would allow all overlapping fragments from digests with other enzymes to be unambiguously identified. In practice, however, it is usually easier to employ partial digestion strategies with end-labeled probes, as we will describe later for macrorestriction mapping.
With mammalian DNAs, multiple restriction enzyme digest mapping is much less effective. Although one can determine the size of the fragments generated by each enzyme, by using repeated sequence hybridizations, there is an annoying tendency for many of the restriction enzymes that yield large DNA fragments to cut in the same regions. This is because most such enzymes prefer HTF islands. Thus the usefulness of double digestion in most regions of mammalian genomes is far less than illustrated by the example in Figure 8.15. A more serious problem is that with large numbers of fragments in single-enzyme
digests, double |
digests become hopelessly complicated to analyze. |
With |
mammalian |
|
DNA, in contrast to DNA from simple genomes, one cannot |
easily access |
each |
purified |
|
fragment because it |
is contaminated by other human or rodent |
fragments. PCR can help |
||
circumvent this problem, as we will demonstrate in Chapter 14. In general, though, one must rely on hybridization with single-copy probes in order to simplify the pattern of
DNA fragments to the point where it can be analyzed. The example in Figure 8.15 shows clearly that fragments from the end of large DNA pieces are particularly useful hybridization probes. The figure also indicates that with only a limited set of probes from the region, double digests are frequently impossible to analyze because many of the fragments in these digests will not correspond to any of the available probes. This discussion should make it clear that new strategies had to be developed to simplify the construction of macrorestriction maps of segments of complex genomes.
Figure 8.15 Schematic illustration of the double digestion procedure used to assemble simple restriction maps.
|
|
|
|
|
|
|
|
GENERATION |
OF LARGER |
DNA |
FRAGMENT |
SIZES |
|
253 |
||||||||||||
GENERATION OF LARGER DNA FRAGMENT SIZES |
|
|
|
|
|
|
|
|
|
|
|
|
|
|
|
|
|
|
|
|||||||
Some of the problems illustrated by the example in Figure 8.15 |
would |
be |
alleviated |
if |
|
|
|
|
|
|||||||||||||||||
there were a systematic way to generate large DNA fragments in a region of interest. One |
|
|
|
|
|
|
|
|||||||||||||||||||
general approach for doing this will be discussed here; others, like the RARE method, are |
|
|
|
|
||||||||||||||||||||||
deferred to Chapter 14. |
|
|
|
|
|
|
|
|
|
|
|
|
|
|
|
|
|
|
|
|
|
|
|
|||
It |
has |
already |
been |
mentioned |
that |
most |
restriction |
enzymes |
are |
inhibited |
by |
|
|
|
|
|||||||||||
DNA methylation. One can take advantage of this to increase the specificity of certain re- |
|
|
|
|
|
|
|
|||||||||||||||||||
striction enzymes by methylating a subset of their cutting sites. Methylation can also be |
|
|
|
|
|
|||||||||||||||||||||
used as a general way to promote partial digests by using a methylase that recognizes all |
|
|
|
|
|
|
|
|||||||||||||||||||
the cutting sites but does not allow the reaction to go to completion. Here, however, we |
|
|
|
|
|
|||||||||||||||||||||
deal with methylation reactions that are carried to completion. |
Consider the DNA se- |
|
|
|
|
|
|
|
||||||||||||||||||
quence shown below. It contains a |
|
|
|
Not |
I |
site flanked |
|
by |
additional G–C |
pairs |
shown |
in |
|
|||||||||||||
boldface: |
|
|
|
|
|
|
|
|
|
|
|
|
|
|
|
|
|
|
|
|
|
|
|
|
|
|
|
|
|
|
|
CG |
CGGCCG |
CG |
|
: m CG |
|
|
CGGC |
m |
CGCG |
|
|
|
|
||||||||
|
|
|
|
|
GC |
GCCGGC |
GC |
|
|
|
GC |
|
|
|
G |
m |
CCGGC |
G |
m C |
|
|
|
||||
Roughly one-quarter of all |
|
|
Not |
I sites |
will |
have |
an extra |
C |
at |
their |
5 |
|
|
-end; an additional |
|
|||||||||||
quarter will have an extra G at their 3 |
|
|
|
-end |
as shown |
in |
the |
above example. These |
extra |
|
|
|||||||||||||||
residues |
generate a |
recognition site |
for |
the |
|
|
|
|
|
Fnu |
D |
II |
methylase that converts CGCG to |
|
||||||||||||
m CGCG. Since some of the methylation is within the |
|
|
|
|
|
|
|
|
|
|
Not I cutting site, this inhibits any |
|
||||||||||||||
subsequent attempts to cleave the site with |
|
|
|
|
Not I. Thus by methylation one can inactivate |
|
||||||||||||||||||||
about half of all the |
|
Not |
I cleavage sites and double the average |
fragment size generated |
|
|
|
|||||||||||||||||||
by this enzyme. Many variations on this theme exist. |
|
|
|
|
|
|
|
|
|
|
|
|
|
|
|
|
|
|
||||||||
Methylation also plays a key role in a whole set of potential schemes for site-selective |
|
|
|
|
|
|||||||||||||||||||||
cleavage of DNA employing the unusual restriction endonuclease |
|
|
|
|
|
|
|
|
|
|
|
|
Dpn |
I. This enzyme |
|
|||||||||||
recognizes the sequence GATC, but it requires that the A |
be |
methylated |
in |
order |
for |
|
|
|
|
|
||||||||||||||||
cleavage to occur. The preferred substrate is |
|
|
|
|
|
|
|
|
|
|
|
|
|
|
|
|
|
|
|
|||||||
|
|
|
|
|
|
|
|
|
|
G m |
ATC |
|
|
|
|
|
|
|
|
|
|
|
|
|
||
|
|
|
|
|
|
|
|
|
|
CT |
m |
AG |
|
|
|
|
|
|
|
|
|
|
|
|
|
|
A major complication is that the monomethyl |
derivative |
is |
also |
cut, |
but |
much more |
|
|
|
|
|
|
||||||||||||||
slowly. Hence, in the schemes described below, it is essential to expose the DNA sub- |
|
|
|
|
|
|||||||||||||||||||||
strate to |
|
Dpn |
I |
for |
the minimum |
time |
needed |
to |
cleave |
at |
the desired |
sites before |
the |
|
|
|
|
|||||||||
background of undesired additional cleavages becomes overwhelming. |
|
|
|
|
|
|
|
|
|
|
|
|
|
|
|
|||||||||||
Dpn |
I is converted to an infrequently cutting enzyme by starting with unmethylated |
|
|
|
|
|
||||||||||||||||||||
target DNA, |
which |
|
|
Dpn |
I cannot |
cleave |
at |
all, and |
selectively |
introducing |
methyl |
groups |
|
|
||||||||||||
by treatment with methylases with recognition sequences that overlap |
part |
of |
the |
|
|
|
|
|
|
|
Dpn |
I |
||||||||||||||
site. The simplest example, shown below, employs the |
|
|
|
|
|
|
|
|
|
Taq |
|
I methylase. This enzyme rec- |
|
|||||||||||||
ognizes the sequence TCGA and converts it to TCG |
|
|
|
|
|
|
|
|
|
m |
A. If |
two |
such |
sequences |
lie adja- |
|
||||||||||
cent to each other in a genome, the result, once both are methylated is |
|
|
|
|
|
|
|
|
|
|
|
|
|
|||||||||||||
|
|
|
|
|
|
|
|
|
TCG |
m ATCG |
m |
A |
|
|
|
|
|
|
|
|
|
|
|
|||
|
|
|
|
|
|
|
|
|
m AGCT |
|
m |
AGCT |
|
|
|
|
|
|
|
|
|
|
|
|
|
|