

Berrar D. et al. - Practical Approach to Microarray Data Analysis
.pdf334 |
Chapter 19 |
4.4Extensions of Existing Data Mining Software
As mentioned in Section 4.2, some comprehensive software packages promptly incorporate the latest analysis developments by plugin modules. For example, ArrayMiner is a new clustering tool using proprietary clustering algorithms and is available as a standalone tool or plugin of GeneSpring, a comprehensive software. Besides, there are a few tools that extend the power of an analysis by providing intuitive visualization functionalities. For example, TreeView, Slcview and Freeview are the dendrogram and clusterogram viewers for the famous classical clustering software – Cluster (Eisen et al. 1998).
19. Microarray Software Review |
335 |
5.STATISTICS SOFTWARE AND TECHNICAL PROGRAMMING LANGUAGES
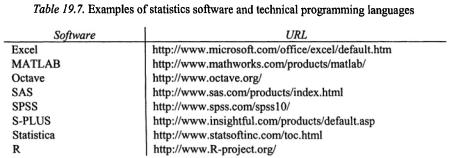
No matter how advanced or complicated is the analysis, it must be based on valid statistical fundamentals which should be easily handled by statistics software or technical programming languages that can perform statistical analysis. Actually, numerous microarray publications report on the use of such software to perform data analyses like clustering and statistical inference of differential expression. Table 19.7 shows some commonly used statistical software and technical programming languages. A common feature of these software packages is their flexibility that every step of the analysis can be fine-tuned by appropriate programming. As commonly-used statistical analyses are their standard components, analyses with different perspectives can be easily carried out. Most of them are command-line driven and can extend their functionality by programming new tools as extensions. This allows the incorporation of new analyses promptly.
However, the command-line driven nature of this type of software comes with a price, which is the impossibility of learning this type of software intuitively. In the meantime, users are required to have a thorough understanding of the structure of their data, and the statistical background and limitations of a particular analysis. Furthermore, they need to learn the technical programming language per se in order to perform even an operation, not to mention conducting the whole analysis correctly. Therefore the novice will need to spend extra efforts to get used to that analysis environment. We believe this is actually an advantage in disguise. The difficulties that the novice encounters during the learning stage can actually help to build up his/her foundations on proper analysis and in turn generate analysis results of better quality.
5.1R Packages for Microarray Analysis
R is a language and environment for statistical computing and graphics. It has immense potential for microarray data analysis. It is an open source
336 |
Chapter 19 |
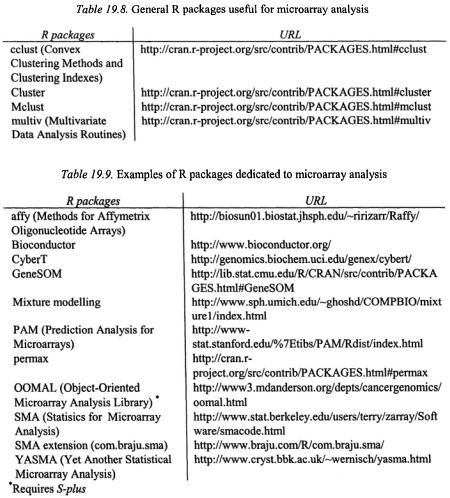
software available under GNU10 General Public Licence (GPL)11. It is very similar to the S system and is highly compatible with S-Plus. R provides a wide variety of statistical tools, which can be very useful for microarray data analysis (Table 19.8). It is also highly extensible and allows users to add additional functionalities by defining new functions. There are numerous dedicated efforts to write R extensions, called “packages”, for microarray analysis nowadays and some of these packages are listed in Table 19.9.
For example, the SMA package provides a cutting-edge data intensity and spatial dependent normalization method called print-tip grouped LOWESS,
10GNU project: http://www.gnu.org
11GPL: http://www.R-project.org/COPYING
19. Microarray Software Review |
337 |
as well as an empirical Bayes method for replicated microarray data analysis (Yang et al., 2002; Lönnstedt et al, 2002). Bioconductor is an ambitious project which aims at providing a bioinformatics infrastructure to assist the development of tools for analyzing genomics data, with primary emphasis on microarray analysis. Most of the software produced by Bioconductor project will be in the form of R packages. Apparently R environment can provide a common platform to link together different groups with common interest in microarray data analysis. Users can have unlimited capability and flexibility to embrace new analyses under such an open source standardized environment (Stewart et al., 2001). We have witnessed the success of open source software like Linux in computing science and The European Molecular Biology Open Software Suite (EMBOSS) for molecular biology, and foresee a similar development in the microarray analysis field. Therefore, we recommend to everyone who is serious in microarray data analysis to start learning a high-level statistical language like R, to be prepared for the future challenges in this fast evolving data analysis era. We also recommend a few books (Selvin, 1998; Venables and Ripley, 1999; Krause and Olson, 2000) that we have found very helpful in learning R/S- Plus for statistical analysis.
6.PATHWAY RECONSTRUCTION SOFTWARE
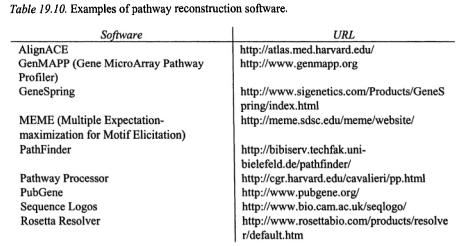
A gene never acts alone in a biological system. Functional mapping by data analysis permits a better understanding of the underlying biological networks and correlation between genotype and phenotype (Horvath and Baur, 2000; Leung and Pang, 2002; Leung 2002). Currently, targeted mutation (Roberts et al., 2000; Hughes et al., 2000) or time series/cell cycle expression profiling experiments (Tavazoie et al., 1999) are the most feasible methods of network reconstruction. These experiments share the common goal of identifying cause-consequence relationships. The targeted mutation experiment, in particular, can provide direct evidence about which genes are controlled by other genes. For example, Tavazoie et al. (1999) performed clustering in their cell cycle expression dataset and identified upstream DNA sequence elements specific to each cluster by AlignACE (Roth et al., 1998). This might provide clues to uncover the putative cis-regulatory elements that co-regulate the genes within that cluster. There is also an increasing interest in investigating various reverse engineering approaches like Boolean network (D'haeseleer et al., 2000), Bayesian network (Chapter 8) or Singular Value Decomposition (Chapter 5) to identify the gene network architecture from gene activity profiles. A more thorough review on various developing network reconstruction techniques were detailed by de Jong (2002). A list of useful software for achieving this purpose is shown in Table 19.10. Some of
338 |
Chapter 19 |
them like AlignACE, MEME, Sequence Logos and GeneSpring are helpful for finding upstream consensus elements, while GenMAPP, Rosetta Resolver and Pathway Processor are capable of visualizing the reconstructed pathways.
There are two challenges for pathway reconstruction in the future. Firstly, more sophisticated statistical tests are essential to address the likelihoods of the inferred pathways. Recently, Grosu et al. (2002) developed a pathway construction software called Pathway Processor that not only can visualize expression data on metabolic pathways, but also evaluate which metabolic pathways are most affected by transcriptional changes in whole-genome expression experiments. Using Fisher’s exact test, biochemical pathways are scored according to the probability that as many or more genes in a pathway would be significantly altered in a given experiment than by chance alone.
The second challenge is in fact a grand challenge for biologists in the post-genomic era. The focus on pathway reconstruction has been mostly qualitative and trying to obtain the most probable global interaction network from the data. However, we should not neglect that a gene interaction network, as well as the biological system, is actually a dynamic system that is controlled by numerous parameters, which in turn affect the ultimate response to a particular situation. For example, proteins might be regulated by various post-translational modifications and have different sub-cellular localization, substrates and intermediates might have different initial concentrations, enzymes might have different rate constants, reactions being catalyzed might have different equilibrium constants and protein-protein interactions between the pathway members might have different affinity/dissociation constants. Merely identifying a qualitative topological
19. Microarray Software Review |
339 |
pathway network without addressing its dynamical behavior is inadequate to provide a thorough understanding of the complex nature of the biological system being studied.
Unfortunately, it is not a trivial task to obtain all these information, especially on a genomic scale. This is because many of the genes that are supposed to be involved in a functional pathway have yet to be identified from the finished genome sequences. Their basic functions have yet to be characterized, not to mention all those kinetic parameters. An integration of microarray analysis with other genomics approaches like proteomics (Hebestreit, 2001) and metabolomics (Fiehn, 2002; Phelps et al., 2002) is critical to obtain the essential information to reveal the complete picture of the system. When there is enough information, a relatively complex quantitative pathway model can be constructed which aids the understanding of complex dynamical behavior of biological pathways and systems (Leung et al., 2001). For instance, Schoeberl et al. (2002) constructed a model based on ordinary differential equations to describe the dynamics of the epidermal growth factor (EGF) signal transduction pathway in which the changes in concentration over time of 94 compounds after EGF stimulation were calculated. The model provides insight into EGF signal transduction and is useful for generating new experimental hypotheses.
7.DATABASE AND LABORATORY INFORMATION MANAGEMENT SYSTEM (LIMS) SOFTWARE & PUBLIC MICROARRAY DATABASES
Database and Laboratory Information Management System (LIMS) software has a unique position in microarray software. There are different data being generated at various stages of a microarray experiment, for example, clone and plate identities, microarray configurations, arraying conditions, raw signal intensities and analyzed data. Although LIMS tends to concentrate on the earlier stage of array manufacturing information management while database focuses more on the later stage - archival of analyzed data -, they share the common function to record and organize a large collection of data for rapid search and retrieval. The comparison among different sets of experiments is the basis of microarray analysis and faithful archival of information from various stages is critical for making this comparison meaningful and efficient.
Table 19.11 lists some of the common microarray database/LIMS software packages available nowadays. Most of them are based on relational database architecture that is either proprietary (Genedirector), using open source database like PostgreSQL (Genetraffic) or interfacing with commercially available databases like Oracle (SMD). A detailed comparison

340 |
Chapter 19 |
of microarray database software has been detailed elsewhere (GardinerGarden and Littlejohn, 2001). The future microarray database/LIMS development and even the experimental design should consider following a common standard like MIAME so that researchers can compare the results from different sources readily.
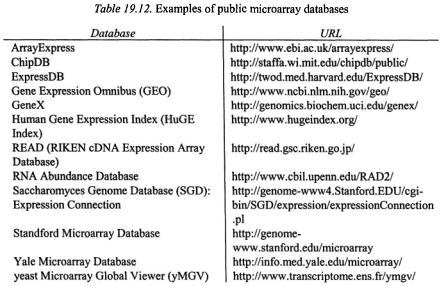
A closely related species of database software is public microarray database, a public repository of microarray data (Table 19.12). Having public databases are essential for the research community because they can provide raw data to validate published array results and aid the development of new data analysis tools. They also permit further understanding of your own data by comparing with the data from other groups or even metamining12. We believe the future public microarray databases should segregate into different specialties. There should be a generic database to allow everyone to deposit his data, a species-specific database that concentrates on particular species (e.g., yeast, Arabidopsis and Drosophila), and a disease specific database (e.g., cancer and cardiovascular). Such differentiation would greatly help the advance of research in different fields. However there
12Meta-mining refers to higher order data mining from the results of previous data mining results.
19. Microarray Software Review |
341 |
are many concerns raised on the effective ways for data dissemination, quality of the deposited data and protection of intellectual property (IP) rights for submitting data to public databases (Miles, 2001; Becker, 2001; Geschwind, 2001). These concerns have exemplified the urgent need to develop a practical microarray standard for the sake of data comparison and thoroughly discuss the IP issues among the research communities.
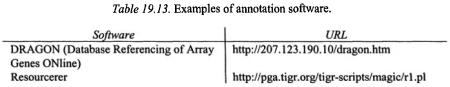
8.ANNOTATION SOFTWARE
Annotation software annotates the genes on the array by cross-referencing to public databases (Table 19.13). This type of software as well as a lot of turnkey systems and comprehensive software provide different levels of annotation functions. Gene Ontology (GO) database13 is perhaps the most important database that every annotation software should refer to. GO provides a dynamic and well-controlled vocabulary for the description of the molecular functions, biological processes and cellular components of gene products that can be applied to all organisms even when the knowledge of gene and protein functions in cells is accumulating and changing. This is very useful for comprehending the functions of differentially regulated genes and pathways in which the clusters of genes are being co-regulated.
13 http://www.geneontology.org
342 |
Chapter 19 |
9.CONCLUSION
Information is the king and knowledge is the queen in this post-genomics era. He who can mine the useful information from the messy raw data and turn it into knowledge is God. The software that helps the mining process is Michael the Archangel who leads the victorious battle against the complex biological problems. If you want to win the battle, start working with your angel now!
ACKNOWLEDGEMENTS
We would like to thank Dr. Duccio Cavalieri from Bauer Center of Genomics Research, Harvard University, for his insightful discussion on Pathway Processor, and Ms. Alice Y.M. Lee for her assistance in proofreading this manuscript.
REFERENCES
Becker KG. (2001). The sharing of cDNA microarray data. Nat Rev Neurosci. 2:438-440.
Brazma A,, Vilo J. (2000) Gene expression data analysis. FEBS Lett. 480:17-24.
Brazma A., Hingamp P., Quackenbush J., Sherlock G., Spellman P., Stoeckert C., Aach J., Ansorge W., Ball C.A., Causton H.C., Gaasterland T., Glenisson P., Holstege F.C., Kim I.F., Markowitz V., Matese J.C., Parkinson H., Robinson A., Sarkans U., Schulze-Kremer S., Stewart J., Taylor R., Vilo J., Vingron M. (2001) Minimum information about a microarray experiment (MIAME)-toward standards for microarray data. Nat Genet. 29:365-371.
D'haeseleer P., Liang S., Somogyi R. (2000). Genetic network inference: from co-expression clustering to reverse engineering. Bioinformatics. 16:707-726.
de Jong H. (2002). Modeling and simulation of genetic regulatory systems: a literature review. J Comput Biol. 9:67–103.
Eisen M.B., Spellman P.T., Brown P.O., Botstein D. (1998). Cluster analysis and display of genome-wide expression patterns. Proc Natl Acad Sci USA. 95:14863-14868.
Fiehn 0. (2002). Metabolomics--the link between genotypes and phenotypes. Mol Biol. 48:155-171.
Gardiner-Garden M., Littlejohn T.G. (2001), A comparison of microarray databases. Brief Bioinform. 2:143-158.
Geschwind D.H. (2001). Sharing gene expression data: an array of options. Nat Rev Neurosci. 2:435-438.
19. Microarray Software Review |
343 |
Grosu P., Townsend J.P., Hartl D.L., Cavalieri D. (2002). Pathway Processor: a tool for integrating whole-genome expression results into metabolic networks. Genome Res. 12:1121-1126.
Hebestreit H.F. (2001). Proteomics: an holistic analysis of nature's proteins. Curr Opin Pharmacol. 2001; 1:513-520.
Horvath S., Baur M.P. (2000). Future directions of research in statistical genetics. Stat Med. 19:3337–3343.
Hughes T.R., Marton M.J., Jones A.R., Roberts C.J., Stoughton R., Armour C.D., Bennett H.A., Coffey E., Dai H., He Y.D., Kidd M.J., King A.M., Meyer M.R., Slade D., Lum P.Y., Stepaniants S.B., Shoemaker D.D., Gachotte D., Chakraburtty K., Simon J., Bard M., Friend S.H. (2000). Functional discovery via a compendium of expression profiles. Cell. 102:109-26.
Jain A.N., Tokuyasu T.A., Snijders A.M., Segraves R., Albertson D.G., Pinkel D. (2002). Fully automatic quantification of microarray image data. Genome Res. 12:325-332.
Jagota A. (2001). Microarray Data Analysis and Visualization. Bioinformatics by the Bay Press.
Knuden S. (2002). A Biologist’s Guide to Analysis of DNA Microarray Data. New York: John Wiley & Sons, 2002.
Krause A., Olson M. (2000). The Basics of S and S-Plus. New York: Springer Verlag.
Leung Y.F., Lam D.S.C., Pang C.P. (2001). In silico biology: observation, modeling, hypothesis and verification. Trends Genet. 17:622-623.
Leung Y.F. (2002). Microarray data analysis for dummies... and experts too? Trends Biochem Sci. in press.
Leung Y.F., Pang C.P. (2002). Eye on bioinformatics – dissecting complex disease trait in silico. Applied Bioinform., in press.
Leung Y.F., Tam P.O.S., Lee W.S., Yam G.H.F., Chua J.K.H., Lam D.S.C., Pang C.P. (2002). The dual role of dexamethasone on anti-inflammation and outflow resistance in human trabecular meshwork. Submitted.
Lönnstedt I,, Speed T.P. (2002). Replicated Microarray Data. Stat Sinica 12:31-46.
Miles M.F. (2001). Microarrays: lost in a storm of data? Nat Rev Neurosci. 2:441-443.
Nadon R., Shoemaker J. (2002). Statistical issues with microarrays: processing and analysis. Trends Genet. 18:265-271.
Phelps T.J., Palumbo A.V., Beliaev A.S. (2002). Metabolomics and microarrays for improved understanding of phenotypic characteristics controlled by both genomics and environmental constraints. Curr Opin Biotechnol. 13:20-24.
Quackenbush J. (2001). Computational genetics computational analysis of microarray data. Nat Rev Genet. 2:418-427.
Roberts C.J., Nelson B., Marton M.J., Stoughton R., Meyer M.R., Bennett H.A., He Y.D., Dai H., Walker W.L., Hughes T.R., Tyers M., Boone C., Friend S.H. (2000). Signaling and circuitry of multiple MAPK pathways revealed by a matrix of global gene expression profiles. Science 287:873-880.
Roth F.P., Hughes J.D., Estep P.W., Church G.M. (1998). Finding DNA regulatory motifs within unaligned noncoding sequences clustered by whole-genome mRNA quantitation. Nat Biotechnol. 16:939–945.