

Berrar D. et al. - Practical Approach to Microarray Data Analysis
.pdf324 |
Chapter 18 |
Pietu G., Mariage-Samson R., Fayein N.-A., Matingou C., Eveno E. et al. (1999). The genexpress IMAGE knowledge base of the human brain transcriptome: A prototype integrated resource for functional and computational genomics. Genome Research, 9:195209.
Proteome (2002). Proteome BioKnowledge Library. Technical report, Incyte Genomics. Available at http://www.incyte.com/sequence/proteome.
Raychaudhuri S., Stuart J.M., and Altman R. (2000). Principal components analysis to summarize microarray experiments: Application to sporulation time series. In Proceedings of the Pacific Symposium on Biocomputing, volume 5, pages 452-463.
Roberts C.J., Nelson B., Marton M.J., Stoughton R., Meyer M.R., Bennett H.A., He Y.D., Dia H., Walker W.L., Hughes T.R., Tyers M., Boone C., and Friend S.H. (2000). Signaling and circuitry of multiple MAPK pathways revealed by a matrix of global gene expression profiles. Science, 287:873-880.
Sallinen S., Sallinen P., Haapasalo H., Helin H., Helen P., Schraml P., Kallioniemi O., and Kononen J. (2000), Identification of differentially expressed genes in human gliomas by DNA microarray and tissue chip techniques. Cancer Research, 60(23):6617-6622.
Sapir M. and Churchill G.A. (2000). Estimating the posterior probability of differential gene expression from microarray data. Technical Report, Jackson Labs, Bar Harbor, ME. Available at http://www.jax.org/research/churchill/pubs/.
Schena M. (2000). Microarray Biochip Technology. Eaton Publishing.
Schena M., Shalon D., Davis R., and Brown P. (1995). Quantitative monitoring of gene expression patterns with a complementary DNA microarray. Science, 270:467-470.
Schena M., Shalon D., Heller R., Chai A., Brown P., and Davis R., (1996) Parallel human genome analysis: microarray-based expression monitoring of 1000 genes. Proc. National Academy of Science USA, 93:10614-10519.
Schraml P., Kononen J., Bubendorf L., Moch H., Bissig H., Nocito A., Mihatsch M., Kallioniemi O., and Sauter G., (1999). Tissue microarrays for gene amplification surveys in many different tumor types. Clinical Cancer Research, 5(8):1966-1975.
Sese J., Nikaidou H., Kawamoto S., Minesaki Y., Morishita S., and Okubo K. (2001). BodyMap incorporated PCR-based expression proling data and a gene ranking system. Nucleic Acids Research, 29(1):156-158.
Shalon D., Smith S.J., and Brown P.O. (1996). A DNA microarray system for analyzing complex DNA samples using two-color fluorescent probe hybridization. Genome Research, 6:639-645.
Sherlock G., Hernandez-Boussard T., Kasarskis A., Binkley G. et al. (2001). The Stanford Microarray Database, Nucleic Acid Research, 29(1):152-155.
Shi L. (2001). DNA microarray – monitoring the genome on a chip. Technical report. Available at http://www.gene-chips.com/.
Stanford (2001). SMD - Stanford Microarray Database. Technical report, Stanford University. Available at http://genome-www4.Stanford.EDU/MicroArray/SMD/.
Stokes M.E., Davis C.S., and Koch G.G. Categorical Data Analysis Using the SAS System. SAS Institute, Carry, NC.
Sudarsanam P., Iyer V.R., Brown P.O., and Winston F. (2000). Whole-genome expression analysis of snf/swi mutants of Saccharomyces cerevisiae. Proc. Natl. Acad. Sci., 97(7):3364-3369.
Tamayo P., Slonim D., Mesirov J., Zhu Q., Kitareewan S., Dmitrovsky E., Lander E.S., and Golub T.R. (1999). Interpreting patterns of gene expression with self-organizing maps:
18. Global Functional Profiling of Gene Expression Data |
325 |
Methods and application to hematopoietic differentiation. Proc. Natl. Acad. Sci, 96:29072912.
Tao H., Bausch C., Richmond C., Blattner F.R., and Conway T. (1999). Functional genomics: Expression analysis of Escherichia coli growing on minimal and rich media. Journal of Bacteriology, 181(20):6425-6440.
Tavazoie S., Hughes J.D., Campbell M.J., Cho R.J., and Church G.M. (1999). Systematic determination of genetic network architecture. Nature Genetics, 22:281-285.
ter Linde J.J. M., Liang H., Davis R.W., Steensma H.Y., Dijken J.P. V., and Pronk J.T. (1999). Genome-wide transcriptional analysis of aerobic and anaerobic chemostat cultures of Saccharomyces cerevisiae. Journal of Bacteriology, 181(24):7409-7413.
Tracy S. (2002). Onto-Express – a tool for high-throughput functional analysis. Scientific Computing and Instrumentation, in press.
Tsoka S. and Ouzounis C.A, (2000). Recent developments and future directions in computational genomics. Federation of European Biochemical Societies Letters, (23897):1-7.
Uehling M. (2002). Open Channel Software Revamps Onto-Express, Technical report, BioIT World. Available at http://www.bio-itworld.com/products/050702_onto-express.html.
van Helden J., Rios A.F., and Collado-Vides J. (2000). Discovering regulatory elements in non-coding sequences by analysis of spaced dyads. Nucleic Acids Research, 28(8):18081818.
van’t Veer L.J., Dai H., van de Vijver M.J., He Y.D. et al. (2002). Gene expression profiling predicts clinical outcome of breast cancer. Nature, 415:530-536.
Vasmatzis G., Essand M., Brinkmann U., Lee B., and Pastan I, (1995). Discovery of three genes specifically expressed in human prostate by expressed sequence tag database analysis. Proc. of the National Academy of Science USA, 95(1):300-304.
Velculescu V., Zhang L., Vogelstein B., and Kinzler K. (1995). Serial analysis of gene expression. Science, 270(5235):484-487.
Venter J.C., Adams M.D. et al. (2001). The sequence of the human genome. Science, 291(5507):1304-1351.
Vukmirovic O.G. and Tilghman S.M. (2000). Exploring genome space. Nature, 405:820-822. Waugh M.E., Bulmore D.L., Farmer A.D., Steadman P.A, et al. (2000). PathDB: A metabolic database with sophisticated search and visualization tools. In Proc. of Plant and Animal
Genome VIII Conference, San Diego, CA, January 9-12.
Wellmann A., Thieblemont C., Pittaluga S., Sakai A. et al. (2000). Detection of differentially expressed genes in lymphomas using cDNA arrays: identification of clustering as a new diagnostic marker for anaplastic large-cell lymphomas, Blood, 96(2):398-404.
White K.P., Rifkin S.A., Hurban P., and Hogness D.S. (1999). Microarray analysis of Drosophila development during metamorphosis. Science, 286:2179-2184.
Wu L., Hughes T., Davierwala A., Robinson M., Stoughton R., and Altschuler S. (2002). Large-scale prediction of saccharomyces cerevisiae gene function using overlapping transcriptional clusters. Nature Genetics, 31(3):255-265.
Zhu J. and Zhang M. (2000). Cluster, function and promoter: Analysis of yeast expression array. In Pacific Symposium on Biocomputing, pages 476-487.
Chapter 19
MICROARRAY SOFTWARE REVIEW
Yuk Fai Leung1,2, Dennis Shun Chiu Lam1, Chi Pui Pang1
1Department of Ophthalmology and Visual Sciences, The Chinese University of Hong Kong, e-mail:{yfleung,dennislam,cppang}@cuhk.edu.hk
2Genomicshome.com,
e-mail: yfleung@genomicshome.com
1.INTRODUCTION
Microarray analysis is a burgeoning field in recent years. From the statistical inference of differential gene expression to expression profiling and clustering (Chapters 13-16), classification by various supervised and unsupervised algorithms (Chapters 7-12), and pathway reconstruction, microarray data analysis can provide a rich source of information that no one could imagine before. In the meantime, the great demand on data analysis capability has created an unprecedented challenge for life scientists to grasp the never-ending data analysis developments in time. The aim of this review is to provide an overview of various microarray software categorized by their purposes and characteristics, and aid the selection of suitable software. Readers are referred to a more comprehensive online version of the list1 which contains further details on the particular software system requirements, features, prices, related publications and other useful information. This online software list is an ongoing project of a functional genomics Web site2.
1 http://ihome.cuhk.edu.hk/~b400559/arraysoft.html
2 yfleung’s functional genomics home:
http://ihome.cuhk.edu.hk/~b400559 or http://genomicshome.com (permanent domain)

19. Microarray Software Review |
327 |
2.PRIMER/PROBE DESIGN SOFTWARE
The focus on microarray data analysis has been the later stages in Data Mining. However, we should not neglect the early stage and should remember that probe and experimental design affect the quality of late stage analysis. Depending on the scale and throughput of the experiment, clones can be spotted from a normalized library without prior sequencing, sequence-verified cDNA clones such as expressed sequence tags (ESTs), specific parts of genes, or even specific oligonucleotides. A list of software for probe and the corresponding primer design is shown in Table 19.1.
There are a number of considerations when using EST clones (Tomiuk and Hofman, 2001). For example, rigorous informatic analysis is necessary to eliminate their redundancies, given the fact that nonidentical clones might actually correspond to the same gene, and some clones that correspond to different genes might be accidentally assigned to the same gene by chimeric EST clones generated during cDNA library construction or because of the existence of physiologically overlapping transcribed regions. There are also situations such as alternative splicing3, alternative polyadenylation4 and alternative promoter usage5 that can produce variants of a single gene. These confounding factors should also be considered during probe selection. In these situations the same cDNA probe would probably bind many variants of the same gene and give a mixed signal. At the same time the human genome contains many gene families with only subtle sequence differences. They are quite difficult to be differentiated by cDNA probes. Therefore many
3 Alternative splicing refers to a gene regulatory mechanism in which more than one mRNA product being produced due to distinct exon splicing events of a common mRNA.
4 Alternative polyadenylation refers to a gene regulatory mechanism in which more than one mRNA product being produced due to different polyadenylation signals are used in the untranslated 3’ end of a gene.
5 Alternative promoter usage refers to a gene regulatory mechanism in which more than one mRNA product being produced due to different promoters are used in the 5’ end of a gene.

328 Chapter 19
researchers are seriously investigating on the use of oligonucleotides that can be specifically designed to hybridize to a single variant.
In our opinion, this pre-experimental informatic endeavor is very important. When we performed a microarray experiment on our in vitro glaucoma model, using a commercial cDNA microarray as our platform, the problems of clone redundancy and inaccuracy were only apparent at the later stage in analysis (Leung et al., 2002). For example, two clones with exactly the same sequence annotation in the curated database were included in the array due to earlier different annotations in other databases. A hybrid clone only produced in cancerous translocation was also found to be differentially expressed. However this translocation is not very likely to happen in glaucoma and created a difficulty in addressing the differential expression to the particular gene domain in the hybrid clone. We believe these problems could have been eliminated by proper probe selection and array design, in particular using oligonucleotide arrays.
3.IMAGE ANALYSIS SOFTWARE
There are three fundamental processes of image analysis: gridding6, segmentation7 and information extraction8 (Yang et al., 2001), which are the standard functions in commonly used image analysis software (Table 19.2).
6 Gridding is a process to locate each spot on the slide.
7 Segmentation is a process to differentiate the pixels within a spot-containing region into foreground (true signal) and background,
8 Information extraction includes two parts, the spot intensity extraction and background intensity extraction. Spot intensity extraction refers to the calculation of fluorescence signal from the foreground from segmentation process, while background intensity extraction utilizes different algorithms to estimate the background signal due to the nonspecific hybridization on the glass.

19. Microarray Software Review |
329 |
Gridding appears not to be a difficult problem for most of the image analysis software, though some manual adjustments are often necessary. The greatest challenges are performing the segmentation and background estimation efficiently, because the sizes and shapes of the spots can vary considerably. There are several segmentation algorithms including fixed circle, adaptive circle, adaptive shape and histogram, whereas algorithms for background estimation include constant background, local background and morphological opening. Every method has its strengths and weaknesses. Unfortunately no single one is perfect in all situations. UCSF Spot adopts a quite different experimental segmentation approach, which applies DNA counterstain DAPI on the array (Jain et al., 2002). Only the positions with DNA would be stained. The resulting counterstain image assists the segmentation process, which apparently resolves the limitations of the algorithmic approach.
Certain commercial software packages have measures to evaluate the quality of the spots in the images. For instance in one software package there are a number of parameters including diameter, spot area, footprint, circularity, signal/noise and spot, background and replicate uniformity for judging whether a spot is of sufficiently good quality to be included in later stage analysis. However, these quality measures usually idealize the spots being analyzed, i.e. consistent spot size, circularity, and signal intensity. This can be quite deviated from reality. Thus, some spots whose signal is good enough for data analysis might be rejected because they do not fulfill the defined criteria. Therefore, many researchers are still inclined to inspect the spots by naked eye instead of relying on these automated algorithms even though hours are needed for checking arrays with tens of thousands of spots. Unfortunately different researchers might have different standards on judging the borderline cases and their intuitive standards can change from time to time. As a result, manual inspection is not sufficiently objective to maintain the quality consistency among experiments and across laboratories. There is an urgent need for a rigorous definition of a good-quality spot. We believe a combination of DNA counterstain method as mentioned before and the existing quality measures can be a plausible solution. The counterstain provides information about the actual spot morphology and DNA
330 |
Chapter 19 |
distribution in the spot, which can be a better basis for applying quality measures to evaluate the spots.
4.DATA MINING SOFTWARE
It is always perplexing to select a Data Mining software because so many similar software packages are available in the field. Many scientists are very concerned whether the software they choose is really suitable for their experimental design and able to keep up with the fast changing analysis field. At the same time, there is the cost consideration. Some commercially available Data Mining software carry a high price tag that makes it a big commitment to use them. Perhaps this anxiety stems from the fact that the majority of scientists who wish to perform microarray experiments are relatively unfamiliar with the basis of large-scale Data Mining. We wish the earlier chapters on Data Mining fundamentals have resolved this anxiety. There are also a few microarray data analysis review papers (Brazma and Vilo, 2000; Quackenbush, 2001; Wu, 2001; Sherlock, 2001; Nadon and Shoemaker, 2002) and books (Jagota, 2001; Knudsen, 2002), which are extremely helpful for learning data analysis. Here we will complement with an overview of the advantages and limitations of various sub-categories of Data Mining software.
In general, a Data Mining software performs data preprocessing (Chapters 2-3) and normalization (Chapter 4), dimensionality reduction (Chapters 5-6), statistical inference of differential expression, clustering (Chapters 13-16), and classification (Chapters 7-12), and visualization of the analysis results. It can be available as a Web tool, as a standalone solution or as a client-server application. There are roughly 4 types of Data Mining software depending on comprehensiveness: Turnkey system, comprehensive software, specific analysis software and extension/accessory software. Two other related but unique statistic and pathway reconstruction software will be further discussed in Sections 5 and 6.
4.1Turnkey System
A Turnkey system is defined as a computer system that is customized for a particular application. The term derives from the idea that the end user only needs to turn a key and the system is ready for immediate operation. A microarray turnkey Data Mining system includes everything like operating system, server software, database, client software, statistics software and even hardware customized for the whole Data Mining process. Some of the microarray turnkey Data Mining systems are listed in Table 19.3. While some of them (e.g., Genetraffic) are built on open source software like

19. Microarray Software Review |
331 |
Linux, R statistical language, PostgreSQL, and Apache Web server, some (e.g., Rosetta Resolver) are using proprietary server and database systems like SunOS and Oracle, respectively.
A Turnkey system aims at providing all components fine-tuned for microarray data analysis and supports the developing standard and language like Minimum Information About a Microarray Experiment (MIAME) (Brazma et al., 2001) and MicroArray and Gene Expression Markup Language (MAGE-ML)9, respectively. The client-server setup supports multiple users which is especially beneficial for sharing data within a large research group like in pharmaceutical companies. It also allows a better control of data security by restricting different access privileges for different user groups. However this type of software is not quite suitable for small laboratories with limited budget, partly because such commercial systems can be quite expensive. Although the cost can be much lower for those using open source software, turnkey system in general requires dedicated supporting staff for routine maintenance. This makes the installation and operation of such a system in small laboratories a substantial task, particularly in those that are inexperienced in related computer science.
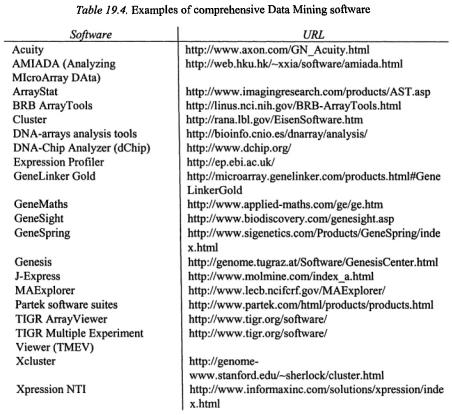
4.2Comprehensive Software
A comprehensive software incorporates many different analyses at different stages of microarray analysis like data preprocessing, dimensionality reduction, normalization, clustering and visualization in a single package (Table 19.4). This type of software does not have any accompanied database although they are usually equipped with an interface for Open DataBase Connectivity (ODBC), a standard for accessing different database systems. This interface enables the users to archive their data in commonly used databases.
9 http://www.mged.org/Workgroups/MAGE/mage-ml.html
332 |
Chapter 19 |
The advantage of using this type of software is their comprehensiveness. Most of the current data analysis tools are available within a single package. The researchers can handle various analyses with ease once they have learned the basic operations. Therefore, the total learning curve can be shorter. There are often some brilliant analytical ideas incorporated in the software that can streamline the data analysis process. For example, in GeneSight the graphical set builder allows interactive data analysis by dragging different analysis modules, like log-transformation and normalization, into the workspace. This eliminates the possibility of missing or repeating data processing steps during multi-step data analysis from raw data to final output. In GeneSpring there are automated gene annotation and ontology construction tools that mine the public databases for the possible gene functions on behalf of the users. This can considerably save time when compared to mining the databases manually.
However, there are several potential limitations for using this type of software. Firstly, there might be data compatibility problems or conversion inconvenience. Unless the software contains filters for accepting raw data
19. Microarray Software Review |
333 |
from different vendors, the users might have to re-organize the raw or preprocessed data according to the specific format themselves. Besides, the software may not be flexible enough to the latest analysis development, especially when the field is still evolving rapidly. Sometimes the users might have to wait for the next software update before the desired analytical method is being incorporated, and this can take quite long. As a result, certain comprehensive software (e.g., GeneSpring, J-express & MAExplorer) start to include the plugin functionality that allows users to create custom analysis functions promptly. The cost for using the commercially available software can be quite high for some laboratories with tight budgets. At the same time users might have to create their data archival system if the software does not have a “sister” database software. Another potential problem of this type of comprehensive software packages is their capability of performing various data analyses with ease. The inexperienced user might overlook certain statistical limitations of data analyses and generate inaccurate results, which they might still regard as valid. This can only be solved by a better knowledge on the statistical fundamentals of various analyses. Some of these limitations are also true for the turnkey system.
4.3Specific Analysis Software
Specific analysis software is defined as a software which performs only one analysis or a few specific analyses (Table 19.5). The distinction between comprehensive and specific analysis software is not clear-cut, but in general a specific analysis software is more specialized in a particularly confined analytical problem, while a comprehensive software aims at providing an all- in-one package for the general user. For example, PAM performs sample classification from gene expression data, CTWC performs clustering based on a specific algorithm and GeneGluster performs normalization and filtering, as well as clustering using Self-Organizing Map (SOM). Specific analysis software is usually accompanied with a journal article that details the statistical and mathematical background of the method. This greatly helps understanding the basis of the analysis. Cutting-edge data analysis tools are often released as specific software by their authors at personal websites. If the specific analysis is embraced by the general public, it will most probably be incorporated into other comprehensive software packages at a later stage. Since this type of software is quite specialized, substantial preprocessing and re-organization of the data might be necessary before input into the software.