

Berrar D. et al. - Practical Approach to Microarray Data Analysis
.pdf314 |
Chapter 18 |
If a binomial distribution is used, the probability of having x genes in F in a set of K randomly picked genes is given by the classical formula of the binomial probability in which the probability of extracting a gene from F is estimated by the ratio of genes in F present on the chip M / N and the corresponding p-value can be respectively calculated as:
and
The main difference between the binomial and hypergeometric distributions is that the binomial models a sampling with replacement. Thus, selecting a gene involved in F should not influence the probability of selecting another gene involved in F. However, in our experiments, we do sampling without replacement since when a gene is picked, we cannot pick it again and the set of unpicked genes in F is reduced by one, thus changing the probability of future picks from F. Because of this, the two distributions behave a bit differently. For example, one cannot use the hypergeometric to calculate the probability of having x > M genes since this would be equivalent to picking more F genes than there are on the microarray. However, the expression of the binomial probability density function will still provide a meaningful probability since in sampling with replacement one gene can be picked more than once and it is possible to pick more F genes than present on the microarray. However, the expression of the binomial probability density function will still provide a meaningful probability since in sampling with replacement one gene can be picked more than once and it is possible to pick more F genes than present on the microarray. Unfortunately, the computation of the hypergeometric distribution is not feasible for lists longer than K > 150 genes. However, for such large values, the hypergeometric distribution tends to behave like a binomial. In consequence, the binomial formula in Equation 18.3 can be used to compute the p-values.
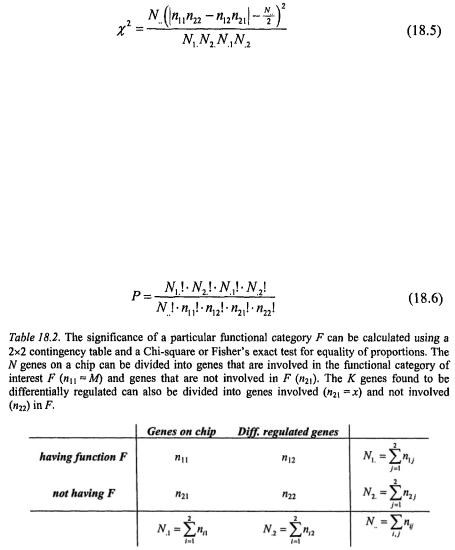
Alternative approaches include a Chi-square test for equality of proportions (Fisher and van Belle, 1993) and Fisher’s exact test (Man et al., 2000). For the purpose of applying these tests, the data can be organized as shown in Table 18.2. The dot notation for an index is used to represent the summation on that index.
18. Global Functional Profiling of Gene Expression Data |
315 |
In this notation, the number of genes on the microarray is  the number of genes in functional category F is
  the number of genes selected as differentially regulated is
  and the number of differentially regulated genes in F is
  Using this notation, the Chi-square test involves calculating the value of the
 statistics as follows:
where  in the numerator is a continuity correction term that can be omitted for large samples (Glover and Mitchell, 2002). The value thus calculated can be compared with critical values obtained from a
  distribution with df = (2 – 1)(2 – 1) = 1 degree of freedom.
However, the  test for equality of proportion cannot be used for small samples. The rule of thumb is that all expected frequencies:
 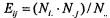 should be greater than or equal to 5 for the test to provide valid conclusions. If this is not the case, Fisher’s exact test can be
used instead (Fisher and van Belle, 1993; Kennedy et al., 1981). Fisher’s exact test considers the row and column totals  fixed and uses the hypergeometric distribution to calculate the probability of observing each individual table combination as follows:
Using this formula, one can calculate a table containing all the possible combinations of 

316 Chapter 18
The p-value corresponding to a particular occurrence is calculated as the sum of all probabilities in this table lower than the observed probability corresponding to the observed combination (Man et al., 2000).
Finally, Audic and Claverie (1997) have used a Poisson distribution and a Bayesian approach to calculate the probability of observing a given number of tags in SAGE data. As noted by Man et al. (2000), this approach can be
used directly to calculate the probability of observing |
genes of a certain |
|
functional category F in the selected subset given that there are |
such |
|
genes on the microarray: |
|
|
The p-values are calculated as a cumulative probability density function (cdf) as follows (Audic and Claverie, 1997; Man et al., 2000):
Extensive simulations performed by Man et al. compared the Chi-square test for equality of proportions with Fisher’s exact test and Audic and Claverie’s test and showed that the Chi-square test has the best power and
robustness (Man et al., 2000). |
|
Onto-Express provides implementations of the |
test, Fisher’s exact test |
as well as the binomial test. Fisher’s exact test is required when the sample size is small and the chi-square test cannot be used. For a typical microarray experiment with  genes on the chip and
  selected genes, the binomial approximates very well the hypergeometric and is used instead. For small, custom microarrays (fewer than 200 genes), the
  is used. The program calculates automatically the expected values and uses Fisher’s exact test when
 becomes unreliable (expected values less than 5). Thus, the choice between the three different models is automatic, requiring no statistical knowledge from the end-user.
We did not implement Audic and Claverie’s test because: i) it has been shown that  is at least as good (Man et al., 2000), and ii) while very appropriate for the original problem involving ESTs, the use of a Poisson distribution may be questionable for our problem.
The exact biological meaning of the calculated p-values depends on the list of genes submitted as input. For example, if the list contains genes that are upregulated and mitosis appears more often than expected,
18. Global Functional Profiling of Gene Expression Data |
317 |
the conclusion may be that the condition under study stimulates mitosis (or more generally, cell proliferation) in a statistically significant way. If the list contains genes that are downregulated and mitosis appears more often than expected (exactly as before), then the conclusion may be that the condition significantly inhibits mitosis.
4.DISCUSSION
Onto-Express has been applied to a number of publicly available data sets. For example, a microarray strategy was recently used by van ‘t Veer et al. to identify 70 genes that can be used as a predictor of clinical outcome for breast cancer (van’t Veer et al., 2002). A subsequent analysis revealed that several key mechanisms such as cell cycle, cell invasion, metastasis, angiogenesis and signal transduction genes were significantly upregulated in cases of breast cancer with poor prognosis. However, as shown below, a comprehensive global analysis of the functional role associated with the differentially regulated genes has revealed novel biological mechanisms involved in breast cancer. Using the global strategy provided by OntoExpress the 231 genes significantly correlated with breast cancer prognosis were categorized into 102 different biological processes. Seventy-two of these groups had significant p-values (p < 0:05). Of these 72 groups, only 17 are represented by two or more members of the same biological pathway. These encompass most of the processes postulated to be indicative of poor prognosis including cell cycle, cell invasion, metastasis, and signal transduction (van’t Veer et al., 2002). Interestingly, angiogenesis, cell cycle control, cell proliferation, and oncogenesis, are not significantly represented (p > 0:05) but a host of novel pathways were identified. These included protein phosphorylation, a common cellular response to growth factor stimulation and anti-apoptosis (apoptosis = programmed cell death). Both are believed to be intimately linked, acting to preserve homeostasis and developmental morphogenesis. Clearly, these processes can impact cancer. This data is used as a sample data set at: http://vortex.cs.wayne.edu. We invite the readers to login and use Onto-Express to analyze the data themselves in the light of the information provided in (van’t Veer et al., 2002).
4.1Utility, Need, and Impact
A tool such as Onto-Express can be used in two different ways. Many microarray users embark upon “hypotheses generating experiments” in which the goal is to find subsets of genes differentially regulated in a given condition. In this context, Onto-Express can be used to analyze and interpret the results of the experiment in a rigorous statistical manner (see section 3).
318 |
Chapter 18 |
However, another major application is in experiment design. An alternative to the “hypotheses generating experiments” is the “hypothesis driven experiments” in which one first constructs a hypothesis about the phenomenon under study and then performs directed experiments to test the hypothesis. Currently, no two chips offer exactly the same set of genes. There is a natural tendency to select the chip with the most genes but this may not necessarily be the best choice and certainly, not the most cost effective. When a hypothesis of a certain mechanism does exist, we argue that one should use the chip(s) that best represent the corresponding pathways. Onto-Express can suggest the best chip or set of chips to be used to test a given hypothesis. This can be accomplished by analyzing the list of genes on all existing arrays and providing information about the pathways and biological mechanisms covered by the genes on each chip. If chip A contains 10,000 genes but only 80 are related to a given pathway and chip B contains only 400 genes but 200 of them are related to the pathway of interest, the experiment may provide more information if performed with chip B instead of A. This can also translate into significant cost savings.
An early version of Onto-Express was first made available in February 2002 (Khatri et al., 2002). In the period February-June, our user base grew to 590 valid registered users from 47 countries. The web traffic analysis shows a daily average of 74.28 page views by 18.28 unique visitors (including the weekend). Onto-Express has also been mentioned in several news articles (Janssen, 2002; Tracy, 2002; Uehling, 2002). Version 1 of Onto-Express is available free of charge at: http://vortex.cs.wayne.edu. This version constructs functional profiles for the cellular role, cellular component, biological process and molecular function as well as biochemical function and chromosome location. Version 2 of Onto-Express adds the computation of the statistical significance of the results.
4.2Other Related Work and Resources
A tremendous amount of genetic data is available on-line from several public databases (DBs). NCBI provides sequence, protein, structure and genome DBs, as well a taxonomy and a literature DB. Of particular interest are UniGene (non-redundant set of gene-oriented clusters) and LocusLink (genetic loci). SWISS-PROT is a curated protein sequence DB that provides high-level annotation and a minimal level of redundancy (Bairoch and Apweiler, 2000). Kyoto Encyclopedia of Genes and Genomes (KEGG) contains a gene catalogue (annotated sequences), a pathway DB containing a graphical representation of cellular processes and a LIGAND DB (Kanehisa and Goto, 2000; Kanehisa et al., 2000; Ogata et al., 1999).
18. Global Functional Profiling of Gene Expression Data |
319 |
GenMAPP is an application that allows the user to create and store pathways in a graphic format, includes a multiple species gene database and allows a mapping of a user’s expression data on existing pathways (Dahlquist et al., 2002). Other related databases and on-line tools include: PathDB (metabolic networks) (Waugh et al., 2000), GeneX (NCGR) (source independent microarray data DB; Mangalam et al., 2001), Arrayexpress (EBI, 2001a), SAGEmap (Lash et al., 2000),  (EBI, 2001a), ArrayDB (NHGRI, 2001), ExpressDB (Aach et al., 2000), and Stanford Microarray Database (Sherlock et al., 2001; Stanford, 2001). Two meta-sites containing information about various genomic and microarray on-line DBs are (Shi, 2001) and (CNRS, 2001).
Data format standardization is necessary in order to automate data processing (Brazma, 2001). The Microarray Gene Expression Data Group (MGED) is working to standardize the Minimum Information About a Microarray Experiment (MIAME), the format (MAGE) and ontologies and normalization procedures related to microarray data (Brazma et al., 2001; EBI, 2001b). Of particular interest is the Gene Ontology (GO) effort which aims to produce a dynamic, controlled vocabulary that can be applied to all organisms even as knowledge of gene and protein roles in cells is accumulating and changing (Ashburner et al., 2000; Ashburner et al., 2001). Expression profiles of genes across tissues can be obtained with tissue microarrays (Kononen et al., 1998; Bubendorf et al., 1999a; Bubendorf et al., 1999b; Schraml et al., 1999;Sallinen et al., 2000; Moch et al., 2001; Nocito et al., 200la; Nocito et al., 2001b; mousses et al., 2002). Other techniques allowing a high-throughput screening includes the Serial Analysis of Gene Expression (SAGE) (Velculescu et al., 1995) and PowerBlots (Biosciences, 2002). Although such techniques have very high throughput when compared with techniques such as Northern blots or RT-PCR, they still require a considerable amount of laboratory effort. Data mining of the human dbEST has been used previously to determine tissue gene expression profiles (Bortoluzzi et al., 2000; Hishiki et al., 2000; Hwang et al., 2000; Sese et al., 2001; Vasmatzis et al., 1995).
5.CONCLUSION
In contrast to the approach of looking for key genes of known specific pathways or mechanisms, global functional profiling is a high-throughput approach that can reveal the biological mechanisms involved in a given condition. Onto-Express is a tool that translates the gene expression profiles showing how various genes are changed in specific conditions into functional profiles showing how various functional categories (e.g., cellular functions) are changed in the given conditions. Such profiles are constructed
320 |
Chapter 18 |
based on public data and Gene Ontology categories and terms. Furthermore, Onto-Express provides information about the statistical significance of each of the pathways and categories used in the profiles allowing the user to distinguish between cellular mechanisms significantly affected and those that could be involved by chance alone.
REFERENCES
Aach J., Rindone W., and Church G.M. Systematic management and analysis of yeast gene expression data (2000). Genome Research, 10:431-445.
Aharoni A., Keizer L.C.P., Bouwneester H.J., Sun Z., et al.(1975), Identification of the SAAT gene involved in strawberry flavor biogenesis by use of DNA microarrays. The Plant Cell, 12:647-661.
Alter O., Brown P., and Botstein D. (2000), Singular value decomposition for genome-wide expression data processing and modeling, Proc. Natl. Acad. Sci., 97(18):10101-10106.
Ashburner M., Ball C.A., Blake J.A., Botstein D. et al. (2001). Creating the gene ontology resource: Design and implementation. Genome Research, 11(8):1425-1433.
Ashburner M., Ball C.A., Blake J.A., Botstein D. et al. (2000). Gene ontology: tool for the unification of biology. Nature Genetics, 25:25-29.
Audic S. and Claverie J.-M. (1997). The significance of digital gene expression profiles. Genome Research, 10(7):986-995.
Audic S. and Claverie J.-M. (1998). Vizualizing the competitive recognition of TATA-boxes in vertebrate promoters. Trends in Genetics, 14:10-11.
Bairoch A. and Apweiler R. (2000). The SWISS-PROT protein sequence database and its supplement TrEMBL in 2000. Nucleic Acids Research, 28(l):45-48.
Bankier A. (2001). Shotgun DNA sequencing. Methods in Molecular Biololgy, 167:89-100. Bernal A., Ear U., and Kyrpides N. (2001). Genomes online database (GOLD): a monitor of
genome projects world-wide. Nucleic Acids Research, 29(1):126-127.
Biosciences B. (2002), PowerBlot Western Array Screening Service. Technical report, BD Biosciences. Available at http://www.bdbiosciences.com.
Bortoluzzi S., d’Alessi G., Romualdi C., and Daneli G. (2000). The human adult skeletal muscle transcriptional profile reconstructed by a novel computational approach. Genome Research, 10(3):344-349.
Brazma A. and Vilo J. (2000). Gene expression data analysis. Federation of European Biochemical Societies Letters, 480(23893):17-24.
Brazma A, (2001). On the importance of standardisation in life sciences. Bioinformatics, 17(2):113-114.
Brazma A., Hingamp P., Quackenbush J., Sherlock G. et al. (2001). Minimum information about a microarray experiment (MIAME) – toward standards for microarray data. Nature Genetics, 29(4):365-371.
Bubendorf L., Kononen J., Koivisto P., Schraml P. et al. (1999). Survey of gene amplifications during prostate cancer progression by high-throughout fluorescence in situ hybridization on tissue microarrays. Cancer Research, 59(4):803-806.
Bubendorf L., Kolmer M., Kononen J., Koivisto P, et al. (1999). Hormone therapy failure in human prostate cancer: analysis by complementary DNA and tissue microarrays. Journal of the National Cancer Institute, 91(20):1758-1764.
18. Global Functional Profiling of Gene Expression Data |
321 |
Casella G. (2002). Statistical inference. Duxbury.
Chen Y., Dougherty E.R., and Bittner M.L. (1997). Ratio-based decisions and the quantitative analysis of cDNA microarray images. Journal of Biomedical Optics, 2(4):364-374.
Cho R., Huang M., Campbell M., Dong H. et al. (2001), Transcriptional regulation and function during the human cell cycle. Nature Genetics, 27:48-54.
Claverie J.-M. (1999). Computational methods for the identification of differential and coordinated gene expression. Human Molecular Genetics, 8(10):1821-1832.
CNRS (2001). Microarray databases. Technical report, Centre National de la Recherche Scietifique. Available at http://www.biologie.ens.fr/en/genetiqu/puces/bddeng.html.
Dahlquist K., Salomonis N., Vranizan K., Lawlor S., and Conklin B. (2002). GenMAPP, a new tool for viewing and analyzing microarray data on biological pathways. Nature Genetics, 31(1):19-20.
DeRisi J.L., Iyer V.R., and Brown P.O. (1997). Exploring the metabolic and genetic control of gene expression on a genomic scale. Science, 278:680-686, 1997.
DeRisi J.L., Penland L., Brown P.O., Bittner M.L. et al. (1996). Use of a cDNA microarray to analyse gene expression patterns in human cancer. Nature Genetics, 14(4):457-460.
D’haeseleer P., Liang S., and Somogyi R. (2000). Genetic network inference: From coexpression clustering to reverse engineering. Bioinformatics, 16(8):707-726.
Draghici S. and Khatri P., (2002). Onto-Express web site. Technical report, Wayne State University. Available at http://vortex.cs.wayne.edu.
Draghici S. (2002). Statistical intelligence: effective analysis of high-density microarray data. Drug Discovery Today, 7(11):S55-S63.
Draghici S., Kuklin A., Hoff B., and Shams S. (2001). Experimental design, analysis of variance and slide quality assessment in gene expression arrays. Current Opinion in Drug Discovery and Development, 4(3):332-337.
Dudoit S., Yang Y.H., Callow M., and Speed T. (2000). Statistical models for identifying differentially expressed genes in replicated cDNA microarray experiments. Technical Report 578, University of California, Berkeley.
EBI (2001a). ArrayExpress. Technical report, European Bioinformatics Institute. Available at http://www.ebi.ac.uk/arrayexpress/index.html.
EBI (2001b). Microarray gene expression database group. Technical report, European Bioinformatics Institute. Available at http://www.mged.org/.
Eisen M., Spellman P., Brown P., and Botstein D., (1998). Cluster analysis and display of genome-wide expression patterns. In Proc. of the Nat. Acad. of Sci., 95:14863-14868.
Eisenberg D., Marcotte E.M., Xenarios I., and Yeates T.O. (2000). Protein function in the post-genomic era. Nature, 405:823-826.
Ewing R.M., Kahla A.B., Poirot O., Lopez F., Audic S., and Claverie J.-M. (1999). Largescale statistical analyses of rice ESTs reveal correlated patterns of gene expression. Genome Research, 9:950-959.
Fisher L.D. and van Belle G. (1993). Biostatistics: a methodology for health sciences. John Wiley and Sons, New York.
Fleischmann W., Moller S., Gateau A., and Apweiler R. (1999). A novel method for automatic functional annotation of proteins. Bioinformatics, 15(3):228-233.
Gavin A., Bosche M., Grandi K.R.P. et al. (2002). Functional organization of the yeast proteome by systematic analysis of protein complexes. Nature, 415(6868):141-147.
Glover T. and Mitchell K. (2002). An introduction to biostatistics. McGraw-Hill, New York.
322 Chapter 18
Golub T.R., Slonim D.K., Tamayo P., Huard C., Gaasenbeek M., Mesirov J.P., Coller H., Loh M.L., Downing J.R., Caligiuri M.A., Bloomfield C.D., and Lander E.S. (1999) Molecular classification of cancer: class discovery and class prediction by gene expression monitoring. Science, 286(5439):531-537.
Hastie T., Tibshirani R., Eisen M.B., Alizadeh A., Levy R., Staudt L., Chan W., Botstein D., and Brown P. (2000). “Gene shaving” as a method for indentifying distinct sets of genes with similar expression patterns. Genome Biology, 1(2):1-21.
Heyer L.J., Kruglyak S., and Yooseph S. (1999). Exploring expression data: Identification and analysis of coexpressed genes. Genome Research, 9:1106-1115.
Hill A.A., Hunter C.P., Tsung B.T., Tucker-Kellogg G., and Brown E.L. (2000). Genomic analysis of gene expression in C. elegans. Science, 290:809-812.
Hilsenbeck S., Friedrichs W., Schiff R., O’Connell P., Hansen R., Osborne C., and Fuqua S.W. (1999). Statistical analysis of array expression data as applied to the problem of Tamoxifen resistance. Journal of the National Cancer Institute, 91(5):453-459.
Hishiki T., Kawamoto S., Morishita S., and BodyMap O.K. (2000). A human and mouse gene expression database. Nucleic Acids Research, 28(1): 136-138.
Hwang D., Dempsy A., Lee C.-Y., and Liew C.-C. (2000). Identifcation of differentially expressed genes in cardiac hypertrophy by analysis of expressed sequence tags. Genomics, 66(1):1-14.
Ideker T., Galitski T., and Hood L. (2001). A new approach to decoding life: systems biology. Annual Review Of Genomics And Human Genetics, (2):343-372.
Janssen D. (2002). The information behind the informatics. Genomics and Proteomics. Available at http://www.genpromag.com/feats/0205gen23.asp.
Kanehisa M. and Goto S. (2000). KEGG: Kyoto encyclopedia of genes and genomes. Nucleic Acids Research, 28(1):27-30.
Kanehisa M., Goto, S., Kawashima S., and Nakaya A. (2002). The KEGG databases at GenomeNet. Nucleic Acids Research, 30(l):42-46.
Kennedy J.W., Kaiser G.W., Fisher L.D., Fritz J.K., Myers W., Mudd J., and Ryan T. (1981). Clinical and angiographic predictors of operative mortality from the collaborative study in coronary artery surgery (CASS). Circulation, 63(4):793-802.
Kerr M.K. and Churchill G.A. (200la). Experimental design for gene expression analysis. Biostatistics, (2): 183-201.
Available at http://www.jax.org/research/churchill/pubs/index.html.
Kerr M.K. and Churchill G.A. (2001b). Statistical design and the analysis of gene expression. Genetical Research, 77:123-128.
Available at http://www.jax.org/research/churchill/pubs/index.html.
Kerr M.K., Martin M., and Churchill G.A., (2000). Analysis of variance for gene expression microarray data. Journal of Computational Biology, 7:819-837.
Khatri P., Draghici S., Ostermeier C., and Krawetz S. (2002). Profiling gene expression utilizing Onto-Express. Genomics, 79(2):266-270.
Kononen J., Bubendorf L., Kallioniemi A., Barlund M. et al. (1998). Tissue microarrays for high-throughput molecular profiling of tumor specimens. Nature Medicine, 4(7):844-847.
Kretschmann E., Fleischmann W. (2001). Automatic rule generation for protein annotation with the C4.5 data mining algorithm applied on SWISS-PROT. Bioinformatics, 17(10):920-926.
Lander E., Linton L. et al. (2001). Initial sequences and analysis of the human genome. Nature, 409(6822):860-921.
18. Global Functional Profiling of Gene Expression Data |
323 |
Lash A.E., Tolstoshev C.M., Wagner L., Shuler G.D., Strausberg R.L., Riggins G.J., and Altschul S.F. (2000). SAGEmap: A public gene expression resource. Genome Research, 10:1051-1060.
Lee M.-L.T., Kuo F.C., Whitmore G.A., and Sklar J. (2000). Importance of replication in microarray gene expression studies: Statistical methods and evidence from repetitive cDNA hybridizations. Proc. Natl. Acad. Sci., 97(18):9834-9839.
Liebermeister W. (2001). Independent component analysis of gene expression data. In Proc. of German Conference on Bioinformatics GCB’01,
Available at http://www.bioinfo.de/isb/gcb01/poster/.
Lockhart D.J. and Winzeler E.A. (2000). Genomics, gene expression and DNA arrays. Nature, 405:827-836.
Lockhart D.J., Dong H., Byrne M., Folletie M., Gallo M.V., Chee M.S., Mittmann M., Want C., Kobayashi M., Horton H., and Brown E.L. (1996). DNA expression monitoring by hybridization of high density oligonucleotide arrays. Nature Biotechnology, 14:1675-1680.
Magrane M. and Apweiler R. (2002). Organisation and standardisation of information in SWISS-PROT and TrEMBL. Data Science Journal, 1(1):13-18.
Man M.Z., Wang Z., and Wang Y. (2000). POWER SAGE: comparing statistical tests for SAGE experiments. Bioinformatics, 16(11):953-959.
Mangalam H., Stewart J., Zhou J., Schlauch K., Waugh M., Chen G., Farmer A.D., Colello G., and Weller J.W. (2001). GeneX: An open source gene expression database and integrated tool set. IBM Systems Journal, 40(2):552-569.
Available at http://www.ncgr.org/genex/.
Moch H., Kononen T., Kallioniemi O., and Sauter G. (2001). Tissue microarrays: what will they bring to molecular and anatomic pathology? Advances in Anatomical Pathology,
8(1):14-20. |
|
Mousses S., Bubendorf L., Wagner U., |
Hostetter G., Kononen J., Cornelison R., Goldberger |
N., Elkahloun A., Willi N., Koivisto P., Ferhle W., Rafield M., Sauter G., and Kallioniemi |
|
O. (2002). Clinical validation of |
candidate genes associated with prostate cancer |
progression in the cwr22 model system using tissue microarrays. Cancer Research, 62(5): 1256-1260.
Newton M., Kendziorski C., Richmond C., Blattner F.R., and Tsui K. (2001). On differential variability of expression ratios: Improving statistical inference about gene expression changes from microarray data. Journal of Computational Biology, 8:37-52.
NHGRI (2001). ArrayDB. Technical report, National Human Genome Research Institute. Available at http://genome.nhgri.nih.gov/arraydb/schema.html.
Nocito A., Bubendorf L., Tinner E.M., Suess K. et al. (2001a). Microarrays of bladder cancer tissue are highly representative of proliferation index and histological grade. Pathology, 194(3):349-357.
Nocito A., Kononen J., Kallioniemi O., and Sauter G. (2001b). Tissue microarrays (tmas) for high-throughput molecular pathology research. International Journal of Cancer, 94(1):1-5.
Ogata H., Goto S., Sato K., Fujibuchi W., Bono H., and Kanehisa M. (1999). KEGG: Kyoto encyclopedia of genes and genomes. Nucleic Acids Research, 27(l):29-34.
Perou C. M., Sørlie T., Eisen M.B., van de Rijn M., Jeffrey S.S., Rees C.A., Pollack J.R., Ross D.T., Johnsen H., Akslen L.A., Fluge Ø., Pergamenschikov A., Williams C., Zhu S.X., Lønning P.E., Børresen-Dale A.-L., Brown P.O., and Botstein D. (2000). Molecular portraits of human breast tumours. Nature, 406:747-752.