

Berrar D. et al. - Practical Approach to Microarray Data Analysis
.pdf254 |
Chapter 14 |

14. Clustering or Automatic Class Discovery: Hierarchical Methods |
255 |
4.2Lymphoma Data
We analyzed a lymphoma data set from (Alizadeh et al., 2000) to illustrate the results of adaptive single linkage clustering on real microarray data. This data set consists of 4,026 genes across 96 tissue samples, and we used a correlation metric with pairwise exclusion of missing observations. We
256 Chapter 14
performed clustering first on the genes and then on the tissues; we also show an example using an imputation method for the missing values.
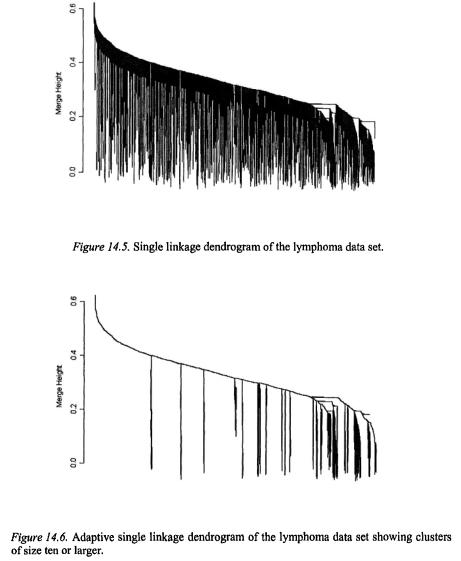
A full single linkage dendrogram for the gene clustering is shown in Figure 14.5. It is difficult to make out structure in this plot because of the large size of the data set; other clustering methods lead to similarly dense dendrograms. Adaptive single linkage clustering allows us to focus only on the points in locally high-density regions of the data. Clusters with runt statistics of size 10 or larger are shown in Figure 14.6; this application of adaptive single linkage clustering screens out 87% of the data points and leaves 26 clusters for further consideration.
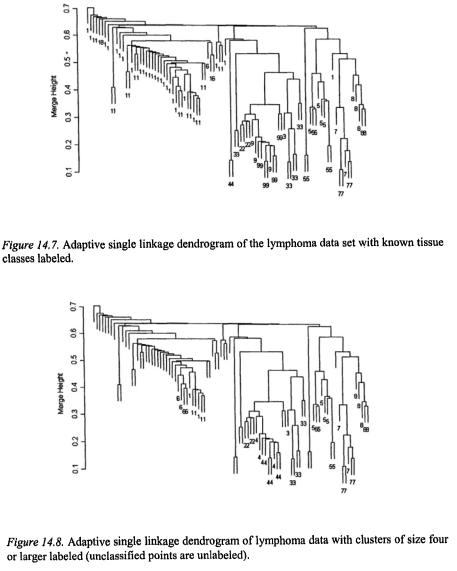
We clustered the tissue samples using adaptive single linkage clustering and compared our results to the known tissue classes. The known tissue classes are shown by numbered labels on the single linkage dendrogram in Figure 14.7. These can be compared to the same dendrogram in Figure 14.8, which shows the clustering obtained with a runt threshold of 4. Adaptive single linkage clustering automatically finds clusters corresponding to all of the known tissue types except for the two-point clusters (labeled as 4 and 6 on Figure 14.7). It also suggests that there may be evidence of two subgroups within class 1 of Figure 14.7.
Figure 14.9 displays the known tissue classes on a single linkage dendrogram computed following imputation for all 19,667 missing values in the data. The imputation process was based on a Gaussian model (Schafer, 1997), using software provided in S-PLUS (Schimert et al., 2001). Markov chain Monte Carlo was used to compute Bayesian estimates of the unknown random variables, including the imputed missing values. See Chapter 3 for alternative imputation methods. Figure 14.9 is extremely similar to the result in Figure 14.7. Note that the ordering of the data on the x-axis is arbitrary; the ordering is chosen for simplicity of display. Switching the two children of a node from right to left has no impact on the structure of the dendrogram. For example, a large part of group 1 is displayed on the left side in Figure 14.7, while it is on the right side in Figure 14.9. This results from one dendrogram node for which the two sub-trees have been flipped; there are several other such switches apparent between these two figures. In the actual clustering result, there are only a few small changes, such as the two points in group 6, which appear to blend into group 1 more in Figure 14.9, We must keep in mind that our missing data methods, whether implicit in the metric or explicit via imputation, can have an impact on our analysis results when there are many missing values.
14. Clustering or Automatic Class Discovery: Hierarchical Methods |
257 |
258 |
Chapter 14 |

14. Clustering or Automatic Class Discovery: Hierarchical Methods |
259 |
5.DISCUSSION AND SOFTWARE
Hierarchical clustering is an effective exploratory tool for the analysis of microarray data sets or other high throughput screening data; the resulting dendrogram simultaneously presents 1 to N clusters, yielding insight into relationships not otherwise easily found in multidimensional data. Modelbased methods offer good cluster detection and a statistical model which can help in determining the number of clusters, but they require modeling assumptions which can be severe. Nonparametric methods avoid modeling assumptions and adapt to any cluster shape, which allows their use when density assumptions are not appropriate or not verifiable. Only a few methods, such as adaptive single linkage, can be scaled to handle the large data sizes which are becoming common in microarray data sets.
There are many software packages, both commercial and free, that perform hierarchical clustering. The most widely used statistical packages, such as S-PLUS, SAS, and SPSS, provide general hierarchical clustering tools that can be used to display and manipulate dendrograms. The adaptive single linkage clustering software used here is new; a preliminary version, suitable for use in S-PLUS, can be obtained by contacting the authors. See Chapter 19 for a survey of microarray analysis tools.
REFERENCES
Alizadeh A.A., Eisen M.B., Davis R.E., Ma C., Lossos I.S., Rosenwald A., Boldrick J.C., Sabet H., Tran T., Yu X., Powell J.I., Yang L., Marti G.E., Moore T., Hudson J., Lu L., Lewis D.B., Tibshirani R., Sherlock G., Chan W.C., Greiner T.C., Weisenberger D.B.,
260 |
Chapter 14 |
Armitage J.O., Warnke R., Levy R., Wilson W., Grever M.R., Byrd J.C., Botstein D., Brown P.O., Staudt L.M. (2000). Distinct types of diffuse large B-cell lymphoma identified by gene expression profiling. Nature 403:503-11.
Arnold S.F. (1990). Mathematical Statistics. Englewood Cliffs: Prentice-Hall.
Banfield J.D., Raftery A.E. (1993). Model-Based Gaussian and Non-Gaussian Clustering. Biometrics 49:803-21.
Erb R.S., Michael G.S. (1998). Cluster Analysis of Large Scale Gene Expression Data. Computing Science and Statistics 30:303-8.
Glenny R.W., Polissar N.L., McKinney S., Robertson H.T. (1995). Temporal heterogeneity of regional pulmonary perfusion is spatially clustered. J Appl Physiol 79(3):986-1001.
Golub T.R., Slonim D.K., Tamayo P., Huard C., Gaasenbeek M., Mesirov J.P., Coller H., Loh M.L., Downing J.R., Caligiuri M.A., Bloomfield C.D., Lander E.S. (1999). Molecular Classification of Cancer: Class Discovery and Class Prediction by Gene Expression Monitoring. Science 286:531-7.
Gordon A.D. (1999). Classification, 2nd Ed. New York: Chapman & Hall.
Gower J.C., Ross G.J.S. (1969). Minimum Spanning Trees and Single Linkage Cluster Analysis. Applied Statistics 18(1):54-64.
Hartigan J.A., Mohanty S. (1992). The Runt Test for Multimodality. Journal of Classification 9:63-70.
McKinney S. (1995). Autopaint: A Toolkit for Visualizing Data in Four or More Dimensions.
PhD Thesis, University of Washington Biostatistics Department.
Prim R. (1957). Shortest Connection Networks and Some Generalizations. Bell Systems Technical Journal 1389-1401.
Ramaswamy S., Tamayo P., Rifkin R., Mukherjee S., Yeang C.H., Angelo M., Ladd C., Reich M., Latulippe E., Mesirov J.P., Poggio T., Gerald W., Loda M., Lander E.S., Golub T.R. (2001). Multiclass cancer diagnosis using tumor gene expression signatures. Proc. Nat. Acad. Sc. USA 98(26):15149-54.
Sokal R.R., Michener C.D. (1958). A Statistical Method for Evaluating Systematic Relationships. University of Kansas Science Bulletin 38:1409-38.
Schafer J.L. (1997). Analysis of Incomplete Multivariate Data, London:Chapman & Hall,
Schimert J., Schafer J.L., Hesterberg T., Fraley C., Clarkson D.B. (2001), Analyzing Data with Missing Values in S-PLUS, Seattle:Insightful.
Sokal R.R., Sneath P.H.A. (1963). Principles of Numerical Taxonomy, San
Francisco:Freeman.
Stanford D.C. (1999). Fast Automatic Unsupervised Image Segmentation and Curve Detection in Spatial Point Patterns. PhD Thesis, University of Washington Statistics Department.
Ward J. (1963). Hierarchical groupings to optimize an objective function. Journal of the American Statistical Association 58:234-44.
Welcsh P.L., Lee M.K., Gonzalez-Hernandez R.M., Black D.J., Mahadevappa M., Swisher E.M., Warrington J.A., King M.C. (2002). BRCA1 transcriptionally regulates genes involved in breast tumorigenesis. Proc. Nat. Acad. Sc. USA 99(11):7560-5.
Zahn C.T. (1971), Graph-Theoretical Methods for Detecting and Describing Gestalt Structures. IEEE Transactions on Computers C-20:68-86.
Chapter 15
DISCOVERING GENOMIC EXPRESSION PATTERNS WITH SELF-ORGANIZING NEURAL NETWORKS
Francisco Azuaje
University of Dublin, Trinity College, Department of Computer Science, Dublin 2, Ireland, e-mail: Francisco.Azuaje@cs.tcd.ie
1.INTRODUCTION
Self-organizing neural networks represent a family of useful clusteringbased classification methods in several application domains. One such technique is the Kohonen Self-Organizing Feature Map (SOM) (Kohonen, 2001), which has become one of the most successful approaches to analysing genomic expression data. This model is relatively easy to implement and evaluate, computationally inexpensive and scalable. In addition, it exhibits significant advantages in comparison to other options. For instance, unlike hierarchical clustering it facilitates an automatic detection and inspection of clusters. Unlike Bayesian-based clustering it does not require prior hypotheses or knowledge about the data under consideration. Compared to the k-means clustering algorithm, the SOM exemplifies a robust and structured classification process.
Self-organizing neural networks are based on the principle of transforming a set of p-variate observations into a spatial representation of smaller dimensionality, which may allow a more effective visualization of correlations in the original data. Murtagh and Hernández-Pajares (1995), among many others, have discussed the connections between SOMs and alternative data analysis techniques. Before its introduction to the area of functional genomics, SOMs had been extensively applied in different biomedical decision support tasks, including coronary heart risk assessment (Azuaje et al., 1998), electrocardiogram-based diagnostic studies
262 Chapter 15
(Papadimitriou et al., 2001) and tissue characterization in cancer studies (Schmitz et al., 1999).
Scientists may use SOMs to detect clusters of similar expression patterns. The SOM-based model was one of the first machine learning techniques implemented for the molecular classification of cancer. Golub and colleagues (1999) reported a model to discover the distinction between acute myeloid leukemia and acute lymphoblastic leukemia. The application of SOMs was part of a systematic expression monitoring method based on DNA microarrays. They were able to illustrate not only a classification process to distinguish known categories of leukemia samples, but also a class discovery process to identify unknown relevant subtypes. The authors suggested that it would be possible to achieve a sub-classification of higher resolution with a larger sample collection. Moreover, this classification technique may provide the basis for the prediction of clinical outcomes, such as drug response or survival. This research is a good example of how a SOM-based classifier together with other statistical tools may support a complex knowledge discovery function.
Another relevant study consisted of the application of SOMs to organize thousands of genes into biologically relevant clusters using hematopoietic differentiation data (Tamayo et al., 1999). This classification system indicated, for example, genes involved in differentiation therapy used in the treatment of leukemia. It discussed some of the key attributes that make the SOM an adequate clustering technique for expression data. It shows how SOMs can primarily be used to perform exploratory data analysis and facilitate visualisation-based interpretations. The authors developed Genecluster, which is a computer package to perform SOM-based classification of genomic expression data. It has assisted, for instance, the generation of interpretations relating to the yeast cell cycle, macrophage differentiation in HL-60 cells and hematopoietic differentiation across different cell lines (Tamayo et al., 1999).
Ideker and colleagues (2001) also used SOMs in an integrated approach to refining a cellular pathway model. Based on this method they identified a number of mRNAs responding to key perturbations of the yeast galactoseutilization pathway.
The remainder of this chapter addresses two important questions on selforganizing neural networks applications for expression data: a) How do these systems work? and b) How can we use them to support genomic expression research? It focuses on the application of SOMs in different expression data analysis problems. Advantages and limitations will be discussed. Moreover, an alternative solution based on the principle of adaptive self-organization will be introduced. This chapter will end with an overview of current challenges and opportunities.
15. Discovering Genomic Expression Patterns With Self-Organizing |
263 |
Neural Networks |
|
2.SOMS AND MICROARRAY DATA ANALYSIS
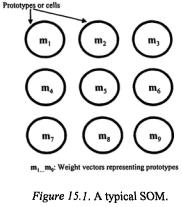
The SOM is based on hypothetical neural structures called feature maps, which are configured and adapted by the effect of sensory signals or data observations (Kohonen, 2001). Their processing components, known as neurones, prototypes or cells, are spatially correlated after completing a learning or training process, such that those prototypes at nearby points on the resulting structure are more similar than those widely separated. Each prototype is associated with a weight vector  Thus, SOMs can be used to perform clustering functions (Murtagh and Hernández-Pajares, 1995). Figure 15.1 shows a typical SOM.
2.1The SOM Clustering Algorithm
The SOM learning algorithm transforms any p-dimensional space into an ordered two-dimensional coordinate system. Also one may say that the SOM algorithm implements a “nonlinear projection” of the probability density function, p(x), of the input data vector x onto a two-dimensional space (Kohonen, 2001).
Given a number of samples, N, each one represented by a number of features, p, a Kohonen map (Kohonen, 2001) consists of a grid of k prototypes,  (vector defined by p elements) (Figure 15.1). The main goal is then to define associations between each sample or observation and the prototypes represented on the map. The number of prototypes, k, and other learning parameters need to be defined by the user. Before starting the learning process the prototypes
  are randomly initialized. Each of the k prototypes,
  may also be encoded with respect to an integer coordinate pair
  Where
Where  and
and  Figure 15.2 illustrates a SOM consisting of 9 prototypes, which are used to