Cardiac Muscle Mechanics |
1 |
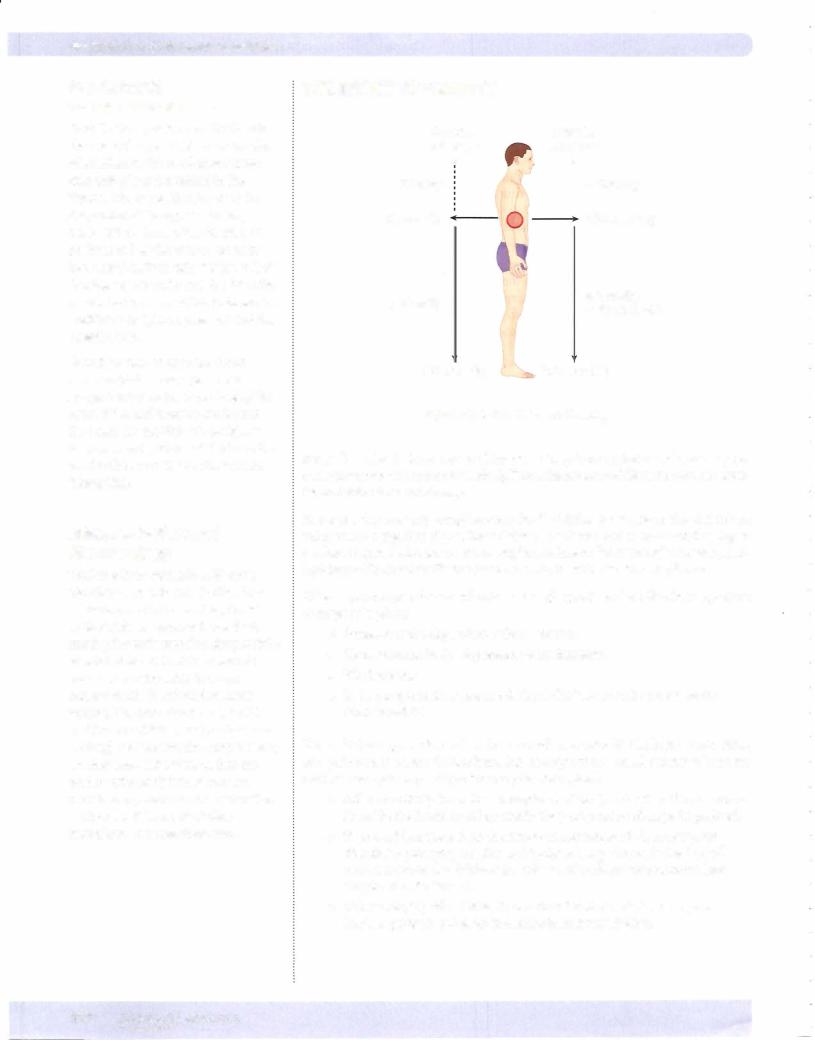
SYSTOLIC PERFORMANCE OF THE VENTRICLE
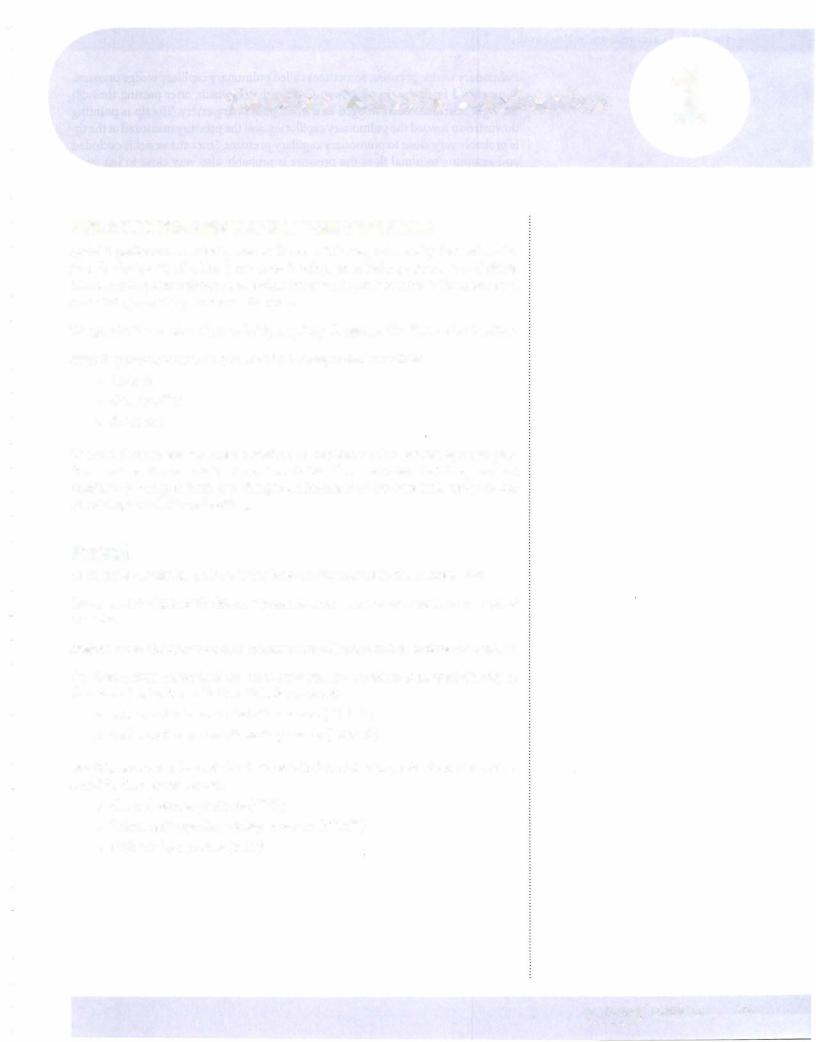
Systolic performance actuallymeansthe overall force generatedbythe ventricular muscle during systole. The heart does 2 things in systole: pressurizes and ejects blood. An important factor influencingthis systolic performance is the number of cross-bridges cycling during contraction.
The greater the numberofcross-bridges cycling, the greaterthe force ofcontraction.
Systolic performance is determined by 3 independent variables:
•Preload
•Contractility
•Afterload
These 3 factors are summed together to determine the overall systolic per formance of the ventricle. Recent work has demonstrated that they are not completely independent, but the generalizations made here will apply to the physiologic and clinical setting.
Preload
As in skeletal muscle,preload is the load on the muscle in the relaxed state.
More specifically, it is the load or prestretch on ventricular muscle at the end of diastole.
Preload on ventricularmuscle is not measured directly; rather, indices are utilized.
The best indices of preload on ventricular muscle are those measured directly in the ventricles. Indices of left ventricular preload:
•Left ventricular end-diastolic volume (LVEDV)
•Left ventricular end-diastolic pressure (LVEDP)
Possibly somewhat less reliable indices ofleft ventricular preload arethose mea sured in the venous system.
•Central venous pressure (CVP)
•Pulmonary capillary wedge pressure (PCWP)
•Right atrial pressure (RAP)
MEDICAL 73

Section IV • Cardiac Muscle Mechanics
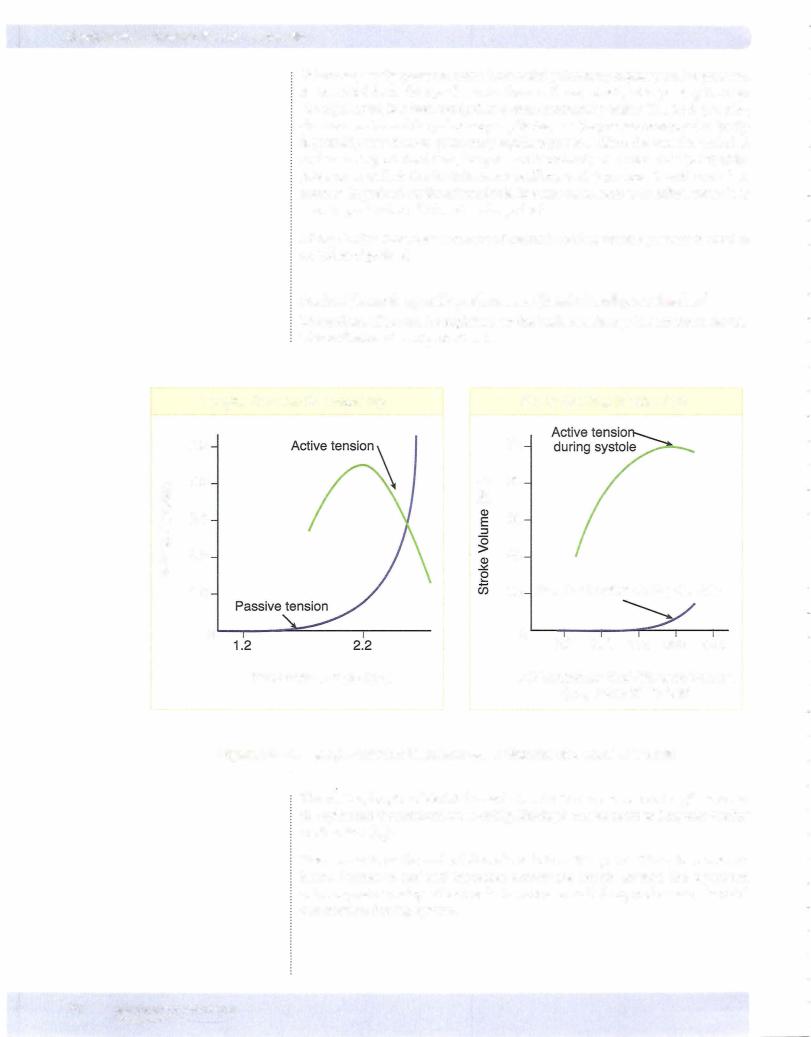
The overall changes induced by increased contractility canbe summarized as follows:
1.Increased dp!dt increased slope, thus increased rate ofpressure development
2.Increased peak left ventricular pressure due to a more forceful contraction
3.Increased rate of relaxation due to increased rate of calcium sequestration
4.Decreased systolic interval due to effects #1 and #3
Both an increased preload and an increased contractility are accompanied by an increased peak left ventricular pressure, but onlywith an increase in contractility is there a decrease in the systolic interval.
Whereas contractility affects systolic interval, heart rate determines diastolic inter val.Thus, increased sympathetic activity to the heart produces the following:
•Systolic interval decreased: contractility effect
•Diastolic interval decreased: heart rate effect
A high heart rate (pacemaker-induced) produces a small increase in contractility (Bowditch effect). Because Ca2+ enters the cell more rapidly than it is seques tered by the sarcoplasmic reticulum, intracellular Ca2+ increases. The increased contractility helps compensate for the reduced filling time associated with high heart rates.
Afterload
Afterload is defined as the "load" that the heart must eject blood against. Exactly what constitutes afterload to the heart is the subject ofmuch debate. Probably, the best "marker" of afterload is systemic vascular resistance (SVR), also called total peripheral resistance (TPR). However, TPR is not routinely calculated clinically and thus arterial pressure (diastolic, mean, or systolic) is often used as the index of afterload.
Afterload is increased in 3 main situations:
1.When aortic pressure is increased (elevated mean arterial pressure); for example, when hypertension increases the afterload, the left ventricle has to work harder to overcome the elevated arterial pressures.
2.When systemic vascular resistance is increased, resulting in increased resistance and decreased compliance
3.In aortic stenosis, resulting in pressure overload of the left ventricle
.In general, when afterload increases, there is:
•Decreased stroke volume
•Increased end-systolic volume
76 MEDICAL
Section IV • Cardiac Muscle Mechanics
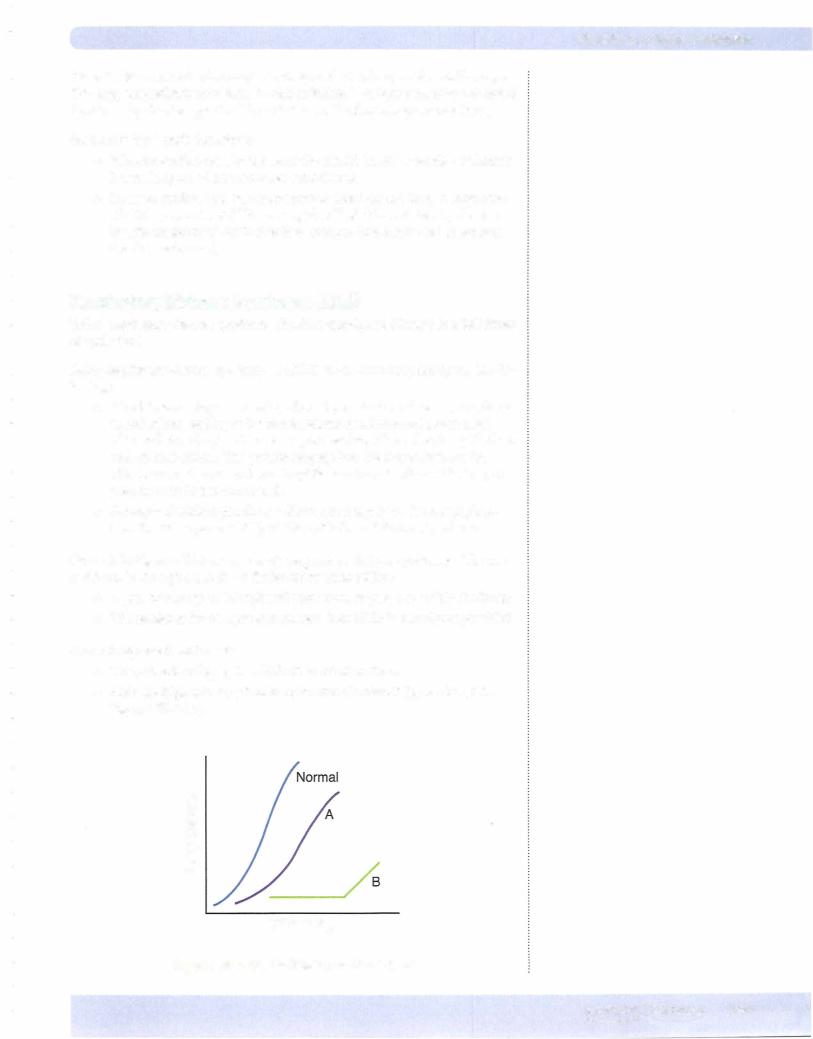
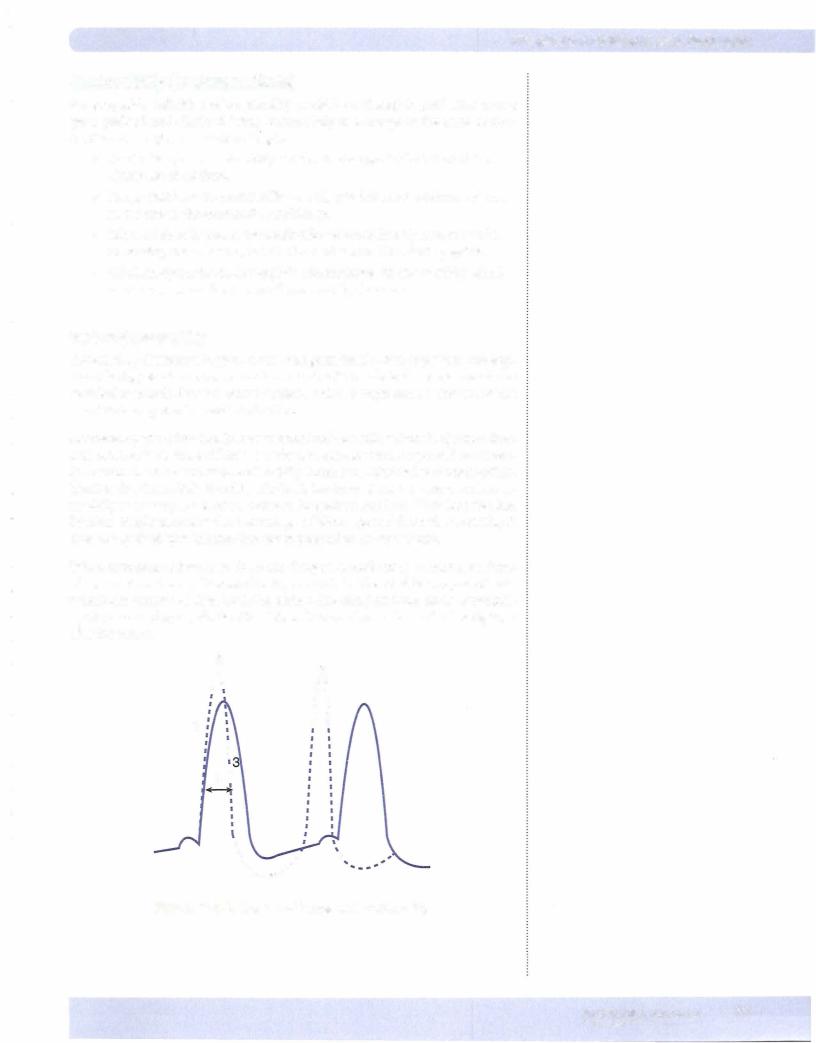
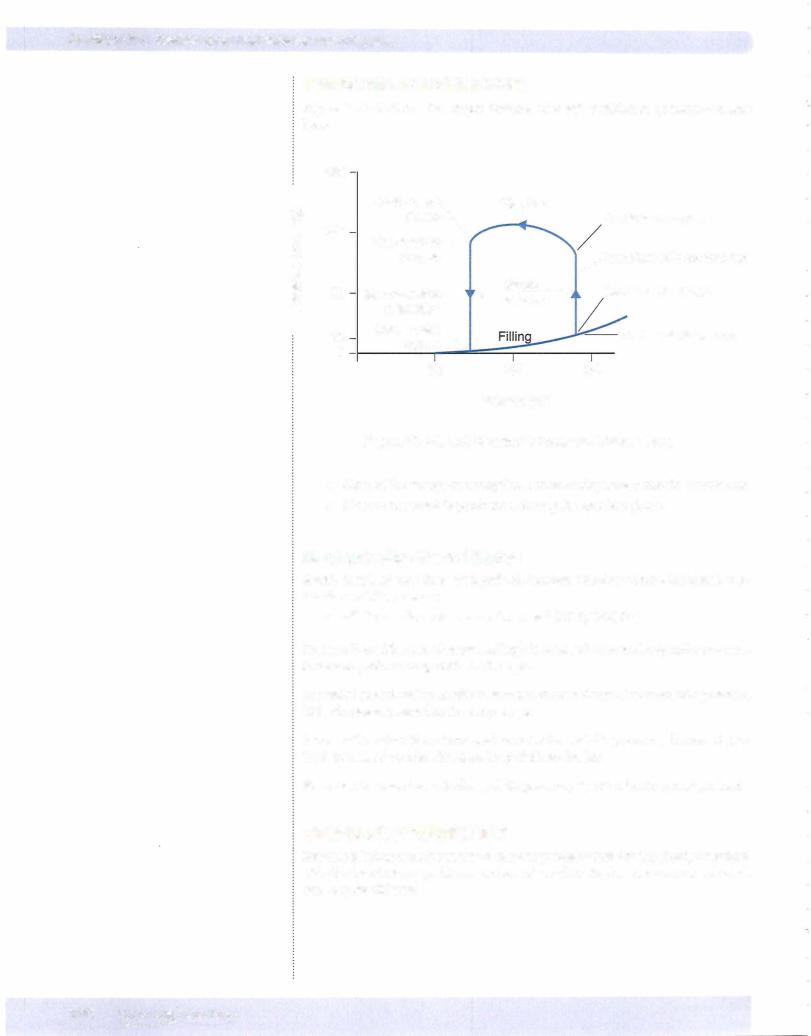
A ventricular function curve is the rise in ventricular performance as preload increases (Frank-Starling curve). Thus:
•Allpoints on a ventricular function curve have the same contractility.
•Allcurves have an ascending limb, a peak point, and possibly a descend ing limb.
•The pericardium normallyprevents the large increases in preload neces sary to reach the peak of a cardiac function curve.
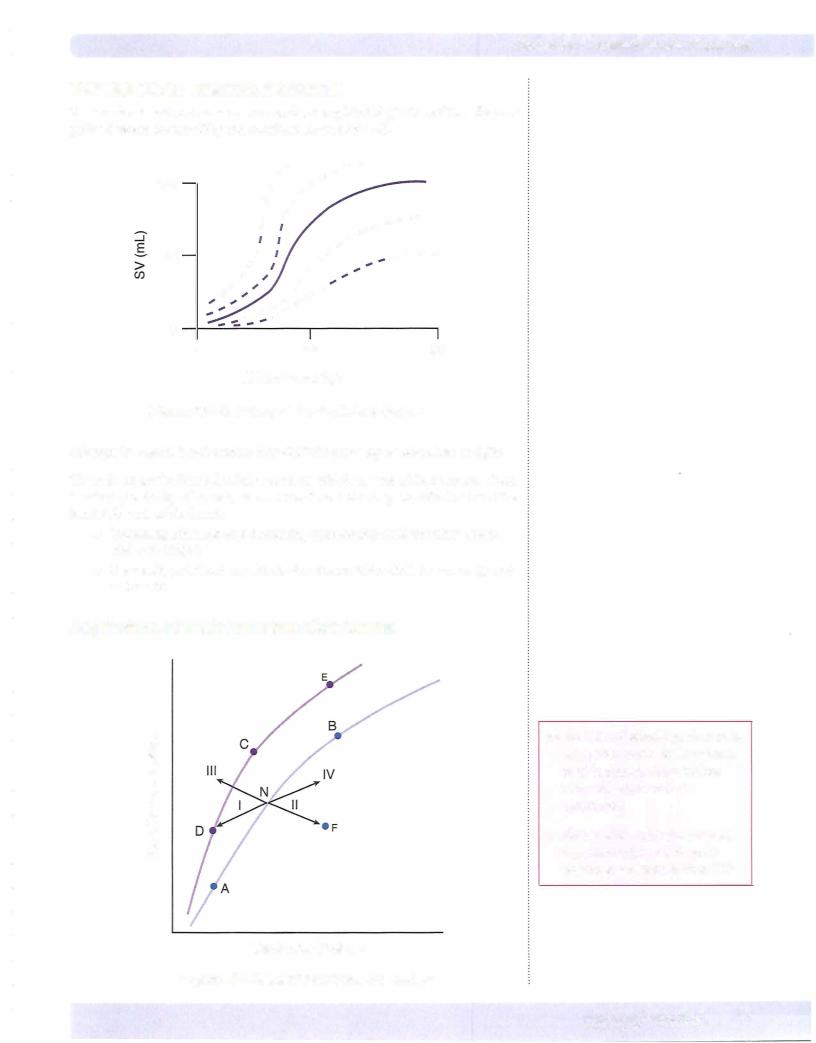
Starting at N, which represents a normal, resting individual:
•A = decreased performance due to a reduction in preload
•B = increased performance due to an increased preload
Starting at N, point C represents an increased performance due to an increase in contractility or a reduction in afterload.
•Anypoint above aventricular function curve means increased contractility, or an acute decrease in afterload.
•Any point below a ventricular function curve means decreased contrac tility, or an acute increase in afterload..
Points C, D, and E represent different levels of performance due to changes in preload only (Frank-Starling mechanism); all 3 points have the same contractility.
Vector I: consequences ofa loss in preload, e.g., hemorrhage, venodilators (nitro glycerin)
•Performance decreases because of a loss in preload.
•The loss ofvenous return and preload reduces cardiac output and blood pressure, and via the carotid sinus, reflex sympathetic stimulation to the heart increases.
•The increased contractility partially compensates for the loss of preload.
•When there is a loss of either preload or contractility that compromises performance, the other factor usually increases to return performance toward normal. However, the compensatory mechanism is usually incomplete.
Vector II: consequences of a loss in contractility, e.g., congestive heart failure
•Performance decreases because of a loss in contractility.
•Adecreasein contractilitydecreases ejection fraction,whichincreasespreload.
•The increased preload partially compensates for the loss of contractility.
•An acute decrease in afterload, e.g., peripheral vasodilation, produces the same change.
Vector III: consequences of an acute increase in contractility
•Performance increases.
•The increased contractility increases ejection fraction.
•The increased ejection fraction decreases preload.
•An acute decrease is afterload, e.g., peripheral vasodilation, produces the same shift in the curve.
Vector IV: consequences of an acute increase in preload, e.g., volume loading in the individual going from the upright to the supine position.
•Increased venous return increases preload, which increases performance and cardiac output.
78 MEDICAL
Chapter s • Cardiac Muscle Mechanics
•Increasing cardiac output raises blood pressure, and via the carotid sinus reflex, sympathetic stimulation to the heart decreases.
•The decreased sympathetic stimulation reduces contractility.
Allof the preceding sequences assume no dramatic change in heart rate, which could reduce or eliminate some of the expected changes. Whenever there is a change in sympathetic stimulation to the heart, there is a change in both contrac tility and heart rate.
VentricularVolumes
End-diastolic volume (EDV): volume ofblood in the ventricle at the end of diastole
End-systolic volume (ESV): volume ofblood in the ventricle at the end of systole
Stroke volume (SV): volume ofblood ejected by the ventricle per beat
SV = EDV - ESV
Ejection Fraction (EF): EF = SV/EDV (should be greater than 55% in a normal heart)
CHRONIC CHANGES: SYSTOLIC AND DIASTOLIC DYSFUNCTION
Systolic dysfunction can be defined as an abnormal reduction in ventricular emptying due to impaired contractility or excessive aft:erload.
Diastolic dysfunction is a decrease in ventricular compliance during the filling phase ofthe cardiac cycle due to either changes in tissue stiffness or impaired ven tricular relaxation. The consequence is a diminished Frank-Starling mechanism.
Pressure Overload
•Examples of a pressure overload on the left ventricle include hyperten sion and aortic stenosis.
•Initially, there is no decrease in cardiac output or an increase in preload since the cardiac function curve shifts to the left (increased performance due to increased contractility).
•Chronically, in an attempt to normalize wall tension (actually internal wall stress), the ventricle develops a concentric hypertrophy. There is a dramatic increase in wall thickness and a decrease in chamber diameter.
•The consequence of concentric hypertrophy (new sarcomes laid down in parallel, i.e., the myofibril thickens) is a decrease in ventricular com pliance and diastolic dysfunction, followed eventually by a systolic dys function and ventricular failure.
MEDICAL 79
Section IV • cardiac Muscle Mechanics
Volume Overload
•Examples of a volume overload on the left ventricle include mitral and aortic insufficiency and patent ductus arteriosus.
•Fairly well tolerated ifdeveloped slowly. A large acute volume overload less well tolerated and can precipitate heart failure.
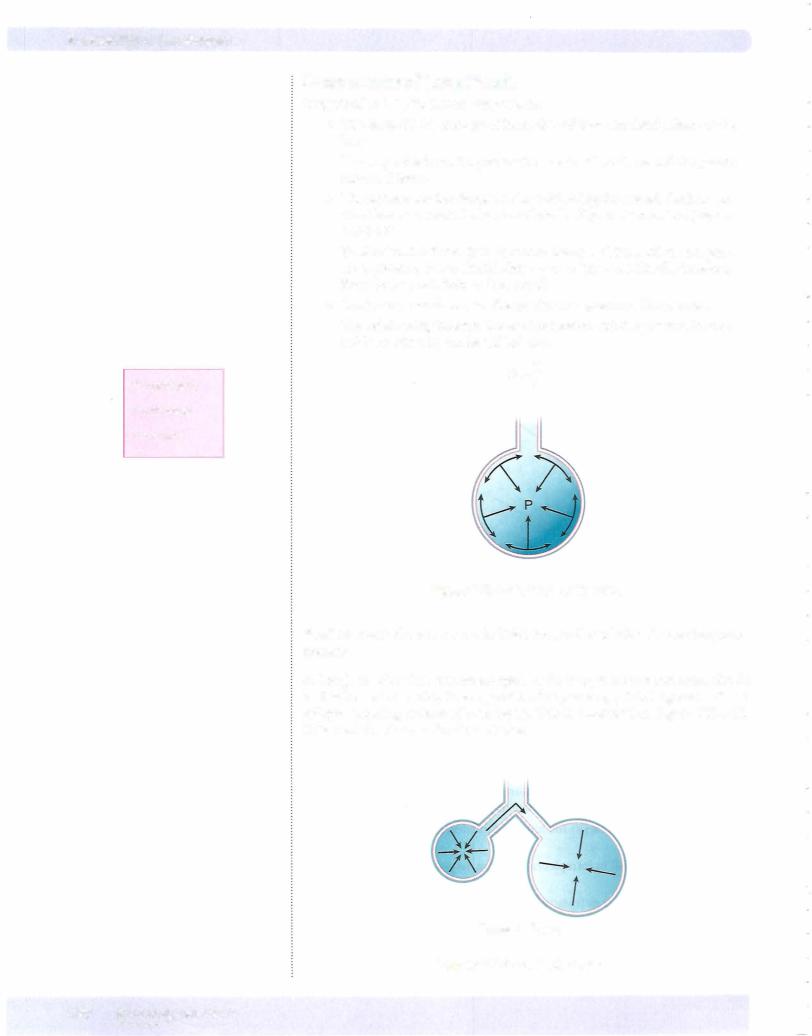
•Due to the LaPlace relationship, a dilated left ventricle must develop a greater wall tension to produce the same ventricular pressures.
rP=T/r
The greater the radius, the greater the wall tension needed to generate the same ventricular pressure.
Figure IV-1-5
•Chronically, in an attempt to normalize wall tension (actually internal wall stress), the ventricle develops an eccentric hypertrophy (new sar comeres laid down end-to-end, i.e., the myofibril lengthens) . As cardiac volumes increase, there is a modest increase in wall thickness that does not reduce chamber size.
•Compliance of the ventricle is not compromised and diastolic function is maintained.
•Eventual failure is usually a consequence of systolic dysfunction.
Cardiomyopathy
•Cardiac failure or more specifically congestive failure is a syndrome with many etiologies.
•Cardiomyopathy is a failure of the myocardium where the underlying cause originates within the myocyte.
•Excluded would be valvular heart disease, afterload problems, and coro nary heart disease.
•There are 3 basic types of cardiomyopathy:
Dilated cardiomyopathy
Restrictive cardiomyopathy
Hypertrophic cardiomyopathy
Dilated cardiomyopathy
•Ventricular dilation with only a modest hypertrophy that is less than appropriate for the degree of dilation
•It can occur for the left heart, right heart, or can include both.
•Diastolic function remains intact and helps compensate for the chamber dilation.
•Compensation also includes increased sympathetic stimulation to the myocardium.
80 MEDICAL
Chapter 1 • cardiac Muscle Mechanics
•Systolic dysfunction despite compensations via Frank-Starling and increased contractility
•Further dilation over time and mitral and tricuspid failure enhance sys tolic dysfunction with eventual complete failure.
Restrictive canliomyopathy
•Decreased ventricular compliance with diastolic dysfunction and a decrease in ventricular cavity size
•Increased fillingpressures lead to leftand right-sided congestion.
•Ventricular hypertrophy may or may not be present.
•Systolic maintained close to normal
Hypertrophic cardiomyop athy
•Septal or left ventricular hypertrophy is unrelated to a pressure overload.
•Diastolic dysfunction due to increased muscle stiffness and impaired relaxation
•Is a subtype ofhypertrophic cardiomyopathy, often resulting in a restriction ofthe ventricular outflow tract (idiopathic hypertrophic sub aortic stenosis) and pulmonary congestion. Currently this is referred to clinically as hypertrophic obstructive cardiomyopathy (HOCM).
•Hypertrophy may be related to septal fiber disarray.
':'1EDICAL |
81 |
Section IV • cardiac Muscle Mechanics
Chapter Summary
•Ventricular performance is determined by the amount of preload, the level of contractility, and afterload.
•Acutely, the preload effect determines sarcomere length, and the contractility effect by the availability of calcium.
•The best indices ofpreload are ventricular end-diastolic volume and pressure, and indices ofcontractility include the rate of pressure development during isovolumetric contraction, systolic interval, and ejection fraction. The ejection fraction (SV/EDV) in normal individuals should usually be greaterthan 55%.
•Both preload and contractility alterthe force ofventricular contraction, but only contractility has a significant effect on systolic interval (decreasing it).
•A loss of preload or contractility produces an increase in the otherfactor, which functions to minimize the loss in ventricular performance.
•Afterload on the ventricle represents the overall force the ventricular muscle must develop to pump the blood out ofthe ventricle. A close approximation for the left ventricle is the resistance ofthe arterioles (TPR).
•Systolic dysfunction is an abnormal reduction in ventricular emptying due to impaired contractility or excessive afterload.
•Diastolic dysfunction is a decrease in muscle compliance and a diminished Frank-Starling mechanism.
•A pressure overloaded ventricle causes a concentric hypertrophy, diastolic dysfunction, and eventually a systolic dysfunction.
•A volume overloaded ventricle causes an eccentric hypertrophy. Diastolic function is usually maintained with failure, which is the result of a systolic dysfunction.
•Cardiomyopathy is a failure ofthe myocardium where the underlying cause originates within the myocyte.
82 MEDICAL

SECTION
Peripheral
Circulation

Section V • Peripheral Circulation
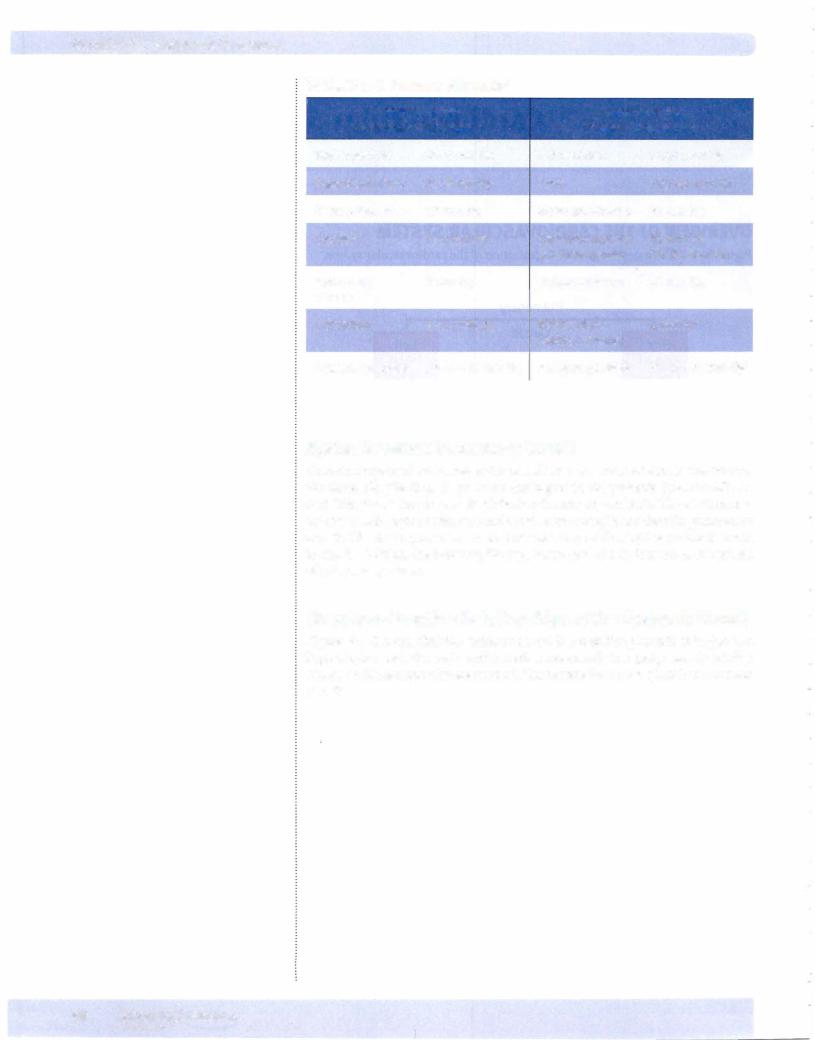
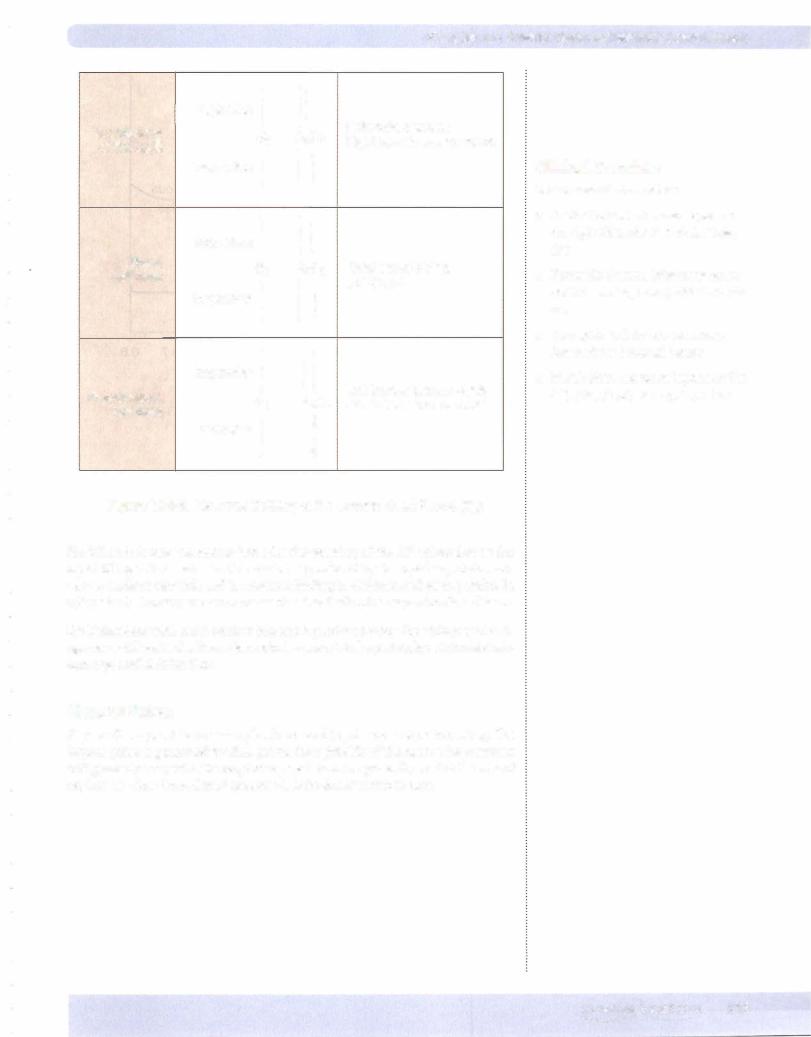
Table V-1-1. Pressure Differential
Pressures in the |
Pressures in the |
||
Pulmonary Circulation |
Systemic Circulation |
||
Right ventricle |
25/0 mm Hg |
Leftventricle |
120/0 mm Hg |
Pulmonary artery |
25/8 mm Hg |
Aorta |
120/80 mm Hg |
Mean pulm. art. |
1 5 mm Hg |
Mean art. blood p |
93 mm Hg |
Capillary |
7-9 mm Hg |
Capillary: skeletal |
30 mm Hg |
|
|
renal glomerular |
45-50 mm Hg |
Pulmonary |
5 mm Hg |
Peripheral veins |
15 mm Hg |
venous |
|
|
|
Left atrium |
5-10 mm Hg |
Right atrium |
O mm Hg |
|
|
(central venous) |
|
Pressure gradient |
1 5-5 = 10 mm Hg |
Pressure gradient |
93-0 = 93 mm Hg |
|
|
|
|
Systemicversus Pulmonary Circuit
Cardiac output andheart rate ofthe two circuits are equal, so stroke volumes are the same. Despite this, all pressures are higher in the systemic (peripheral) cir cuit. This shows that the vessels ofthe circuits are very different. The systemic cir cuit has much higher resistance and much lower compliance than the pulmonary circuit. The lower pressures mean that the work of the right ventricle is much lower. In addition, the lower capillary pressure protects against the development ofpulmonary edema.
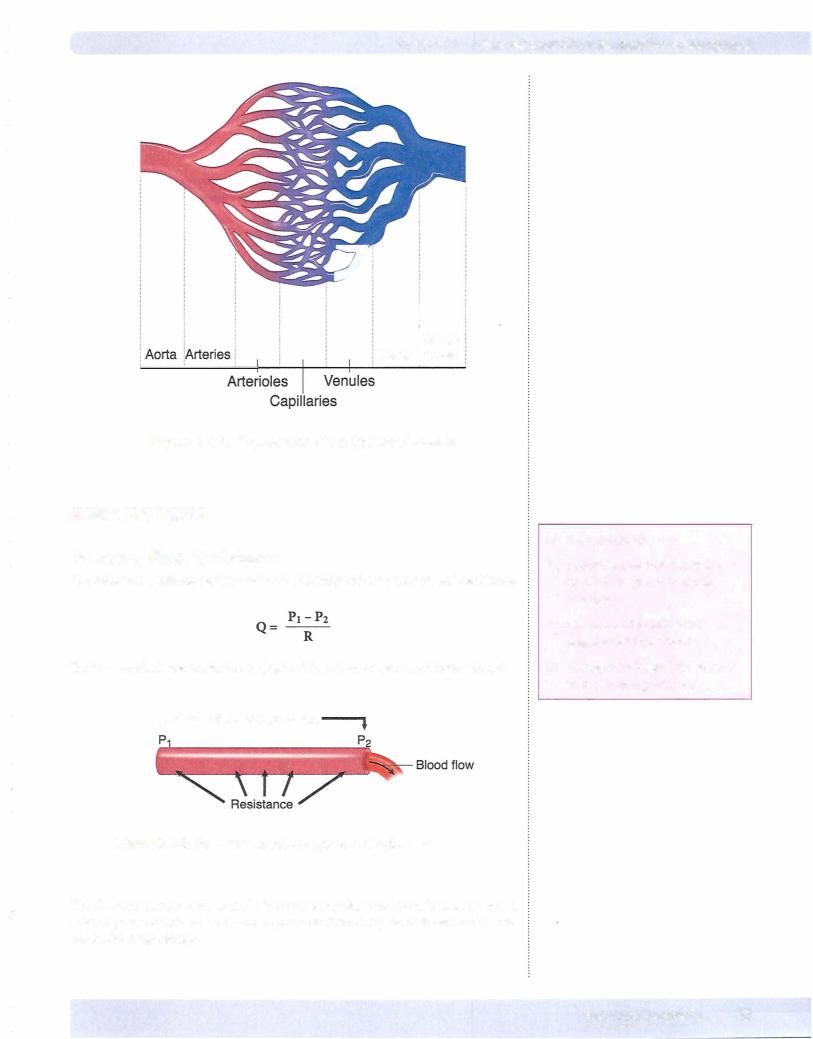
Structure-Function Relationships ofthe Systemic Circuit
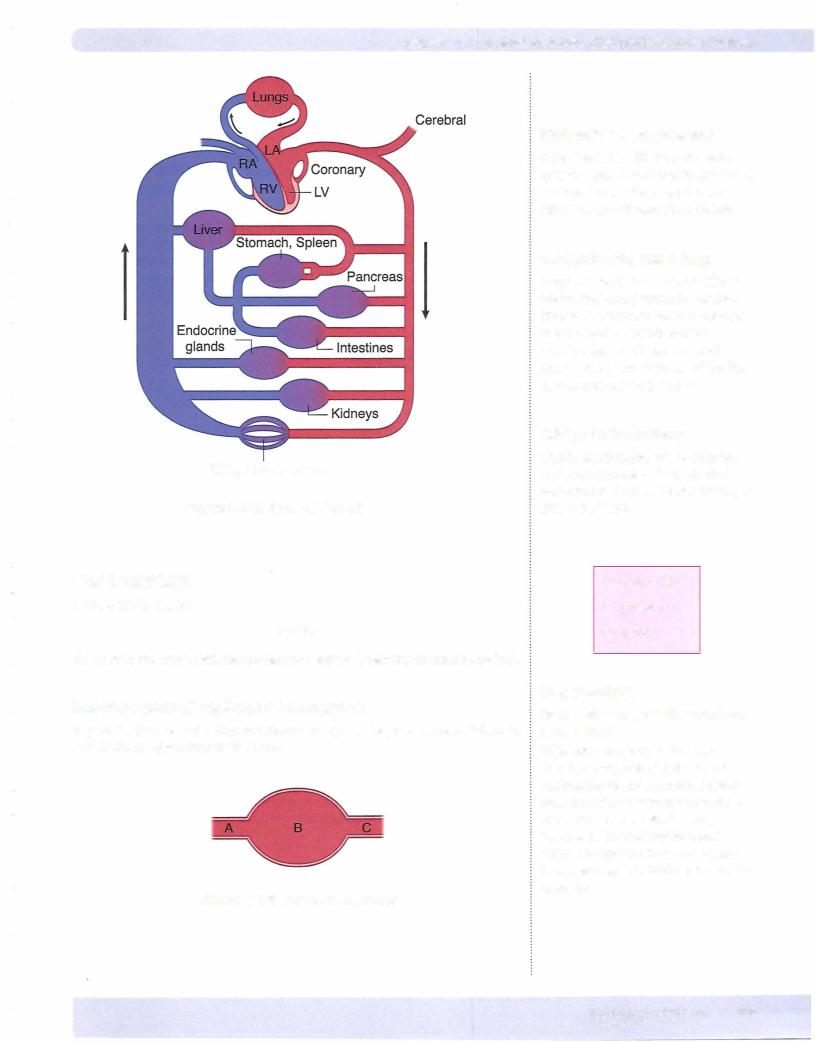
Figure V-1-2 shows that the systemic circuit is a branching circuit. It begins as a large single vessel, the aorta, and branches extensively into progressively smaller vessels until the capillaries are reached. Thereversethen takes place in thevenous circuit.
86 M EDICAL
Chapter 1 • GeneralAspects of the Cardiovascular System
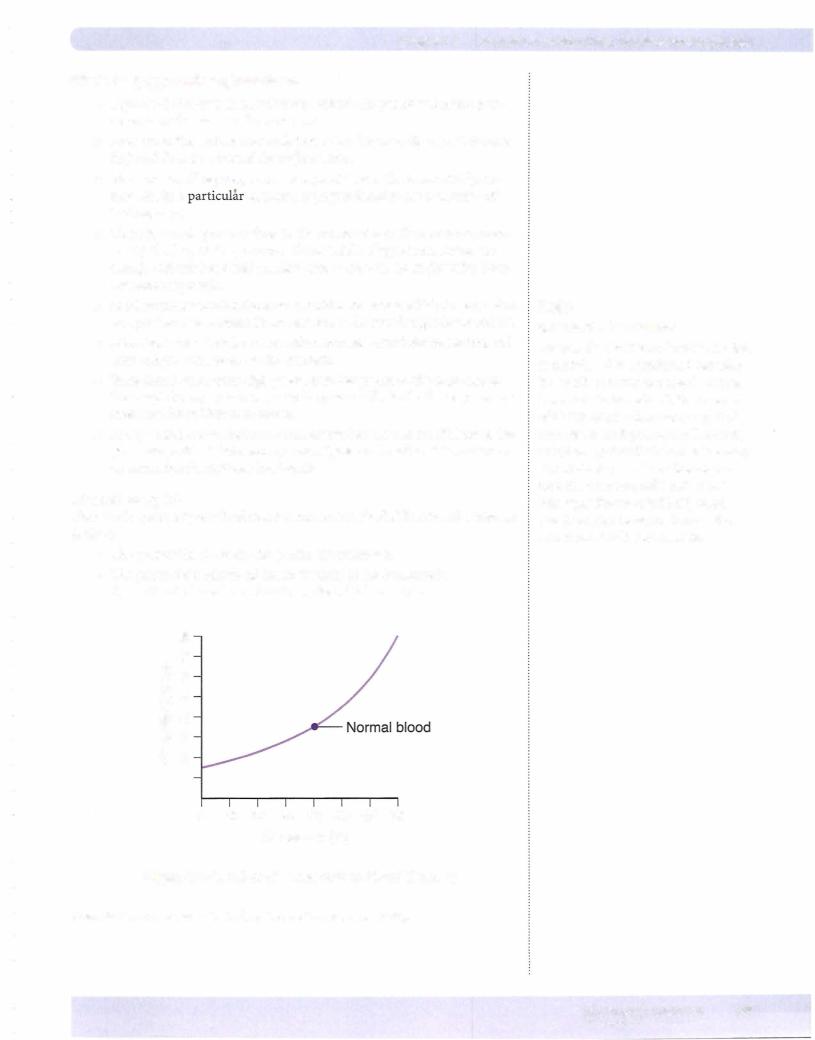
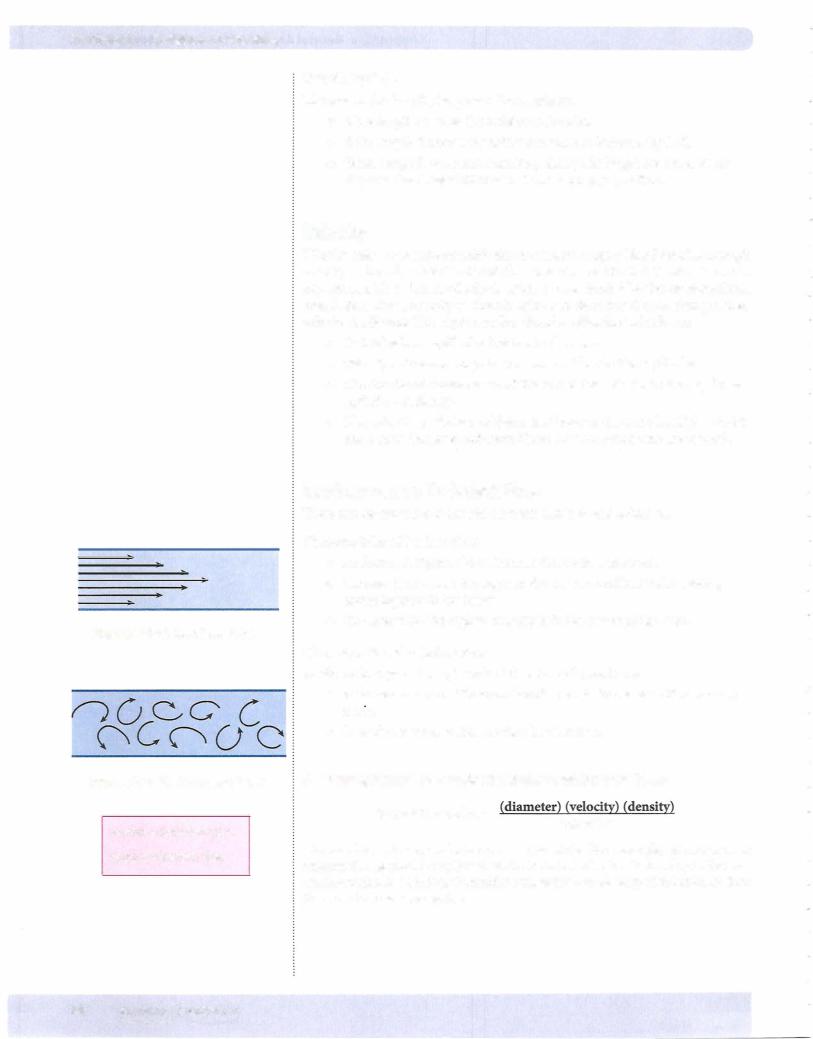
The following promote the development ofturbulent flow (i.e., increase Reynolds' number):
•Increasing tube diameter
•Increasing velocity
•Decreasing blood viscosity, e.g., anemia (cardiac flow murmer)
The vessel in the systemic circuit that is closest to the development ofturbulent flow is the aorta. It is a large-diameter vessel with high velocity. This is where turbulence should appear first in anemia.
The following also promote turbulence:
•Vessel branching
•Narrow orifice (severe stenosis)-due to very high velocity of flow
During inspiration and expiration, turbulent flow occurs in the large airways of the conducting zone.
SeriesVersus Parallel Circuits
•If resistors are in series, then the total resistance is the sum ofeach indi vidual resistor.
RT = Rl + R2 + R3...
•Ifresistors are in parallel, then the total resistance is added as reciprocals of each resistor.
l/RT = l/Rl + l/R2 + l/R3...
• Thus, total resistance is less in parallel circuits compared to series circuits.
• The application of this concept is that blood flow to the various organ beds of the systemic circulation is the result of parallel branches off of the aorta.
- Because they are parallel branches, the total resistance ofthe systemic circulation is less than if the organs were in series bloodflow-wise.
Application of Hemodynamics to the Systemic Circulation
Figure V-1-8 is a simplified model ofthe circulation that we can use to examine whole-body cardiovascular regulation. Blood flows from the aorta to the large arteries that supply the various organs. Within each organ, there are muscular arterioles that serve as the primarysite ofresistance (see above). The sum ofthese resistors (added as reciprocals because ofthe parallel arrangement) is TPR/SVR. This represents afterload to the heart (see previous chapter).
There are 2 functional consequences related to the fact arterioles serve as the primarysite of resistance:
•They regulate blood flow to the capillaries (site of exchange with the tissue).
•They regulate upstream pressure, which is mean arterial pressure (MAP).
MEDICAL 91
Section V • Peripheral Circulation
92 MEDICAL
Chapter 1 • GeneralAspects of the Cardiovascular System
Skin, Muscle, Bone
Figure V-1-8. Systemic Circuit
WALL TENSION
LaPlace relationship:
T o ePr
The aortais thearterywith the greatestwalltension (greatestpressure and radius).
Development ofan ArterialAneurysm
Figure V- 1-9 shows a developing arterial aneurysm. The pressures at points A, B, and C will be approximately the same.
Figure V-1-9. Aortic Enlargement
Bridge to Pharmacology
Drugs that mimic NE cause the same cardiovascular effects that NE produces. These include alpha-1 agonists, NE releasers, and NE reuptake inhibitors.
Bridge to Pharmacology
Drugs that block NE's vascular effects (alpha blockers), prevent NE release, liberate NO, activate beta-2 receptors, block calcium entry into smooth muscle cells, and/or open smooth muscle potassium channels mimic the vasodilatory effects indicated.
Bridge to Pathology
Sepsis, anaphylaxis, and neurogenic shock are examples of uncontrolled vasodilation in the periphery, leading to diminished MAP.
T = wall tension
P = pressure
r = radius
In a Nutshell
Heart with a dilated left ventricle vs. normal heart
If the aortic pressure is the same in both hearts, following the law of
LaPlace the dilated heart must create greater tension to overcome the same aortic pressure and eject blood, because its internal diameter and volume are greater. Thus, the dilated heart exerts greater total tension on the myocytes.
MEDICAL 93
Section V • Peripheral Circulation
•Thus, because the aneurysm has a greater radius, its wall tension is greater than that of the surrounding normal vessel segments.
•Also, as the aneurysm enlarges, wall tension increases and the vessel is more likely to burst. Examples are subarachnoid hemorrhage, aortic aneurysm, and diverticulitis.
•This principle also is important in dilated heart failure, in which the increased chamber size places greater tension on the failing ventricle. This further reduces its performance.
•Another type of aneurysm is referred to as a dissecting aneurysm. In systemic arterial disease, the high velocity in the aorta may damage the endothelial lining, allowing blood to flow between and dissect the layers of the aorta. This weakens the aortic wall and is considered a life-threat ening condition.
VESSEL COMPLIANCE
C = !lV!lP
Compliance of a vessel can be calculated, but the resulting number is, for all practical purposes, meaningless. It is much more important to simply have a good concept of compliance and understand the differences in compliance among the vessels that make up the cardiovascular system.
•Compliance is essentially how easily a vessel is stretched. If a vessel is easily stretched, it is considered very compliant. The opposite is non compliant or stiff.
•Elasticity is the inverse of compliance. A vessel that has high elasticity (a large tendency to rebound from a stretch) has low compliance.
SystemicVeins
Systemic veins are about 20 times more compliant than systemic arteries.
•Veins also contain about 70% of the systemic blood volume and thus represent the major blood reservoir.
•If blood is in the veins, then it is not available for the heart to pump and is thus not contributing to the circulating blood volume.
In short: When considering whole-body hemodynamics, compliance resides in the venous system. One must not forget the functional implications of arterial compliance, particularly with respect to arterial pressures (see below), but for the circulation as a whole, compliance is in the venous system.
Venous Return
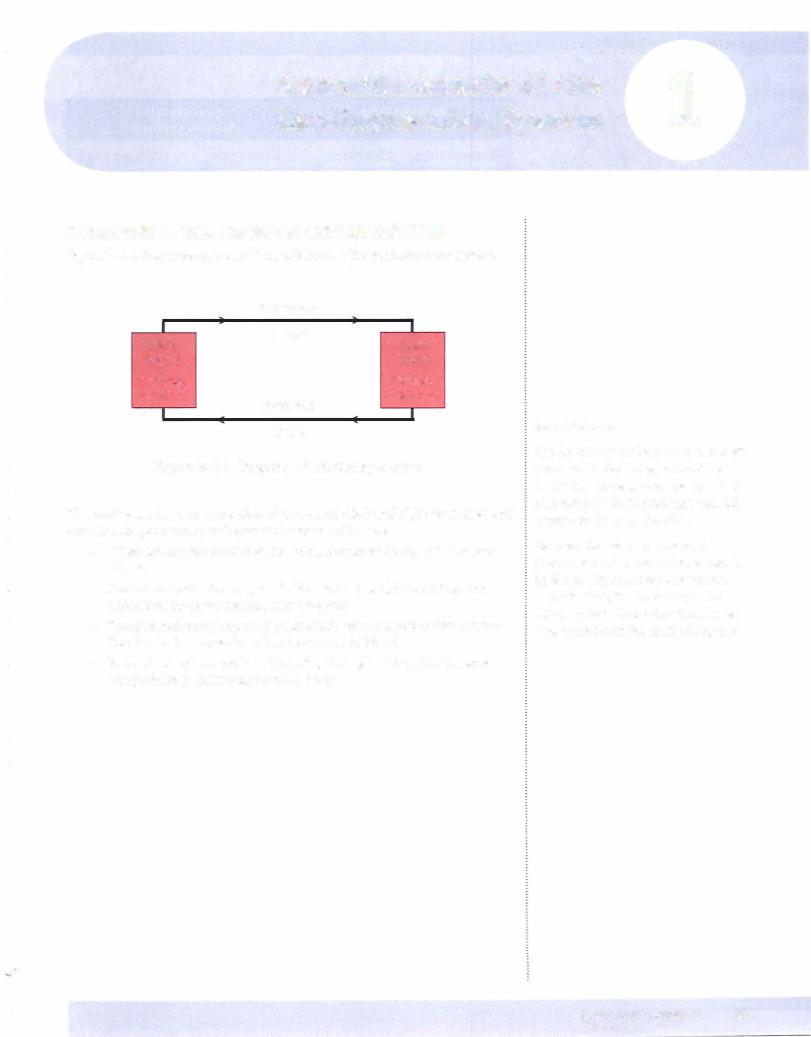
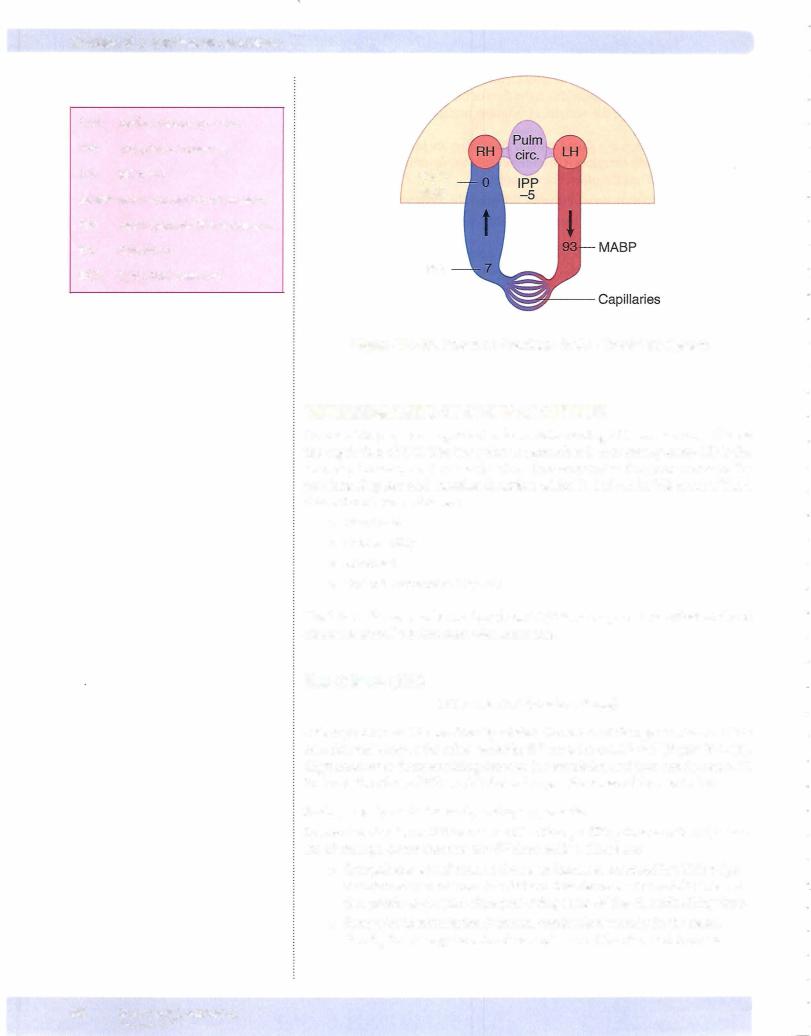
To understand vascular function and thus ultimately the regulation of cardiac output, one can "split" the circulation into 2 components (Figure V- 1 - 10):
•Cardiac output (CO): flow of blood exiting the heart (down arrow on the arterial side).
94 M EDICAL
Chapter 1 • GeneralAspects of the cardiovascular System
•Venous return (VR): flow ofblood returning to the heart (up arrow on the venous side). Because this is the flow ofblood to the heart, it deter mines preload for the ventricles (assuming normal ventricular function).
Because the circulation is a closed system, these flows are intertwined and must be the same when one examines it"overtime" or at steady-state. In addition, each flow is "dependent" on the other. For example:
•If CO fell to zero, then ultimatelyVR would become zero.
•If one were to stop VR, there would ultimately be no CO.
These are extreme examples to illustrate the point that altering one ultimately alters the other and a variety of factors can transiently or permanently alter each ofthevariables, resulting in the other variable beingimpacted to the same degree. In Section IV, chapter 1, we discussed ventricular function, whichplays a pivotal role in CO. In this section, we discuss the regulation ofVR. VRrepresents vascu lar function and thus understanding its regulation sets the stage for understand ing CO regulation.
VR is the flow of blood back to the heart and it determines preload. Since it is a flow,it must follow the hemodynarnicprinciples describedabove,i.e., it is directly proportional to the pressure gradient and inversely related to the resistance.
•Right atrialpressure (RAP):blood is flowing to the right atrium, thus RAP is the downstream pressure.
•Mean systemic fillingpressure (Psf): represents the upstream pressure (pressure head) forVR.
Mean systemic fillingpressure (Psf): Although not a "theoretical" pressure (as per numerous experiments, Psf is typically -7 mm Hg prior to endogenous compensations), this is not a pressure that can be conveniently measured, par ticularly in a patient. However, because it is the pressure when no flow exists, it is primarily determined byvolume and compliance (seeVessel Compliance above):
•Blood volume: There is a direct relation between blood volume and Psf. The greater the blood volume, the higher the Psf and vice versa.
•Venous compliance: There is an inverse relation between venous com pliance and Psf. The more compliant the veins, the lower the Psf and vice versa.
Because Psf is the pressure head (upstream pressure) driving VR, then VR is directly related to Psf. If allother factors are unchanged, it follows that:
•An increase in blood volume increases VR.
•A decrease in blood volume decreases VR.
•A decrease in venous compliance (sympathetic stimulation; muscle
pump) increases VR.
• An increase in venous compliance (sympathetic inhibition; venodilators; alpha block) decreases VR.
Note
Engaging the muscle pump also increases Psf.
MEDICAL 95
Section V • Peripheral Circulation
CVP: |
central venous pressure |
IPP: |
intrapleural pressure |
LH: |
left heart |
MABP: mean arterial blood pressure
Psf: |
mean systemic filling pressure |
RH: |
right heart |
RAP: |
right atrial pressure |
CVP/
RAP
Psf
Figure V-1-10. Pressure Gradients in the Circulatory System
DETERMINANTS OF CARDIAC OUTPUT
Because VR plays an important role in determining CO, we can now discuss the regulation of CO. The key point to remember is that steady-state CO is the interplay between ventricular function (see ventricular function curves in the previous chapter) and vascular function, which is defined by VR curves. The 4 determinants are as follows:
•Heart rate
•Contractility
•Afterload
•Preload (determined by VR)
The latter 3 factors can be combined on CO/VR curves, which are illustrated and discussed later. Let's first start with heart rate.
Heart Rate (HR)
CO = HR x SV (stroke volume)
Although HR and CO are directly related, the effect of changes in HR on CO is complicated because the other variable, SV must be considered (Figure V- 1 - 1 1). High heart rates decrease filling time for the ventricles, and thus can decrease SV. In short, the effect of HR on CO depends upon the cause ofthe rise in HR.
Endogenouslymediated tachycardia,e.g., exercise
In exercise, the rise in HR increases CO. Although filling time is reduced, a vari ety of changes occur that prevent SV from falling. These are:
• Sympathetic stimulation to the heart increases contractility. This helps maintain stroke volume. In addition, this decreases the systolic interval (see previous chapter) thus preserving some of the diastolic filling time.
•Sympathetic stimulation increases conduction velocity in the heart, thereby increasing the rate of transmission of the electrical impulse.
96 MEDICAL
Chapter 1 • GeneralAspects of the Cardiovascular System
•Sympathetic stimulation venoconstricts, which helps preserve VR (see above) and ventricular filling.
•The skeletal muscle pump increasesVR, helping to maintain ventricular filling.
Pathologically mediated tachycardia,e.g.,tachyarrhythmias
•The sudden increase in HR curtails ventricular filling resultingafallin in CO (Figure V-1-11).
•Although the fall in CO decreases MAP and activates the sympathetic nervous system, this occurs "after the fact" and is thus unable to com pensate.
•There is no muscle pump to increase VR.
co
HR
Figure V-1-11
Contractility
Contractility was discussed in depth in Chapter 1 ofSection IV. There is a direct relation between contractility and ventricular output, thus there is typically a di rect relation between contractilityand CO.
Afterload
Afterload is the load the heart works against and the best marker of afterload is TPR. This was also discussed in Chapter 1 ofSection IV. There is an inverse rela tion between afterload and ventricular output, thus there is generally an inverse relation between afterload and CO.
Preload
As discussedin Chapter 1 ofSection IV, there is a direct relation between preload and ventricular output (Frank-Starling). Presuming there is no change in con tractility or afterload, increasing preload increases CO and vice versa.
Cardiac Output (CO)/Venous Return (VR) Curves
CO/VR curves (Figure V-1-12) depict the interplay between ventricular and vas cular function indicated in the venous return section above. Steady-state CO is determined bythis interplay.
MEDICAL 97

Section V • Peripheral Circulation
A = steady-state cardiac output
All individuals operate at the intersection ofthe ventricular function and venous return curves.
B = mean systemic filling pressure (Pst)
This is directly related to vascular volume and inversely related to venous compliance.
Ventricularfunction (solid line ofFigure V-1-12)
•X-axis is RAP, a marker ofpreload.
•Y-axis is CO.
•Thus, this curve is the same as depicted in Figures N-1-3 and IV-1-4 and it defines ventricular function.
•This curve shows that RAP has a positive impact on CO (Frank-Starling mechanism)
Vascularfunction (dashed line ofFigure V-1-12)
•X-axis is RAP, the downstream pressure forVR.
•Y-axis is VR.
•The curve shows that as RAP increases, VR decreases. This is because RAP is the downstream pressure for VR. As RAP increases, the pressure gradient for VR falls, which in turn decreases VR. Thus, RAP has a nega tive impact on VR.
•X-intercept for the VR curve is Psf (point B on the graph). This is the pressure in the circulation when there is no flow (see section on venous
return). Psf is the pressure head (upstream pressure) forVR. Thus, when RAP = Psf, flow (VR) is zero.
Steady-state CO
•The intersection of the ventricular and vascular function curves deter mines steady-state CO (point A in Figure V-1-12). In other words, point A represents the interplay between ventricular and vascular function.
•Discounting HR, the only way steady-state CO can change is ifventricu lar function, or vascular function, or both change.
CONR
Right Atrial Pressure (RAP)
Figure V-1-12
98 MEDICAL

Section V • Peripheral Circulation
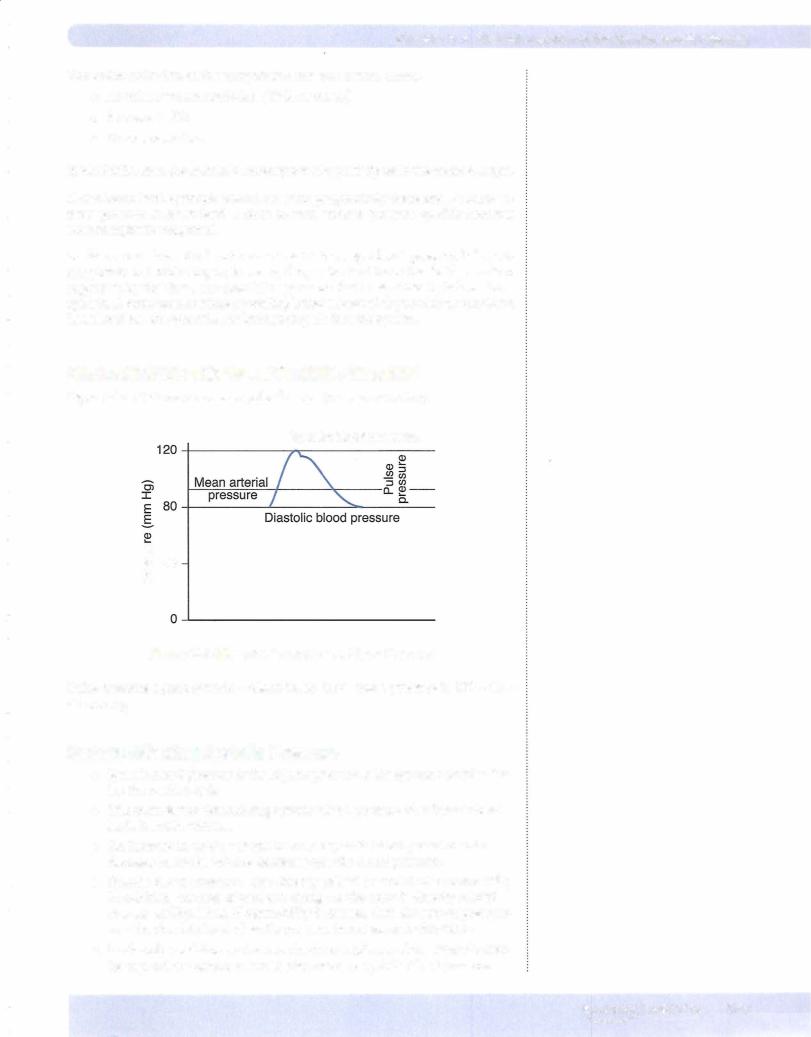
Factors Affecting Diastolic Pressure
•Diastolic blood pressure (DBP) is directly related to the volume of blood left in the aorta at the end of diastole.
•One important factor determining DBP is total peripheral resistance (TPR).
•Dilation ofthe arterioles decreases DBP and constriction of the arterioles increases DBP.
•HR is the second key factor influencing diastolic pressure and they are directly related: increased HR increases DBP, while decreased HR decreases DBP.
•DBP is also directly related to SV, but this is typically not a major factor.
Note
Theoretically, the systemic pulse pressure can be conceptualized as being proportional to stroke volume, or the amount of blood ejected from the left ventricle during systole, and inversely proportional to the compliance ofthe aorta.
Factors Affecting Pulse Pressure
The following increase (widen) pulse pressure:
•An increase in stroke volume (systolic increases more than diastolic)
•A decrease in vessel compliance (systolic increases and diastolic decreases)
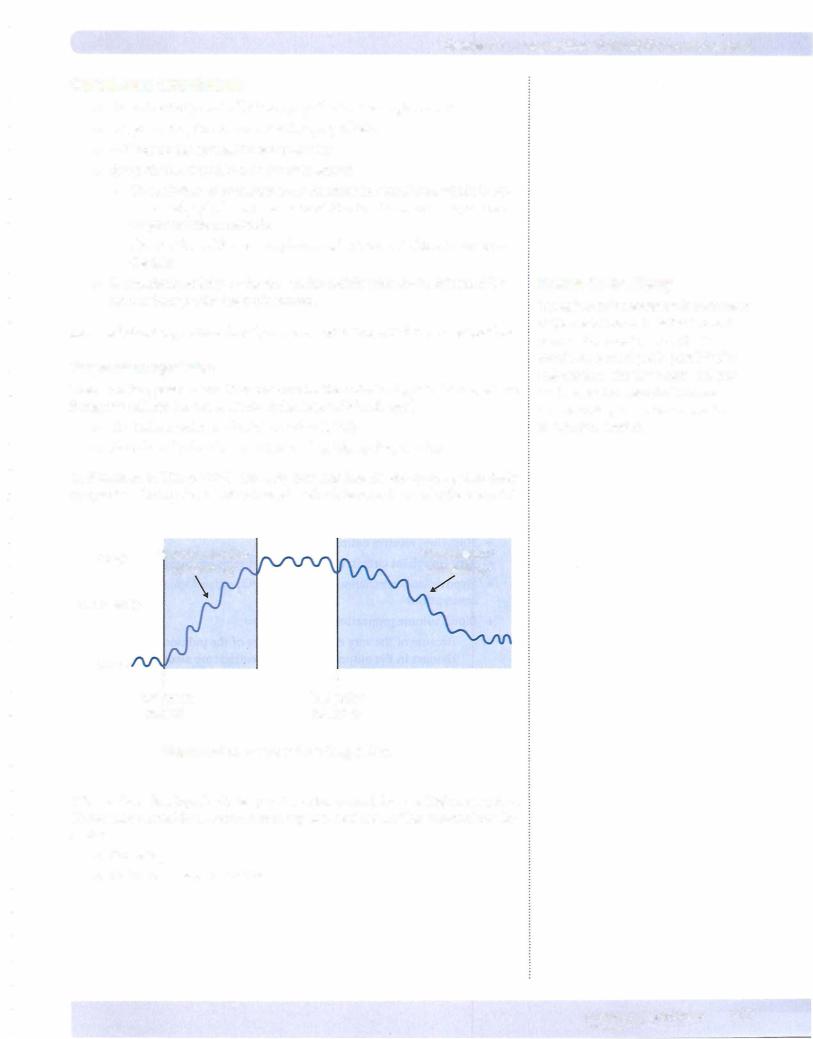
The aorta is the most compliant artery in the arterial system. Peripheral arteries are more muscular and less compliant. Based on the preceding information, in Figure V-1-16 the pressure record on the left best represents the aorta, whereas the one on the right best represents the femoral artery.
- ---=-----1.....(L----="-- |
||
_/ |
""' |
.....Mean pressure |
-- |
|
|
Figure V-1-1 6. Compliance and Pulse Pressure
The figure demonstrates that a compliant artery has a small pulse pressure and that a stiffartery has a large pulse pressure. Also, pulse pressure increases with age because compliance is decreasing. This can produce isolated systolic hyperten sion, in which mean pressure is normal because the elevated systolic pressure is associated with a reduced diastolic pressure.
Factors Affecting Mean Pressure
Mean pressure is pressure averaged over time. It is not the arithmetic mean and is closer to diastolic pressure than to systolic pressure.
Mean pressure can be approximated by the following formulas:
For a blood pressure of 120/80 mm Hg:
Mean pressure = diastolic + 1/3 pulse pressure
80 + 1/3(40) = 93 mm Hg
= 2/3 diastolic pressure + 1/3 systolic pressure
2/3(80) + 1/3(120) = 93 mm Hg
Any formula that calculates mean pressure must give a value between systolic and diastolic but closer to diastolic than systolic.
102 MEDICAL
Section V • Peripheral Circulation
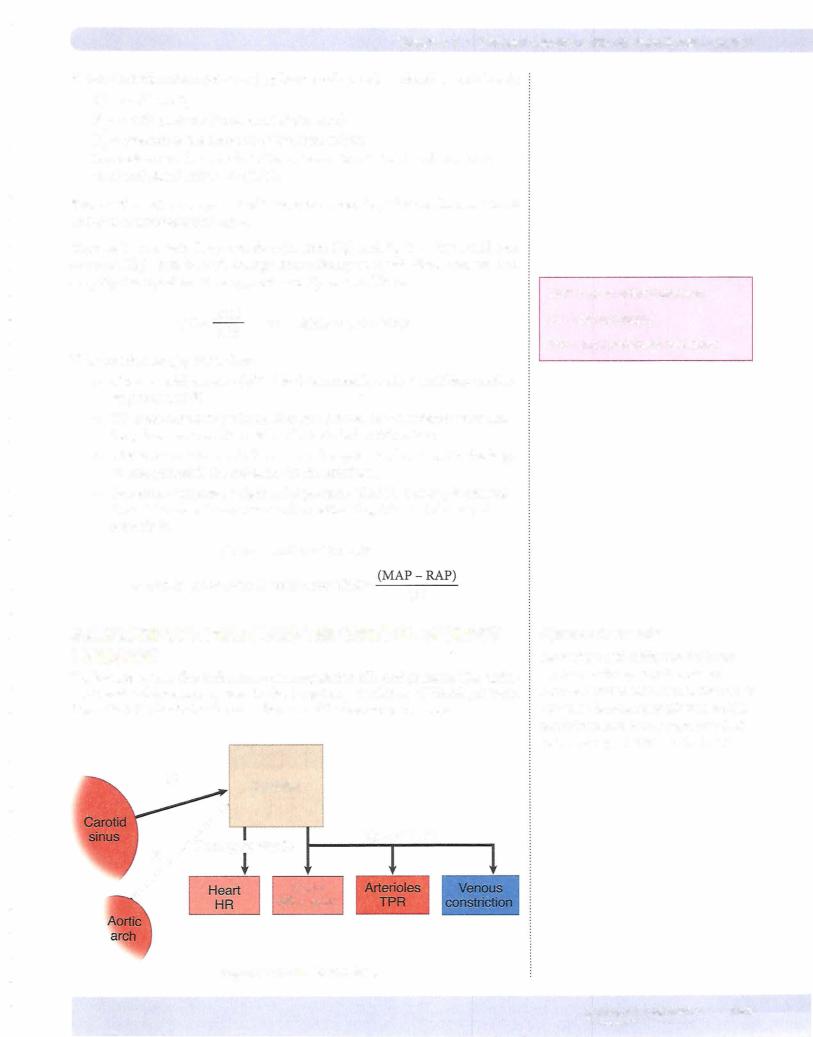
MAP=CO x TPR
Key points regarding arterial barorectors:
•Mechanoreceptors irnbedded in the walls of the aortic arch and carotid sinus that are stimulated by a rise in intravascular pressure.
•Afferent activity is relayed to the medulla via cranial nerves IX (carotid sinus) and X (aortic arch).
•Baroreceptor activity exists at the person's resting arterial blood pres sure.
•Afferent activity stimulates the parasympathetic nervous system and inhibits the sympathetic nervous system.
•A fall in arterial blood pressure evokes a reflex decrease in parasympa thetic activity and increase in sympathetic activity. This is a negative feedback system to bring blood pressure back to its original level.
•A rise in arterial blood pressure evokes a reflex increase in parasympa thetic activity and fall in sympathetic activity. This is a negative feedback system to bring blood pressure back to its original level.
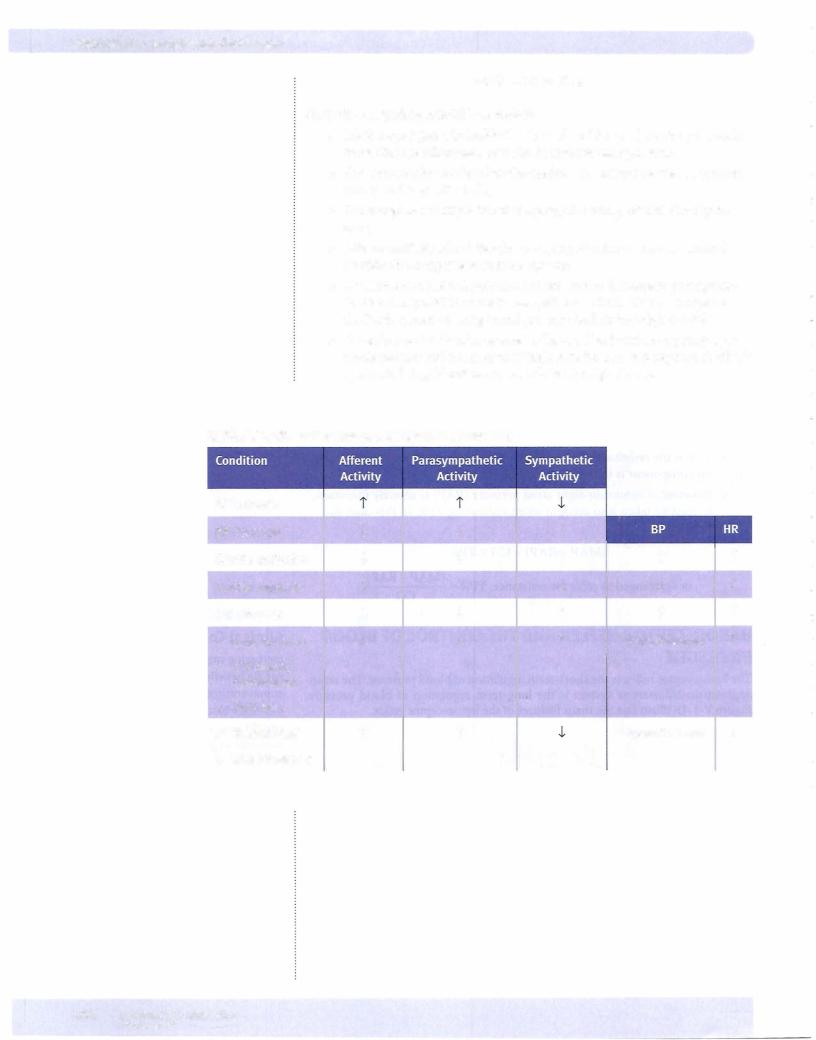
Table V-1-2. Reflex Changes for Specific Maneuvers
BP increase |
|
|
|
|
|
|
|
BP decrease |
J. |
J. |
i |
i |
|
i |
|
Carotid occlusion |
J. |
J. |
i |
|
|||
|
|||||||
Carotid massage |
i |
i |
J. |
J. |
|
J. |
|
Cut afferents |
J. |
J. |
i |
i |
|
i |
|
• |
Lying to stand |
J. |
J. |
i |
i toward normal |
|
i |
• |
Orthostatic |
|
|
|
|
|
|
|
|
|
|
|
|
||
|
|
|
|
|
|
||
• |
hypotension |
|
|
|
|
|
|
Fluid loss |
|
i |
|
-1. toward normal |
|
J. |
|
• |
Volume load |
i |
|
|
|||
• |
Weightlessness |
|
|
|
|
|
|
104 MEDI CAL

Chapter 1 • General Aspects of the Cardiovascular System
Chapter Summary
•The cardiovascular system consists oftwo circuits and two pumps connected in series.
•Systemic pressure decreases slightly through the arteries, decreases markedly through the arterioles, and then decreases only slightly more through the major veins. The loss of pressure is determined by regional resistance.
•The cross-sectional area increases from a minimum in the aorta to a maximum in the capillaries. Velocity ofthe blood is inversely related to a region's cross-sectional area.
•The main blood reservoir is the systemic veins.
•Ofthe factors affecting a vessel's resistance, radius is the most important. The radius ofthe arterioles determines total peripheral resistance.
•The cardiovascular system is a laminar flow system. The factors that promote turbulence include decreased fluid viscosity, large-diameter tubes, increased fluid velocity, and vessel branching.
•Psf is the pressure-head driving VR. It is directly related to blood volume and inversely related to venous compliance.
•Ifventricular function is normal, VR determines preload.
•CO is determined by HR, contractility, afterload, and preload. It is the interplay ofventricular and vascular function.
•Ventricular function curves describe ventricular function, while VR curves illustrate vascular function.
•Structures connected in series produce high resistance, and flow is dependent and equal atall points.
•Mean arterial pressure is determined only by the circulating blood volume (cardiac output) and the resistance ofthe arterioles.
•Vessel wall tension is directly proportional to pressure and radius.
•The aorta is the most compliant artery, but veins are more compliant than arteries.
•Gravity causes the pooling of blood in the dependent veins. This blood does not contribute to cardiac output.
•The baroreceptor reflex alters parasympathetic and sympathetic outflow to minimize acute changes in blood pressure.
MEDICAL 105


Chapter 2 • Regulation of Blood Flow and Pressure
Organ X
Arterial |
Venous |
Figure V-2-2. Application of the Fick Principle
BLOOD FLOW REGULATION
Flow is regulated by constricting and dilating the smooth muscle surrounding the arterioles.
Intrinsic Regulation (Autoregulation)
The control mechanisms regulating the arteriolar smooth muscle are entirely within the organ itself.
•What is regulated is blood flow, not resistance. It is more correct to say that resistance is changed in order to regulate flow.
•No nerves or circulating substances are involved in autoregulation. Thus, the autonomic nervous system and circulating epinephrine have nothing to do with autoregulation.
There are 2 main mechanisms to explain autoregulation.
Metabolic mechanism
•Tissue produces a vasodilatory metabolite that regulates flow, e.g., ade nosine, C02, H+, and K+.
•A dilation of the arterioles is produced when the concentration of these metabolites increases in the tissue. The arterioles constrict if the tissue concentration decreases.
Myogenic mechanism
•Increased perfusing pressure causes stretch of the arteriolar wall and the surrounding smooth muscle.
•Because an inherent property of the smooth muscle is to contract when stretched, the arteriole radius decreases, and flow does not increase sig nificantly.
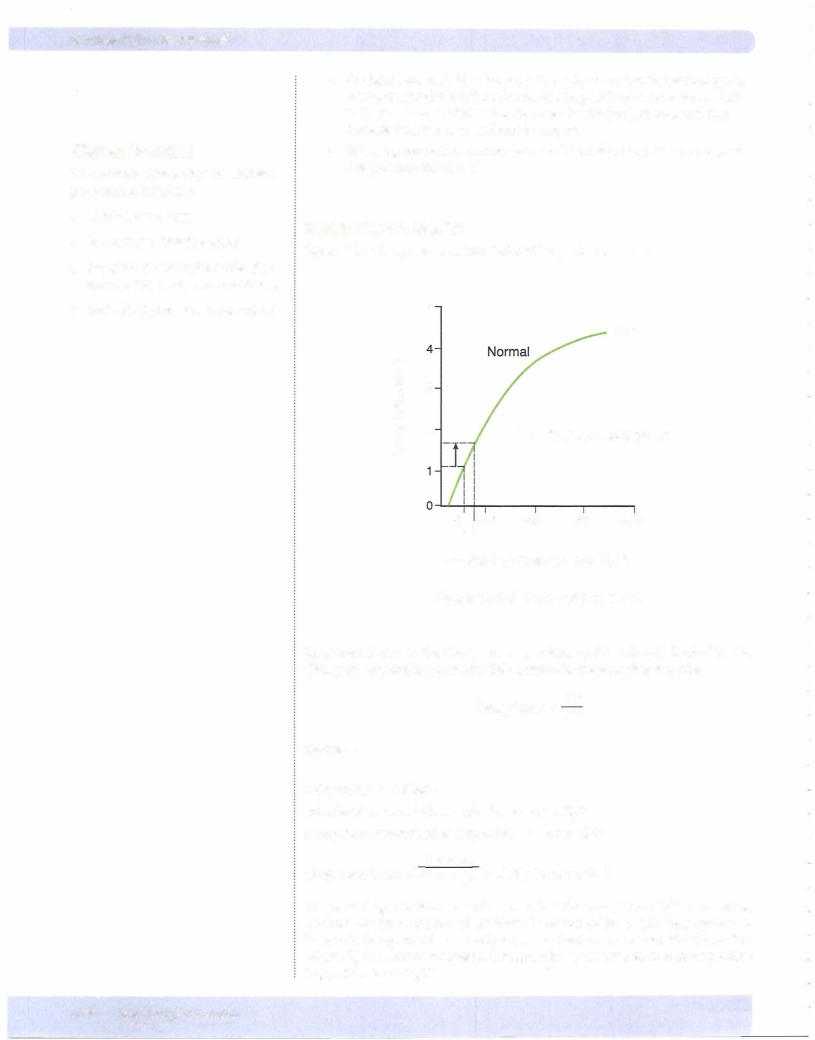
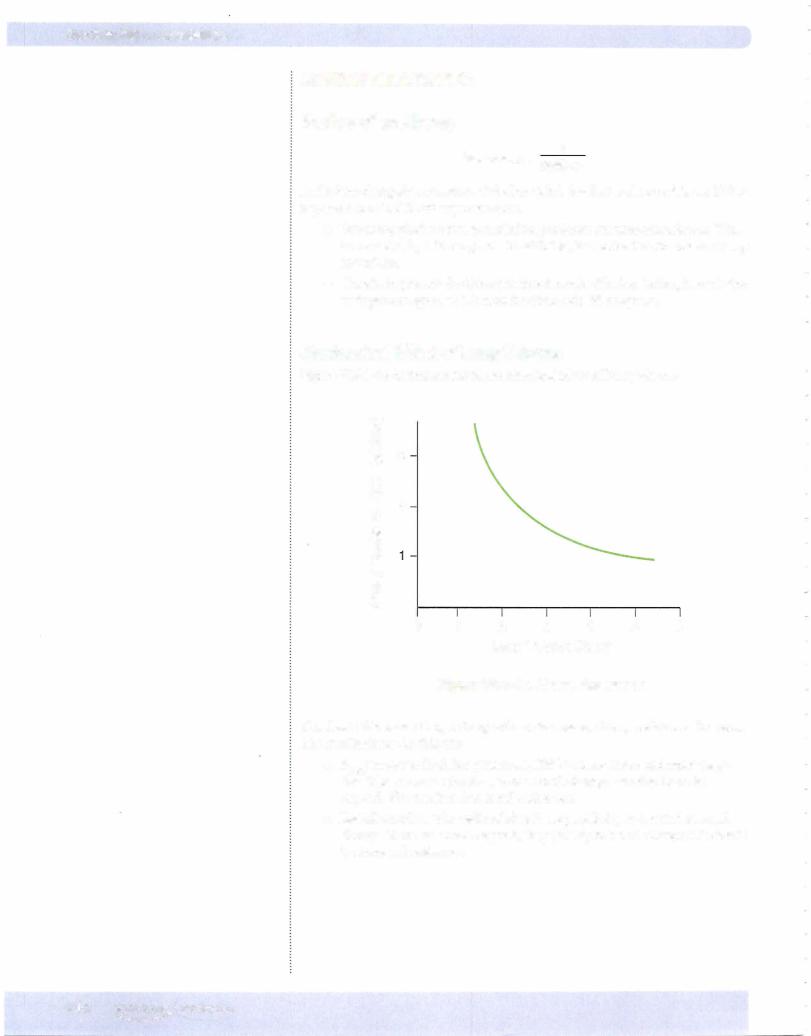
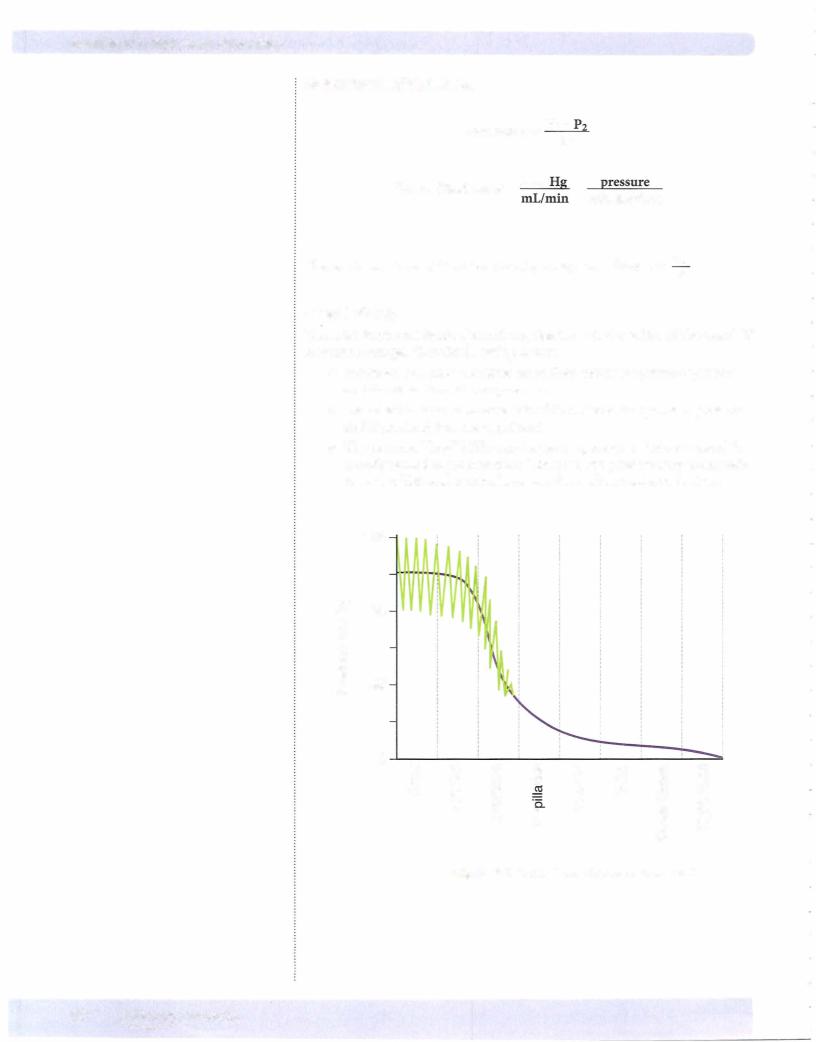
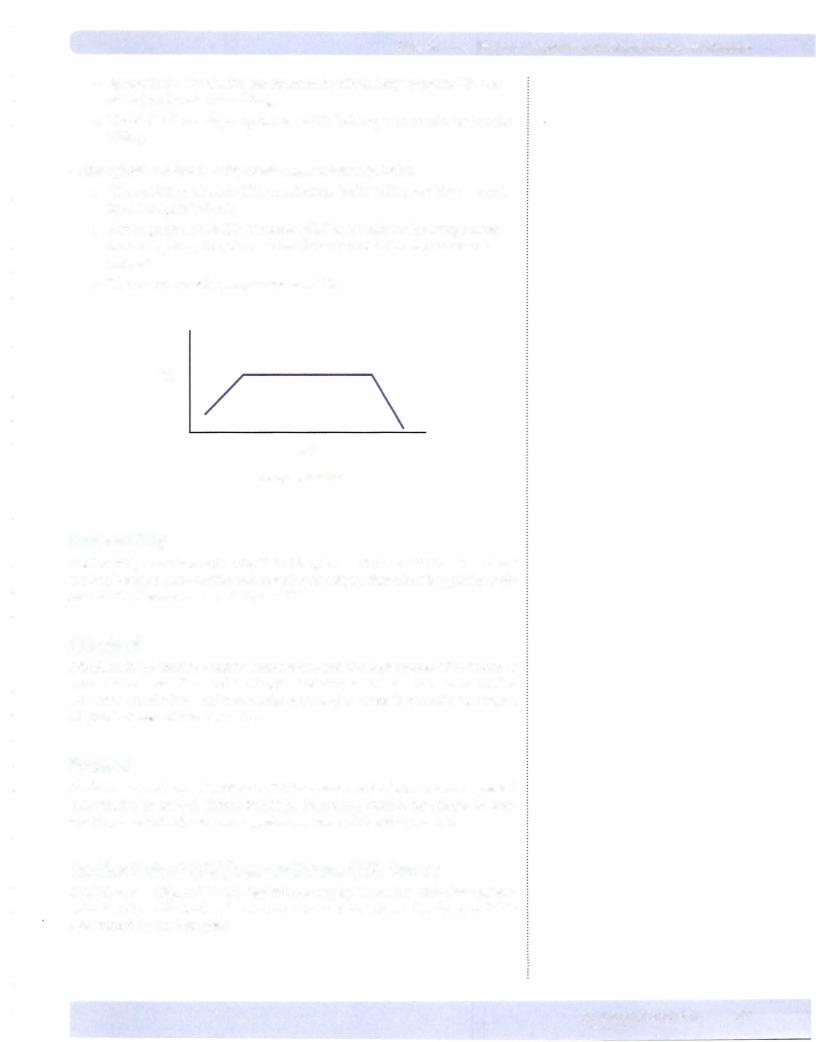
MajorCharacteristics of an Autoregulating Tissue
Blood flow should be independent ofblood pressure.
This phenomenon is demonstrated for a theoretically perfect autoregulating tissue in Figure V-2-3. The range of pressure over which flow remains nearly constant is the autoregulatory range.
MEDICAL 109


Chapter 2 • Regulation of Blood Flow and Pressure
•Epinephrine can evoke vasodilation by binding to vascular 2 receptors.
•With the exception of the penis, the parasympathetic nervous system does not affect arteriolar tone.
Control of Restingversus Exercising Muscle
Resting muscle
Flow is controlled mainly by increasing or decreasing sympathetic a:-adrenergic activity.
Exercising muscle
The elevated metabolism in exercising skeletal muscle demands an increase in blood flow (see application of the Fick principle above). In addition, the increased tissue 02 consumption results in a fall the Pv02 of blood leaving the working muscle. The primary mechanisms for increasing flow are:
•Production ofvasodilator metabolites, e.g., adenosine, C02, H+, and K+ causes marked vasodilation. In addition, these metabolites diminish NE's ability to vasoconstrict the arterioles. Further, the increased endo thelial shear-stress of the high flow liberates NO.
•Muscle pump
BLOOD FLOWTO THEVARIOUS ORGANS
CoronaryCirculation
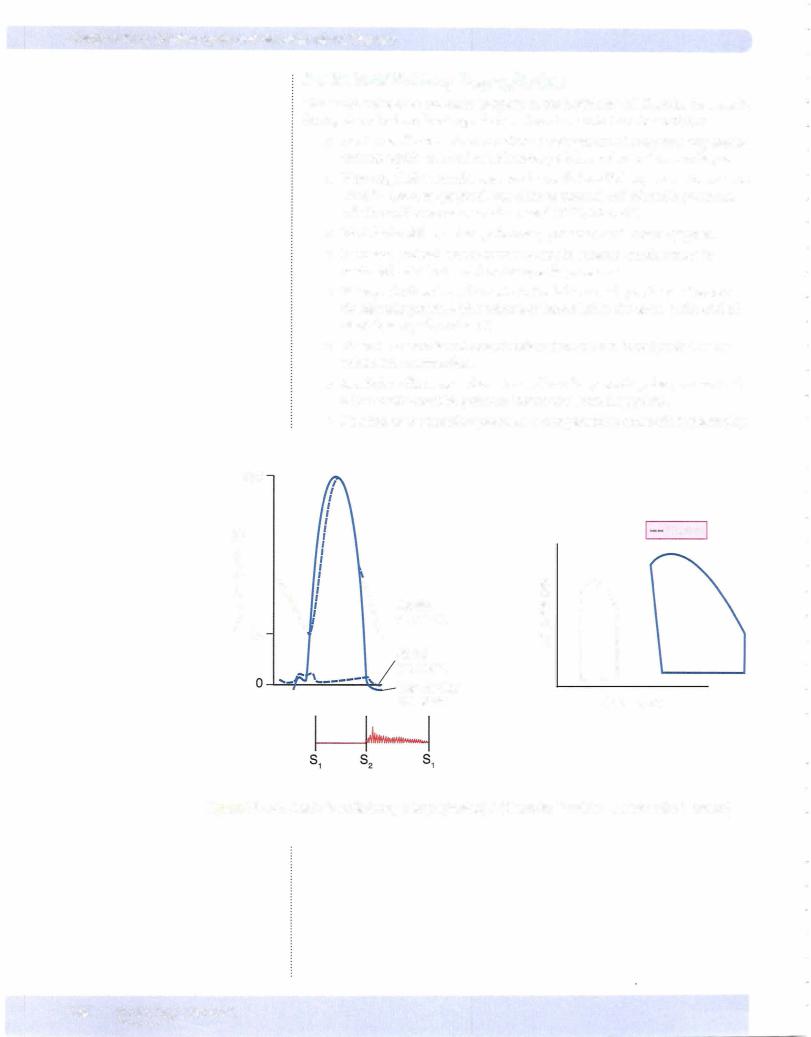
Coronaryflowpatterns
Characteristics ofleft coronary flow (flow to the left ventricular myocardium):
Left ventricular contraction causes severe mechanical compression ofsubendocar dial vessels. Therefore:
•Verylittle if any blood flow occurs during systole.
•Most ofthe blood flow is during diastole.
•Some subepicardial flow occurs during systole.
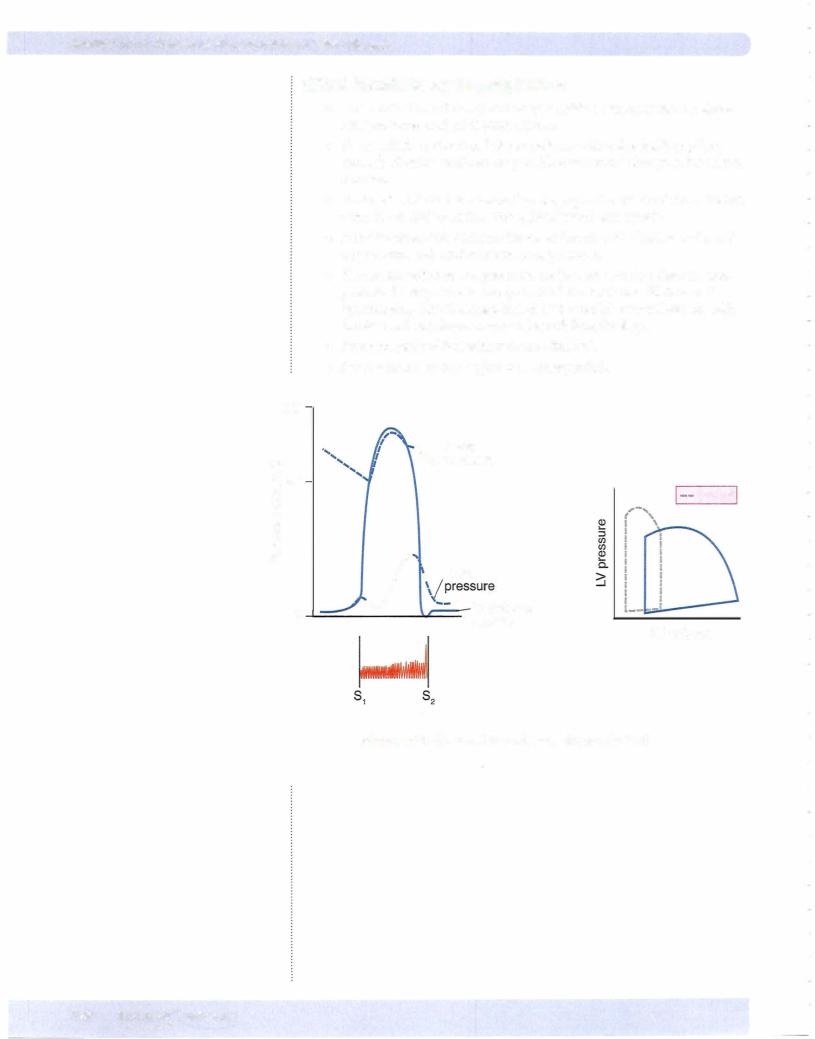
Characteristicsofrightcoronarybloodflow(flowtotherightventricularmyocardium):
Right ventricular contraction causes modest mechanical compression of intra myocardial vessels. Therefore:
•Significant flow can occur during systole.
•The greatest flow under normal conditions is still during diastole.
Oxygenation
In the coronary circulation, the tissues extract almost all the oxygen they can from the blood, even under "basal" conditions. Therefore:
•The venous P02 is extremelylow. It is the lowest venous P02 in a resting individual.
MEDICAL 1 1 1
Section V • Peripheral Circulation
•Because the extraction ofoxygen is almost maximal under resting condi tions, increased oxygen deliveryto the tissue can be accomplished onlyby increasing blood flow (Fickprinciple).
•In the coronary circulation, flowmust match metabolism.
•Coronary blood flow is most closelyrelated to cardiac tissue oxygen consumption and demand.
Pumping action
Coronary blood flow (mL/min) is determined by the pumping action, or stroke worktimes heart rate, ofthe heart.
Increased pumping action means increased metabolism, which increases the pro duction ofvasodilatorymetabolites. In turn, coronaryflow increases.
Increased pump function occurs with:
•An increase in any of the parameters that determine CO:
-HR
-Contractility Afterload Preload
•HR, contractility, and afterload (often calledpressure work) are more met abolicallycostlythan theworkassociatedwith preload (volume work).
•Thus, conditions in which HR, contractility, and/or afterload increase, e.g., hypertension, aortic stenosis, and exercise require a greater increase in flow compared to conditions that only increase volume work (supine, aortic regurgitation, volume loading).
Cerebral Circulation
Flow is proportional to arterial PC02. Under normal conditions, arterial PC02 is an important factor regulating cerebral blood flow.
• Hypoventilation increases arterial PC02, thus it increases cerebral blood flow.
• Hyperventilation decreases arterial PC02, thus it decreases cerebral blood flow.
As long as arterial P02 is normal or above normal, cerebral blood flow is regulated via arterial PC02. Therefore:
•If a normal person switches from breathing room air to 100% oxygen, there are no significant change in cerebral blood flow.
•However, a (large) decrease in arterial P02 increases cerebral blood flow; an example is high-altitude pulmonaryedema (HAPE). Under these conditions, it is the low arterial P02 that is determining flow.
•Baroreceptor reflexes do not affect flow.
Intracranial pressure is an important pathophysiologic factor that can affect cere bral blood flow.
112 MEDICAL
Section V • Peripheral Circulation
Aftera fever "breaks;' theset point has returned to normal, andbody temperature is decreasing. Heat-dissipating mechanisms include:
•Sweating (sympathetic cholinergics)
•Cutaneous vasodilation
Renal and Splanchnic Circulation
•A small change in blood pressure invokes an autoregulatory response to maintain renal and splanchnic blood flows.
•Thus, under normal conditions, the renal and splanchnic circulations demonstrate autoregulation.
•Situations in which there is a large increase in sympathetic activity (e.g., hypotension) usually cause vasoconstriction and a decrease in blood flow.
•Renal circulation is greatly overperfused in terms of nutrient require ments, thus the venous P02 is high.
•About 25% of the CO goes to the splanchnic circulation, thus it repre sents an important reservoir of blood in times of stress.
•Splanchnic blood flow increases dramatically when digesting a meal.
PulmonaryCircuit
Characteristics
•Low-pressure circuit, arterial = 15 mm Hg, venous = 5 mm Hg; small pressure drop indicates a low resistance.
•High flow, receives entire CO
•Very compliant circuit; both arteries and veins are compliant vessels
•Hypoxic vasoconstriction (low alveolar P02 causes local arteriolar vaso constriction)
•Blood volume proportional to blood flow
Because of the very compliant nature of the pulmonary circuit, large changes in the output of the right ventricle are associated with only small changes in pulmonary pressures.
Pulmonaryresponse to exercise
•A large increase in cardiac output means increased volume pumped into the circuit. This increases pulmonary intravascular pressures.
•Because of the compliant nature of the circuit, the pulmonary arterial system distends.
•In addition, there is recruitment of previously unperfused capillaries. Because of this recruitment and distension, the overall response is a large decrease in pulmonary vascular resistance (PVR).
•Consequently, when CO is high, e.g., during exercise, there is only a slight increase in pulmonary pressures.
Without this recruitment and distension, increasing CO would result in a very high pulmonary artery pressure.
114 MEDICAL


SECTION
Cardiac Cycle and
Valvular Heart Disease


SECTION
Respiration