

Лекция Неотл ЭХОКГ / Emergency Echocardiography
.pdf4 GETTING READY FOR THE STUDY
1.3 INTERACTION OF ULTRASOUND WITH TISSUES AND IMAGE FORMATION (FIG. 1.3)
1.3.1 Reflection
The ultrasound image is generated when the main ultrasound beam is reflected by the targeted structure and thus redirected toward the transducer. Reflection occurs at interfaces between media of different acoustic impedance, that is, with different densities and ultrasound propagation velocities. When the differences in impedance are high, such as for pericard, bone, air, heavily calcified structures, or prosthetic material, the intensity of the reflected signal is high as well, while the blood-myocardium interface is a much weaker reflector and will return a small amount of the incident signal. Strong reflectors may totally block the ultrasound signal distal to them (the so-called “shadowing” noted with prosthetic valves) or induce artifacts whereby the ultrasound signal “travels” back and forth between the transducer and an anatomical structure.
FIG. 1.3. Schematic representation of ultrasound interaction with targets of different sizes (See text for details).

1.3 INTERACTION OF ULTRASOUND WITH TISSUES 5
1.3.2 Scattering
For the kind of directional, “mirror-like” reflection described above to occur, the target has to have a lateral dimension greater than the ultrasound wavelength (specular reflector). If the target dimensions are smaller than the ultrasound wavelength, it will behave as a scattering reflector and the ultrasound will be redirected in all directions. Scattering is not suitable for morphological imaging as needed in two-dimensional (2D) echocardiography but is used in Doppler echocardiography and tissue characterization techniques.
1.3.3 Refraction
Part of the ultrasound beam changes its direction at the interface between media of different acoustic impedance in the same way as light rays change their path when they pass through a lens. Occasionally, this phenomenon can induce artifacts as well.
1.3.4 Attenuation
Loss of energy (attenuation) occurs while the ultrasound travels through the tissue, limiting the distance at which a target can be effectively interrogated. The loss of energy increases at higher frequencies, so a loss in penetration is the price to be paid when high frequencies are used to improve resolution (see below). Attenuation occurs in fact twice, once when the transmitted ultrasound penetrates the tissue and again, on its way back from the reflecting target to the transducer. As a result, ultrasound signals from targets remote from the transducer are extremely weak and need a preferential amplification. This is achieved through the time-gain-compensation controls, which allow for the signals returning later (thus, coming from a greater distance) to be selectively amplified.
1.3.5 Image Resolution
Represents the minimal distance at which two discrete targets are still seen as separate. In practical terms, a higher resolution means a more detailed image of a given structure. 2D resolution is better along the ultrasound beam (axial resolution) than on its sides (lateral resolution). With higher frequencies, resolution increases (up to 1 mm); however, ultrasound penetration decreases.
•High frequencies should be tried in children, youngsters, and thinchested individuals where loss of penetration is of less concern.
•Low frequencies offer less quality but may allow reasonable imaging in elderly, overweight, thick-chest patients.
•Focusing on the area of interest and reducing the transmitted power (mechanical index) may improve lateral resolution.

6 GETTING READY FOR THE STUDY
1.3.6 Frame Rate
Not to be confused with frequency, the frame rate, expressed in frames per second (fps) or Hz, shows how many times per second the image renews itself. High rates will provide a smooth image while low rates will not only be “jerky” but may also miss short-lived events, especially in tachycardic patients. Modern systems should allow 2D imaging at frame rates above 30 fps. Tissue Doppler (TD) imaging on the other side requires much higher (>100 fps) frame rates. The actual frame rate is displayed on the machine screen for information purposes (Fig. 1.2) and, in some high-end machines, it can be directly controlled. The available frame rate will reflect a balance between the quality of the transducer, the computing power of the system, and the size and complexity of the scan as determined by other parameters.
To increase frame rate:
•Reduce depth-of-field
•Narrow sector width
•Avoid simultaneous spectral and color Doppler imaging
•When in color mode, use the B/W suppress function
1.3.7 Mechanical Index
Ultrasound amplitude is expressed in decibels (dB) and its intensity is measured in watt/cm2. The mechanical index is used to quantify the mechanical effects. It is a dimensionless parameter, defined as the ratio of the maximal negative pressure to the square root of the frequency. Medical diagnostic ultrasound systems are required to use a mechanical index <1.9 to avoid cavitation, that is, rapid formation and destruction of gas bubbles.1 The usual mechanical index for a standard echocardiographic study is about 1.4 but much lower values are used for contrast studies.
1.4 FUNDAMENTAL AND SECOND HARMONIC IMAGING
The propagation of the ultrasound waves through the target tissues generates secondary ultrasound waves with frequencies which are multiples of the transmitted (fundamental) ultrasound. In fundamental imaging, the reflected harmonic frequencies ultrasound is filtered out and only the fundamental one is processed to generate the echo image. If an opposite algorithm is used whereby the reflected fundamental frequency ultrasound is filtered out and the second harmonic one is processed to generate

1.5 BLOOD FLOW DOPPLER IMAGING 7
the echo image, the modality is called harmonic imaging. Since harmonic signals are generated at a higher depth of field, they will be less distorted by obstacles close to the transducer, such as bony structures. The provided resolution will also be better due to higher frequencies. Initially targeted for use with contrast echocardiography, second harmonic imaging was found useful without contrast as well to improve image quality and became the standard for 2D imaging. The actual modality, that is, fundamental or harmonic is displayed on the machine screen (Fig. 1.2). The potential drawback used to be some artifactual brightening and thickening of the anatomic structures though this is of less concern with modern machines.
•Use second harmonic imaging either as routine or whenever the image quality is unsatisfactory.
•Beware of possible increased tissue brightness seen with this modality.
°Some typical patterns such as the ground-glass or sparkling appearance of cardiac amyloidosis have been described using fundamental imaging.
°If in doubt, double-check with fundamental imaging.
1.5 BLOOD FLOW DOPPLER IMAGING
This technique applies the Doppler principle whereby the difference between the frequency of the emitted ultrasound and that of the ultrasound scattered by the moving red blood cells is used to compute both the velocity and direction of the blood flow (Appendix A). Flow Doppler imaging is utilized to analyze regurgitant and stenotic flows. There are two flow Doppler imaging modalities: spectral and color Doppler.
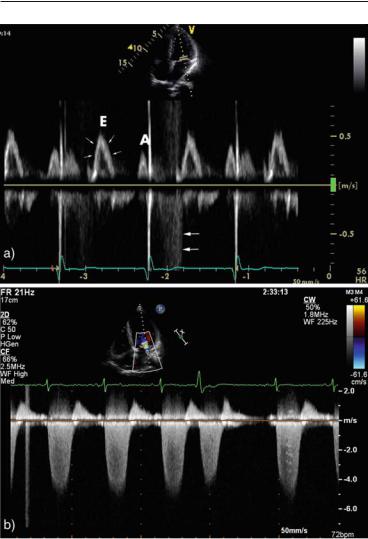
1.5.1 Spectral Doppler (Fig. 1.4)
The display is a waveform showing the direction and velocity of the blood in an area of interest. Its main uses are to determine velocities and gradients. Spectral Doppler can be used as either pulsed wave (PW) when the same transducer alternatively acts as an ultrasound emitter and receiver or as continuous wave (CW) Doppler when two transducers act simultaneously, one as emitter and one as receiver. The former allows interrogation of a distinct area of interest (i.e., a stenotic valve) but can be used up to a certain velocity only (Nyquist limit), beyond which the signal becomes turbulent. The latter allows accurate display of high velocities but cannot reliably locate the site of flow acceleration.
8 GETTING READY FOR THE STUDY
FIG. 1.4. Spectral Doppler display. a Pulsed wave (PW) imaging of a normal mitral inflow with the rapid filling (E) and atrial filling (A) components. The flow is laminar and the low velocities are fully displayed and uniformly distributed within a narrow envelope (thin arrows). The systole is filled by the flow of existent mitral regurgitation (thick arrows), which due to high velocities cannot be resolved by the PW mode and is aliasing above and below the isoelectric line. b Continuous wave (CW) imaging of a high velocity, turbulent mitral regurgitation flow. In this case, color display was used for optimal positioning of the CW line within an eccentric jet. Note
1.5 BLOOD FLOW DOPPLER IMEGING 9
•Use PW to assess low velocity flow patterns and to pinpoint the site of flow acceleration.
•Use CW to display high velocity flows.
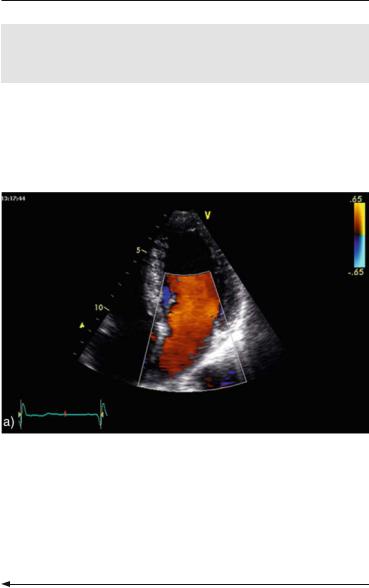
1.5.2Color Doppler (Fig. 1.5)
This is essentially a PW modality where color-coded pixels are displayed instead of a waveform, whenever blood motion is detected. By convention, red encodes flow toward the transducer and blue encodes flow away from the transducer. Since Nyquist limit applies,
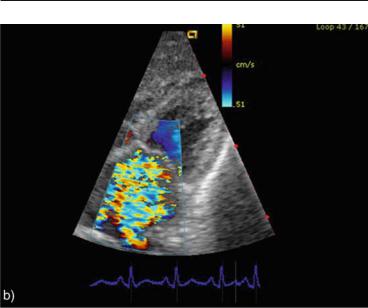
FIG. 1.5. Color Doppler imaging. a Transmitral normal diastolic flow. The smooth red color indicates laminar, low velocity flow below the upper limit of the color Nyquist scale in the right upper part of the image. b Transmitral systolic flow in a case of severe mitral regurgitation. The color display gives an overall image of the flow distribution and the mosaic appearance reflects the high velocity, turbulent jet. The Nyquist limits are –65 cm/s to +65 cm/s in the panel (a) and –51 cm/s to +51 cm/s in the panel (b).
FIG. 1.4. (continued) that the systolic velocities are filling the whole signal spectrum, indicating the high variance typical of a turbulent jet. The high velocity flow is fully resolved by the CW mode, without aliasing. The scale (–0.8 m/s to +0.8 m/s in the upper panel and –7 m/s to +2 m/s in the lower panel) and the position of the 0 line should be adjusted for optimal display to accommodate the velocities recorded.
10 GETTING READY FOR THE STUDY
FIG. 1.5. (continued)
high velocity turbulent flows appear as a mosaic of colors. Color Doppler is used to visually map abnormal flows and provides a generally reliable assessment of their location and extent.
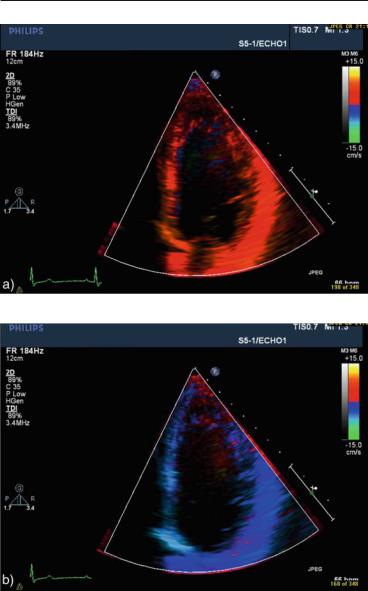
1.6 TISSUE DOPPLER (TD) IMAGING
Using a different filtering algorithm, the same physical principle as in flow Doppler is applied to the higher amplitude, lower velocity signals generated by cardiac walls motion during the cardiac cycle, allowing for the analysis of both systolic and diastolic events. As for flow Doppler, TD can be used as a color map superimposed over the 2D image (Fig. 1.6) or as a spectral PW modality to provide a waveform display of the direction and velocity of wall motion (Fig. 1.7). The color mapping can be used at a later time for offline analysis with the help of dedicated software while PW TD provides online velocity readings at the time of the study. The waveforms obtained by the two modalities are similar, though the velocities readings with software analysis of the color map are lower than those measured directly with PW. TD is used mainly to characterize systolic and diastolic function and to guide cardiac resynchronization therapy with biventricular pacing.
1.6 TISSUE DOPPLER (TD) IMAGING 11
FIG. 1.6. Color tissue Doppler map superimposed over a two-dimensional image in apical 4-chamber view of a patient with normal systolic function. a Systolic frame: all segments are red-encoded, showing motion toward the apex. b Diastolic frame: all segments are blue-encoded, showing motion away from the apex.
12 GETTING READY FOR THE STUDY
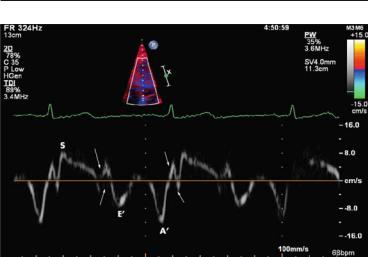
FIG. 1.7. Typical pulsed wave tissue Doppler tracing. The sample volume is placed at the septal aspect of the mitral annulus. In systole, the mitral valve plane moves toward the apex, producing a positive wave (S). In diastole, the motion is in the opposite direction and mirrors the ventricular filling phases as displayed in flow Doppler echocardiography. S: systolic wave, E¢: early diastolic wave, A¢: atrial diastolic wave. The biphasic components before and after the S wave represent the isovolumic contraction and relaxation phases (arrows).
1.7 CONTRAST ECHOCARDIOGRAPHY WITH TRANSPULMONARY AGENTS
Even with modern transducers, 10–30% of patients will have suboptimal images,2,3 resulting in limited left ventricle (LV) visualization and inaccurate contractility assessment. Contrast echocardiography with left ventricle opacification (LVO) fills the LV cavity with strong echoes, while the myocardium remains black and allows a good delineation of the blood-endocardial border. The motion of LV segments and the degree of systolic thickening are thus well visualized providing a superior qualitative assessment of ventricular contractility and a more reliable calculation of ejection fraction with less interobserver variability. Several echo contrast agents are available (Table 1.1), with different chemical composition and physical properties but all have as common denominator a small size (3–5 µm, i.e., similar to the erythrocytes size) of the echogenic microspheres. This allows them to pass through the pulmonary circulation and reach the left heart after a peripheral
1.7CONTRAST ECHOCARDIOGRAPHY 13
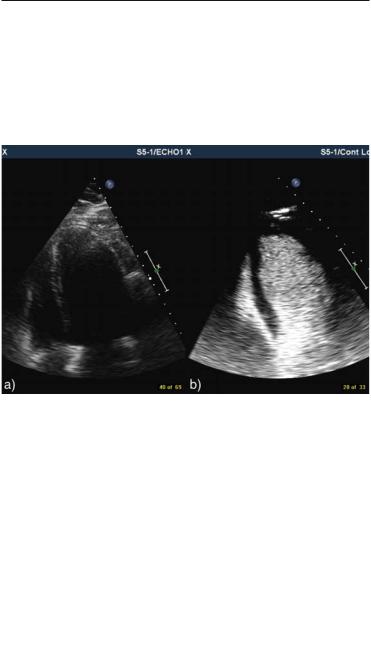
vein administration. The microspheres resonate when exposed to the ultrasound waves and generate strong echo signals, providing a good endocardial-blood demarcation even in difficult subjects (Fig. 1.8).
Imaging with contrast agents requires a low mechanical index of 0.3–0.7 (as opposed to 1–1.5 during usual examination) to avoid quick destruction of the microspheres. This can be achieved either
FIG. 1.8. Side-by-side comparison of images obtained in an apical 4-cham- ber view in a patient with a poor apical acoustic window. a Second harmonic imaging without contrast. Note poor delineation of the basal septum and lateral wall segments and the near-field artifacts in the apical area. b Contrast used with a left ventricular opacification protocol. There is excellent demarcation of the blood-endocardium interface allowing good quantification of left ventricle size and function.
TABLE 1.1. Commonly available contrast agents for echocardiography.
|
|
|
Type (microsphere wall/ |
Generation |
Manufacturer |
Name |
contained gas) |
1 |
Malinckrodt |
Albunex |
Albumin/air |
1 |
Schering |
Levovist |
Lipid/air |
2 |
Malinckrodt |
Optison |
Albumin/perfluoropropane |
2 |
Bracco |
SonoVue |
Phospholipid/sulphur |
|
|
|
hexafluoride |
2 |
DuPont |
Definity |
Liposome/perfluoropropane |
|
|
|
|