

Лекция Неотл ЭХОКГ / Emergency Echocardiography
.pdf158 APPENDIX B
Using a sweep speed of 100 mm/s to improve measurements accuracy, the points of 1 and 3 m/s velocities (corresponding to a rise in pressure from 4 to 36 mmHg) are marked on the CW Doppler signal of MR in apical 4-chamber view and the time ( t) between the two is measured.
LV dp/dt is calculated as
•dp/dt= 32/ t
Diagnostic values:
•Normal contractility: >1,200 mmHg/s
References
1. Lang RM, Bierig M, Devereux RB, et al. Recommendations for chamber quantification: a report from the American Society of Echocardiography’s Guidelines and Standards Committee and the Chamber Quantification Writing Group, developed in conjunction with the European Association of Echocardiography, a branch of the European Society of Cardiology. J Am Soc Echocardiogr 2005;18:1440–1463.

Appendix C
Echocardiographic Assessment and Reporting of Left Ventricular Diastolic function
The echocardiographic assessment of diastolic dysfunction is similar to that of the filling status as detailed in Sect. 3.3. The difference is that the former is presumed to reflect the way in which the left ventricular (LV) copes with diastolic filling under steady, normovolemic conditions, while the latter is a hemodynamic assessment of filling status at the time of hemodynamic instability. If in doubt, the finding of an enlarged left atrium supports a long-standing diastolic dysfunction rather than an acute condition (Table C.1 Fig. C.1).
TABLE C.1. Echocardiographic findings in diastolic dysfunction.
|
|
|
|
Diastolic |
Dysfunction |
||
|
Normal |
Mild |
Moderate |
Severe |
|||
|
DF |
(Grade 1)a |
(Grade 2)b |
(Grade 3)b |
|||
E/A |
>1 |
|
<1 |
≥1 |
|
>>1 |
|
E′ |
≥8 cm/s |
<8 cm/s |
<8 cm/s |
|
<8 cm/s |
||
E/E′ |
<8–10 |
|
|
>10–15 |
|
>15 |
|
Echocardiographic |
Normal |
Abnormal |
Pseudonormal |
Restrictive |
|||
pattern |
|
|
relaxation |
|
|
|
|
Hemodynamic significance |
|
|
|
|
|
|
|
• Relaxation |
Normal |
|
↓ |
↓ |
|
↓ |
|
• Ventricular com- |
Normal |
Normal |
↓ |
|
↓↓ |
||
pliance |
|
|
|
|
|
|
|
• Filling pressures |
Normal |
Normal |
↑ |
|
↑↑ |
||
aMay be normal |
for age as |
|
isolated finding in |
an elderly subject |
|||
bPW Doppler assessment not reliable with severe MR
159
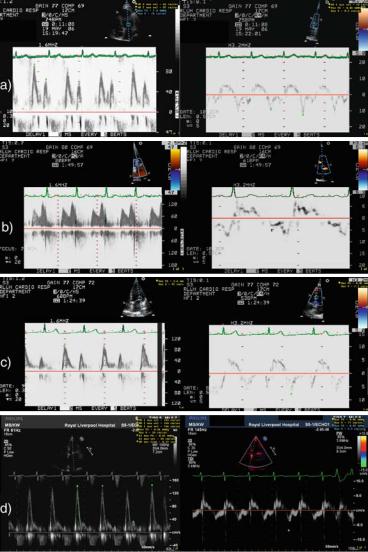
FIG. C.1. Flow and tissue Doppler imaging in the assessment of diastolic function. a Normal subject: E/A = 1.43, E′ = 13 cm/s, E/E′ = 7.3. b Elderly patient with mild (grade 1) diastolic dysfunction: E/A = 0.8, E′ = 3. c Hypertensive patient with exertional dyspnea, normal coronary arteries, and LVEDP = 17 mm at catheterization. Echocardiography shows moderate (grade 2) diastolic dysfunction consistent with elevated diastolic pressures: E = 95 cm/s, E′ = 7.7 cm/s, E/E′ = 12. d Patient with severely decreased systolic function and dyspnea at rest. Echocardiography shows severe, restrictive (grade 3) diastolic dysfunction: E/A = 4.6, DT = 120 ms, E′ = 5.5, E/E′ = 26.

Appendix D
Valvular Regurgitation Quantification
Principles
The true hemodynamic significance of valvular regurgitation is ideally given by the regurgitant volume and the regurgitant fraction (RF = regurgitant volume/EDV - ESV). Severe regurgitation is defined as:
•regurgitant volume ³ 60 ml/beat
•RF ³ 50%
These volumetric calculations are available by Doppler echocardiography, but in practice regurgitation is assessed using either surrogates related to jet size by color Doppler or a calculated effective regurgitant orifice area (EROA). The main approaches for valvular regurgitation assessment are presented below and the generally accepted cut-off values are summarized in Tables D.1 and D.2.1 For a more detailed and in-depth discussion of this topic, the reader should consult the relevant chapters in general echocardiography textbooks and valvular heart diseases management guidelines.
•Jet size versus receiving chamber size measurements
°For mitral regurgitation (MR)
■Maximal regurgitant jet area/left atrium (LA) area ratio in any parasternal or apical view
°For aortic regurgitation (AR)
■Regurgitant jet width (RJW)/left ventricular out-flow tract (LVOT) diameter ratio (RJW/LVOT diameter) in parasternal long axis view
161

162 APPENDIX D
•Jet size at its emergence from the regurgitant orifice, vena contracta (VC)
°For both MR (in parasternal long-axis view or apical views except apical two-chamber view) and AR (in parasternal or apical long-axis view)
•EROA using the proximal isovelocity surface area (PISA) (Fig. D.1)
This is a volumetric approach based on the assumption that the flow converging toward the valve on its ventricular side equals the amount going through the regurgitant orifice. The amount of blood converging toward the valve is the volume of a hemisphere defined by the plane of the valve and the aliasing boundary and which moves with a velocity equal to the Nyquist limit for that study. The EROA is given by the built-in software of the echocardiographic machine or it can be calculated as
EROA (cm2) = 2p r2 × Va/Vmax where r is the radius of the sphere from the valve plane to the aliasing zone, Va is the Nyquist
limit, and Vmax is the peak velocity of the regurgitant flow by CW Doppler.
Besides the methods described above, ancillary findings have to be actively sought when significant regurgitation is suspected. These are not absolute criteria but are helpful in borderline cases.
For MR:
•LV and LA enlargement
•Hyperdynamic LV
•E/A > 1 with E > 1.2 m/s in the absence of mitral stenosis
For AR:
•LV and LA enlargement
•Short pressure half-time
•Flow reversal in descending aorta
TABLE D.1. Cut-off values for MR severity.
|
MR jet area/ |
|
|
|
|
LA area |
Vena contracta |
EROAa |
Ancillary findings |
Mild |
<20% |
<0.3 cm |
<0.2 cm2 |
|
Severe |
>40% |
>0.7 cm |
>0.4 cm2 |
E > 1.2 m/s |
aA PISA radius of ³0.9 cm at a Nyquist limit of 40 cm/s is indicative of severe MR. EROA effective regurgitant orifice area, LA left atrium
|
|
|
|
|
APPENDIX D 163 |
Table D.2. Cut-off values for AR severity. |
|
|
|||
|
|
|
|
|
|
|
AR jet width/ |
Vena con- |
|
|
|
|
LVOT width |
tracta |
EROAa |
Ancillary findings |
|
Mild |
<20% |
<0.3 cm |
<0.2 cm2 |
P½T |
> 500 ms |
Severe |
>65% |
>0.6 cm |
>0.3 cm2 |
P½T |
< 200 msa |
Holodiastolic flow reversal in descending aorta
aA short P½T is reliable only if there are no other causes of increased LV stiffness such as ischemic damage
LVOT left ventricular outflow tract, P½T pressure half time
The overall assessment of regurgitant lesions should take into account more than one technique and ancillary and supportive findings as well. Jet size criteria are not accurate for very eccentric, “against the wall” jets which are assumed to be more severe than they look. Regurgitations with indices falling between the “mild” and “severe” qualifications are considered moderate
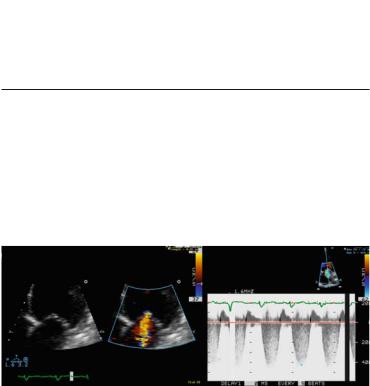
FIG. D.1 Use of PISA method in a patient with mitral regurgitation. a): The aliasing (Nyquist) limit for velocities away from the transducer is lowered to expand the convergence area and the mitral valve and the proximal regurgitant jet are zoomed-in using the apical 4-chamber view. The radius of the convergence hemisphere is measured (green dots) from the leaflets level to the aliasing boundary (bright yellow-blue interface). b): The peak velocity of the regurgitant jet is obtained with CW Doppler. (See text for calculations) PISA: proximal isovelocity surface area
CAVEATS IN THE ECHOCARDIOGRAPHIC ASSESSMENT OF VALVULAR REGURGITATION
•The color-flow display of the regurgitant jet is sensitive to the imaging settings. High gains or a low Nyquist limit can significantly increase the jet area and its turbulence pattern.

164 APPENDIX D
°Use standard settings with a Nyquist limit of 50–60 cm/s (except for PISA calculation when it should be lowered to 40 cm/s).
°When comparing two studies for follow-up purposes, ensure that both studies were performed using same or similar settings.
•Regurgitations can vary significantly with hemodynamic changes such as blood pressure, volemic status, and ventricular contractility. This may become an issue during acute or follow-up studies in the following circumstances:
°Successful diuresis and achieving normovolemic status
°Patients on dialysis who have significant volume shifts
°With improving ventricular contractility
°During transesophageal echocardiography (TEE) when blood pressure (BP) can either significantly increase due to anxiety or decrease with use of intravenous sedation (record BP during the study)
References
1. Vahanian A, Baumgartner H, Bax J et al. Guidelines on the management of valvular heart disease: The Task Force on the Management of Valvular Heart Disease of the European Society of Cardiology. Eur Heart J. 2007;28(2):230-268.

Appendix E
Valvular Stenosis Quantification
Principles1
The severity of a valvular stenosis is assessed by:
•Mean transvalvular gradient (mmHg)
°Obtained with:
Spectral CW Doppler
°Advantages:
Easy to obtain
Generally good correlation with stenosis severity
°Disadvantages/precautions:
Influenced by the hemodynamics at the time of the study
-Volume status
-Heart rate
-Left ventricular (LV) contractility
•Stenotic orifice area (cm2)
°Obtained with:
Direct planimetry
Doppler calculations*
– For aortic stenosis (AS): continuity equation
– For mitral stenosis (MS): pressure half-time method
*For the scope of this book, only widely used methods are mentioned.
165

166 APPENDIX E
TABLE E.1. Cut-off values for MS severity.
|
Mean gradient (mmHg)a |
MVA (cm2)b |
Mild |
2–4 |
>2 |
Moderate |
4–9 |
1–2 |
Severe |
>10–15 |
<1 |
|
|
|
aIn the absence of tachycardia or bradycardia, which can significantly increase or decrease, respectively, the measured gradient
bMVA is either measured by direct planimetry or derived using the pressure half-time method. The two methods are complimentary but planimetry, if
feasible is preferable. Pressure half-time is not accurate with: · mild MS
· >mild AR
· altered LV compliance, for example, LVH · recent mitral valvotomy
MS: mitral stenosis
MVA: mitral valve area
Table E.2. Cut-off values for AS severity.
|
Mean gradient (mmHg) |
AVA (cm2)a |
Mild |
|
>1.5 |
Moderate |
|
1–1.5 |
Severe |
>50b |
<1 |
aAssuming average body-size. For largeor small-bodied individuals, the AVA should be indexed to BSA, with a cut-off value of 0.6 cm2/m2 BSA for severe AS
bAssuming normal LV contractility and cardiac output
AS: aortic stenosis
AVA: aortic valve area
Formally, valvular stenosis severity is graded using the valve area (Tables E.1 and E.2)1.
References
1. Vahanian A., Baumgartner H, Bax J et al. Guidelines on the management of valvular heart disease: The Task Force on the Management of Valvular Heart Disease of the European Society of Cardiology. Eur Heart J 2007;28(2):230–268

Appendix F
Normal Ranges for Usual Echocardiographic Measurements in Adults
The values given in Table F.1 below represent a consensus of the American and European associations of echocardiography.1 Different national bodies may adopt slightly different values.2 Each echocardiography service needs to adopt its own standards, based on national or international recommendations and local practice.
TABLE F.1. Standard dimensions and flow velocity measurements and normal values.1,2
|
2D/M mode |
Measurementsa |
|
Not-indexed |
BSA indexed (/m2 BSA)b |
LVDd (cm) |
3.9–5.9 |
2.4–3.1 |
Fractional shortening (%) |
27–45 |
|
IVSd (cm) |
0.6–1 |
|
LVPWd (cm) |
0.6–1 |
|
RVOT (cm) |
2.5–2.9 |
|
RV free wall thickness (cm) |
0.5 |
|
LA diameter (cm) |
2.7–4 |
1.5–2.3 |
LA area (cm2) |
<20 |
|
LA volume (ml) |
22–58 |
<29 |
|
|
|
(continued)
167