

Thermal Analysis of Polymeric Materials
.pdf3.1 Stepwise and Step Reactions |
197 |
___________________________________________________________________
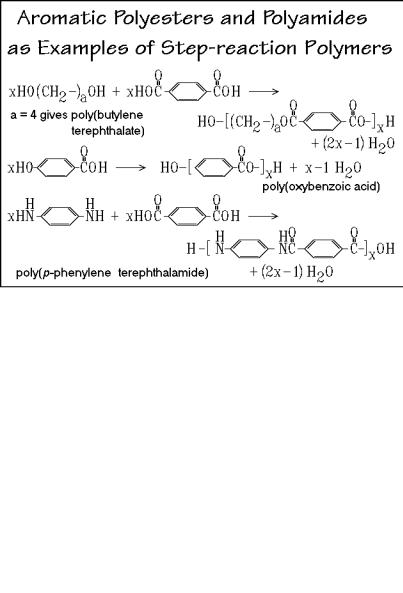
flexibility are relatively low melting temperatures, such as 356.2 K for poly(ethylene sebacate) and 342.2 K for polycaprolactone. Because of the ease of making such polyesters, they were among the first polymers studied. The structurally similar aliphatic polyamides in Fig. 3.10, were the first fully synthetic fibers (nylons, originally trade name of du Pont de Nemours and Co., 19381). Their greater utility, compared to the polyesters, lies in their higher melting temperatures when compared to the corresponding polyesters (574 K for nylon 6.6 and 533 K for nylon 6).
Fig. 3.10
The reaction for the A B monomer starts with a ring-opening, using one molecule of water. This is to be followed by the step-reaction condensation with loss of one water, so that over the full polymerization only one water per molecule is added, as shown. Caprolactam, however, polymerizes better directly in a chain reaction after being initiated with HCl, i.e., it should then be discussed in Sect. 3.2.
The aromatic polymers in Fig. 3.11 are less flexible than their aliphatic counterparts due to the rigid phenylene groups. Increases in Tm are the result (see Sect. 5.4). Poly(p-phenylene terephthalate) (Kevlar®) is a high-strength material. The polycarbonates, polyureas, and polyurethanes in Fig. 3.12 round out this group of step-growth polymers. As before, aliphatic and aromatic segments can be included in the structures of monomers to tailor-make polymers of proper flexibility and strength.
A special step polymerization involves an acyclic diene methathesis polymerization, ADMET [12]. A diene, CH2=CH( CH2)n CH=CH2, sets up a condensation equilibrium, evolving ethylene in the presence of an ADMET catalyst and allows polymerization. Substituted dienes can produce precisely branched polymers [13].
1 Wallace Hume Carothers, 1896–1937. American chemist who developed nylon, the first synthetic macromolecular fiber at the du Pont de Nemours & Company in Wilmington, DE.
198 3 Dynamics of Chemical and Phase Changes
___________________________________________________________________
Fig. 3.11
Fig. 3.12
3.1.4 Conditions
The conditions for step-growth polymerization are summarized in Fig. 3.13. The much more stringent conditions than customary in general organic syntheses that must be satisfied to produce macromolecules are listed as points a to d. Limits to the molar mass are not only set by incomplete polymerization reactions, as expressed by the

3.1 Stepwise and Step Reactions |
199 |
___________________________________________________________________
Fig. 3.13
fractional completion, p, or the degree of polymerization, DP, but can also be set by inexact equivalence of the numbers of A A and B B molecules, impurities with only one active chain end, side reactions, and ring formation. Next, Fig. 3.13 shows the change in the degree of polymerization on deviation from equivalence of A- and B- groups (for equivalence Na/Nb = r = 1.000). From the example given, it is clear that 99% purity and reaction to completion (p = 1.00) are needed for the production of macromolecules of acceptable size. Another limiting effect is the influence of impurities that can prevent molecules from further growth. The result is obviously similar to the nonequivalence of A and B. One mol % of impurity cuts the DP in half under the given conditions. The addition of a controlled amount of impurity, coupled with reaction conditions that fix p (usually close to 1.0) can be used in industrial polymerizations to control the overall molar mass.
Strain-free, small rings, such as caprolactam or caprolactone, have a high rate constant, k1, for their formation. On equilibration with the chain reaction, they lead to a fixed ratio of rings to chains, R, as is shown at the bottom of Fig. 3.13:
k [M]
n H2N (CH2 )a 1CO OH 1 n O=C (CH2)a 1NH + n H2O
k [M]2
n H2N (CH2 )a 1CO OH 2 H [NH (CH2 )a 1CO]n OH + (n 1)H2O
High rates of polymer formation call for a high monomer concentration [M] to favor initially the intermolecular reaction, written at the bottom, over the top cyclization reaction. As will is shown in the next section, the intramolecular cyclization is a reaction of first order, while a typical ester or amide formation, under the given conditions, is of second or third order.
200 3 Dynamics of Chemical and Phase Changes
___________________________________________________________________
3.1.5 Reaction Rates
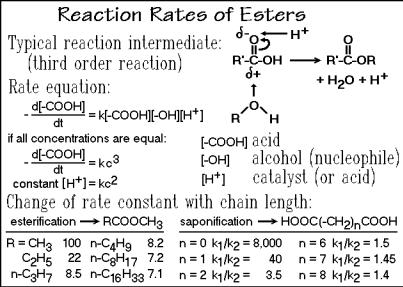
The reaction mechanisms and rates involved in polymerizations and their temperature dependence are similar to reactions involved in small-molecule dynamics which are briefly reviewed in Appendix 7, Fig. A.7.1. Figure 3.14 represents an example of a reaction that involves a third-order mechanism, an esterification:
R' COOH + HO R + H+ [Intermediate] R' CO R + H2O + H+
where R' can be the continuing polymer chain and R the to be added monomer. The reaction intermediate can be seen in the figure. The forward reaction leads to the connection of the two reactants (polymerization), while the reverse reaction (saponification) would be involved in a depolymerization. The same basic reaction is also discussed in Sect. 3.4 in connection with the treatment of transesterification, a reaction that can change the structure of once polymerized macromolecules.
The rate expression takes into account that three parts that must come together to form the reaction intermediate, the alcohol, acid, and catalyst (H+ in the chosen case). The evaluation of the reaction rate is particularly simple if all reactants are present at equal concentration, c. Since the [ A] and [ B] concentrations in step reaction polymerizations are always closely equal, and [H+] may be kept constant by fixing its concentration, the pH, the reaction can also be analyzed as a second-order process as also shown in Fig. 3.14. These expressions will be used in Sect. 3.1.6 for the description of the LiH2PO4 polymerization.
The left and right tables at the bottom of Fig. 3.14 list the changes of the rate constants with chain length for esterification and saponification, respectively. Only if structural changes are made less than 3 5 atoms from the reactive site, does one find significant changes in the rate constants of the esterification. The methyl alcohol rate
Fig. 3.14

3.1 Stepwise and Step Reactions |
201 |
___________________________________________________________________
constant is normalized to 100. In most cases the monomers are, however, already long enough that one or two rate constants are sufficient to model the overall polymerization. A similar result is seen for the saponification to the diacid. The ratio k1/k2 signifies the rate of losing the first and second ester group.
Figure 3.15 summarizes the energetics of the reaction. Of importance is the higher potential energy reached by the activated state which is one key factor in the determination of the reaction rate via its activation energy Ea.
Fig. 3.15
3.1.6 Lithium Phosphate Polymerization
The step-growth polymerization of dibasic lithium phosphate is discussed next as an example of a polymerization reaction followed by immediate crystallization to the polymer, studied largely by thermal analysis [14,15]. It illustrates that not only organic molecules can be flexible macromolecules, but also inorganic ones. The two major techniques used for the analysis are differential scanning calorimetry (DSC, see Sect. 4.3) and thermogravimetry (TGA, see Sect. 4.6). The reaction equation is:
LiH2PO4 LiPO3 + H2O .
The reaction product, the polymeric phosphate (formerly called metaphosphate) has a high melt viscosity, as expected for a polymer. The step-reaction polymerization becomes clearer when following the fate of the dihydrogen phosphate ion:
O |
O |
|
|
x HO –P – OH |
HO–[P – O–]xH + (x 1) H2O . |
|
|
O |
O |
202 3 Dynamics of Chemical and Phase Changes
___________________________________________________________________
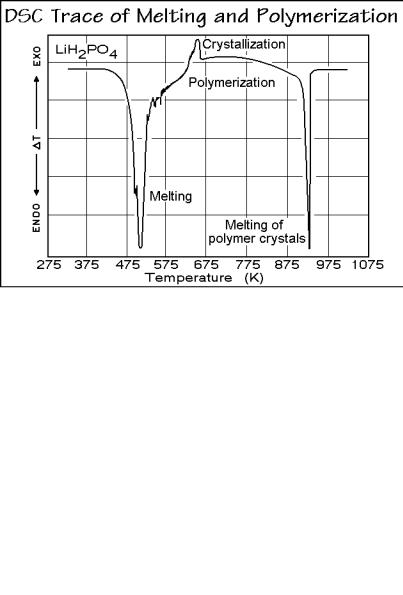
The DSC heating-trace in Fig. 3.16 shows several complications during the nonisothermal reaction. First, there is the melting endotherm of the LiH2PO4 monomer, beginning at about 470 K ( T in the endothermic direction is proportional to the consumed heat to raise temperature). In addition to the fusion, other endothermic effects are due to the evaporation of water evolved in the chemical reaction. The TGA trace of Fig. 3.17 registers the changes in mass, and records quantitatively the
Fig. 3.16
Fig. 3.17

3.1 Stepwise and Step Reactions |
203 |
___________________________________________________________________
progress of the chemical reaction. The initial moisture loss, shown in Fig. 3.17 can be removed by drying the monomer before the heating. The small exotherm in 3.16 comes from crystallization, and the final endotherm, at about 900 K, indicates melting of the polymer, LiPO3. The TGA trace of Fig. 3.17 indicates that after the moisture loss the reaction proceeds in two stages, and is followed by slow annealing (crystal perfection). This process is clarified with an isothermal TGA run at 573 K of a dried monomer of sufficient quality to establish the kinetics of the polymerization. Figure 3.18 is the result and is of sufficient quality to establish the reaction kinetics.
Fig. 3.18
As is typical for step-growth polymerizations, each molecule in the reaction mixture has two reactive OH groups, and for each H2O molecule lost, one bond is formed. Furthermore, [H+] is also proportional to [ OH] if no external acid is added. In Fig. 3.19 a kinetics is assumed, similar to the just discussed third-order esterification (n = 3). This assumption is next shown to fit the measured data. Writing for the concentration [POH] = [POH]o(1 p), where [POH]o is the initial concentration (= 2Mo) and p the fractional progress of the polymerizarion, one can see that the rate of polymerization dp/dt = k[POH]o2(1 p)3. The connection to the boxed equation is given by k' = k[POH]o2. Also, written is the temperature-dependence of k' as described in Fig. A.7.2.
Since the TGA-trace in Fig. 3.18 indicates that the fast reaction is complete at p = 0.5, one expects that the rate constant ka for the formation of a dimer is larger than kb for further polymerization as suggested in the summary at the bottom of Fig. 3.14. Assuming that only the monomer-to-dimer rate is faster than the rest of the polymerization, a full set of kinetic equations as indicated in Fig. 3.20 can be solved. The monomer concentration decreases due to the formation of dimers (with a rate constant ka) and all other species that react need the rate constant kb. Analogously other

204 3 Dynamics of Chemical and Phase Changes
___________________________________________________________________
Fig. 3.19
equations can be written for any oligomer of mass Mx, as shown. Concentration [M2], for example, increases when two monomers react with rate constant ka, and decreases for any other species reacting with the dimer M2.
The reaction equations of Fig. 3.20 were written for oligomer lengths of up to 30 repeating units and then fitted to the thermogravimetry experiment shown in Fig. 3.18. The reverse reactions, the depolymerizations, were neglected, which is permissible in
Fig. 3.20

3.1 Stepwise and Step Reactions |
205 |
___________________________________________________________________
the initial stages of the reaction. The experimental data from the best fits at the early reaction times are shown at the bottom of Fig. 3.20. As expected, the rate constant ka is much larger than the rate constant kb. As the reaction starts, almost only the dimer is formed. In fact, in similar reactions of the sodium salt, NaH2PO4, it is possible to cause a sufficient build-up of the concentration of the dimer that it crystallizes and slows the reaction further.
Figure 3.21 illustrates the changes of the concentrations of the species with time for the experimental data with the faster monomer reactivity. The line 4 combines tetramers and larger molecules. The concentration of every species, except the monomer, has a maximum which shifts to later times for longer molecules. As before, ring-formation has been neglected to make the kinetics manageable.
The progress of the reaction at 573 K, as evaluated in Fig. 3.20, is shown in Fig. 3.22. Going back to the DSC-trace in Fig. 3.16 a complication arises indicated by the crystallization exotherm. After about 800 s, oligomers start to crystallize. The volume fraction of the crystallized polymer is given by vc as measured by optical microscopy. The two phases which are now present consist of pure polymerized phosphate and the homogeneous melt with concentrations as suggested in Fig. 3.21. As the crystallization progresses, the higher oligomers and polymers are increasingly extracted from the melt, i.e., the degree of polymerization decreases below the value p calculated from the homogeneous phase of the reaction. The experimental data, recalculated for the depleted liquid phase ( ), are added in Fig. 3.22 under the assumption that mainly dimers add to the growing macromolecules after they are nucleated in the solid state as oligomers. The data fit perfectly up to about 1,000 s. At times longer than 1,000 s, the reaction seems to reverse. More about the continuing crystallization during polymerization is discussed in Sects. 3.5 and 3.6.
Fig. 3.21

206 3 Dynamics of Chemical and Phase Changes
___________________________________________________________________
Fig. 3.22
3.2 Chain and Matrix Reactions
3.2.1 Mechanism of Chain Reactions
Chain-growth polymerization is the other important polymerization process besides the step reactions, discussed in Sect. 3.1. The condition for the reaction is given in Fig. 3.23. The mechanism of the reaction involves a small number of active molecules, M•. Only these active molecules support further polymerization of the monomers, A. The chemical composition is maintained by a continued chain of the same reactions of A with M•. The illustration of the mechanism refers to a free radical polymerization. Initiation, propagation, and termination are the three stages of the reaction.
The initiator, I I, is homolytically broken into two free radicals by either absorption of a photon, h , or by collision with another molecule, B*. In either case there must be sufficient energy to break the center bond of the initiator. Once formed, each free radical, written as I•, can start a polymerization reaction by adding monomer molecules. The first step leads to the free radical monomer, I A•, also written as M1•. The next step of the reaction produces a free radical called M2•. Each step of the chain reaction has up to this point its own specific rate constant. Addition of further monomers goes, however, substantially with the same rate, so that one can write during the main growth period of the molecule for each step the fourth reaction equation in Fig. 3.23, where x is the degree of polymerization. Ultimately, the reaction may be stopped by a termination reaction of the chain. The example of the termination reaction shown is a combination of two free radicals. The special case for