

Thermal Analysis of Polymeric Materials
.pdf3.5 Crystal and Molecular Nucleation Kinetics |
247 |
___________________________________________________________________
Fig. 3.64
(Gk.(, on, upon; and )'&, order, arrangement) is generally applied to oriented growth of one crystalline substance on another. Because of the long-chain nature of linear macromolecules, the initial adsorption of the polymer occurs such, that the chain axis lies in the surface. Even a limited matching of the structure of the substrate can than lead to the growth of well-aligned crystals, as seen in Fig. 3.65. The poly(oxymethylene) chains are oriented as shown by the arrow in the figure, along the
Fig. 3.65
248 3 Dynamics of Chemical and Phase Changes
___________________________________________________________________
direction [110] of the equally-charged ions, Na+ and Cl . Both of these experiments illustrate possible mechanisms of heterogeneous nucleations that need to be investigated for the evaluation of the nucleation kinetics.
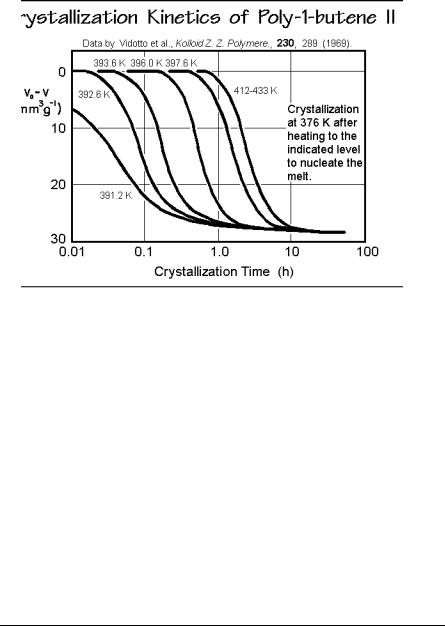
The quantitative influence of self-nucleation is shown in Fig. 3.66 for the case of crystallization of poly-1-butene with crystal form II when followed by dilatometry.
Fig. 3.66
Various amounts of self-nuclei were produced by heating the samples above the melting point. All self-nuclei are destroyed only above 402 K, and the constant crystallization kinetics is established with the remaining foreign nuclei. Table 3.4 contains a list of the crystallization peak temperatures by DSC on cooling of
Table 3.4. Crystallization peak temperatures of seeded polypropylene by DSC.
___________________________________________________________________
Seed Material: |
Cryst. Peak (K): |
Seed Material: |
Cryst. Peak (K) |
___________________________________________________________________ |
|||
No seed |
379 |
Ca(benzoate)2 |
389 |
AgNO3 |
380 |
Na m-benzoate |
391 |
Pb(benzoate)2 |
381 |
Na caproate |
391 |
Na 1-naphthoate |
381 |
Na o-methylbenzoate |
392 |
Na2SO4 |
383 |
Ba(benzoate)2 |
394 |
Al2O3 |
384 |
Na p-hydroxylbenzoate |
395 |
Na m-benzoate |
384 |
Li benzoate |
398 |
Na acetate |
385 |
Na2 1,2-cyclohexane |
|
Na formate |
386 |
dicarboxylate |
401 |
Pyrex glass |
386 |
Na cyclohexane |
|
Na octanate |
386 |
carboxylate |
403 |
Na nitrobenzoate |
387 |
Na benzoate |
404 |
Na2 oxalate |
388 |
Na p-methylbenzoate |
405 |
3.5 Crystal and Molecular Nucleation Kinetics |
249 |
___________________________________________________________________
polypropylene at 12.5 K min 1 when adding different seed materials (0.25%, milled at 423 K for 5 min). With such experiments large numbers of heterogeneous nucleating agents can be quickly assessed.
3.5.5 Secondary Nucleation
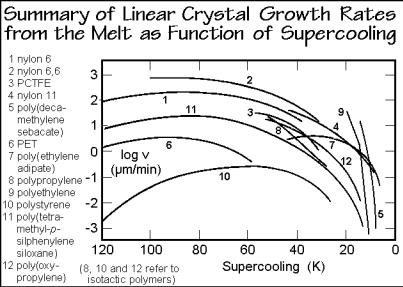
Experimental data on melt crystallization are summarized in Fig. 3.67 in form of the linear crystal growth rate, v. All linear crystal growth rates go exponentially to zero when the temperature approaches the melting temperature, pointing to a nucleation which is similar as developed in the Figs. 3.51–61. These experiments, thus, provide strong evidence that some kind of secondary nucleation must be found to account for the crystal growth of macromolecules [27].
Fig. 3.67
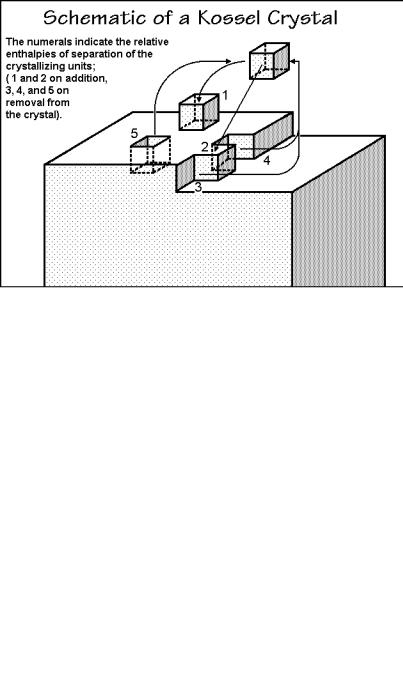
For crystallization of small molecules, one can easily expand the mathematical description of primary nucleation to secondary nucleation by making use of the socalled Kossel crystal, shown in Fig. 3.68. Addition or removal of a crystallizing motif (assumed to be a cube) on different positions on the crystals gives different enthalpy contributions. During this process, however, surface area has also been removed or newly created. Only position “3” creates as much surface area of the crystal as it removes and has no surface contribution. Addition to positions 1 and 2 increases the surface area by 5 and 4 units, respectively, and thus leads to nucleation barriers. Addition to 4 and 5 decreases the surface area by 2 and 1 unit, respectively. These positions are quickly filled because of the decrease in surface area and yield a molecularly smooth surface. For secondary nucleation one assumes that growth continues with a given rate as long as positions of type 3 are available. Additional growth must then be nucleated by creating growth at a number of positions like 1 and
250 3 Dynamics of Chemical and Phase Changes
___________________________________________________________________
Fig. 3.68
2 on one of the smooth surfaces before the next layer can be grown. The linear crystal growth rate is given by the number of new layers nucleated per second.
Although this model does not fit well for macromolecules since it neglects the interconnection between the crystallizable units along the molecule, it has been used to develop nucleation models as shown in Fig. 3.69. As soon as a ledge is created on the surface, growth is assumed to occur by adding new molecular segments (stems)
Fig. 3.69
3.5 Crystal and Molecular Nucleation Kinetics |
251 |
___________________________________________________________________
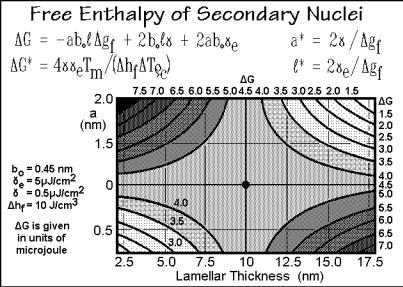
without a further nucleation barrier. On a smooth growth surface, the free energy for formation of such a ledge is given by the equation at the bottom of Fig. 3.69. The possible differences between the fringed micellar and chain-folded chain conformations of Sect. 5.2 need to be taken into account by different surface free energies, e.
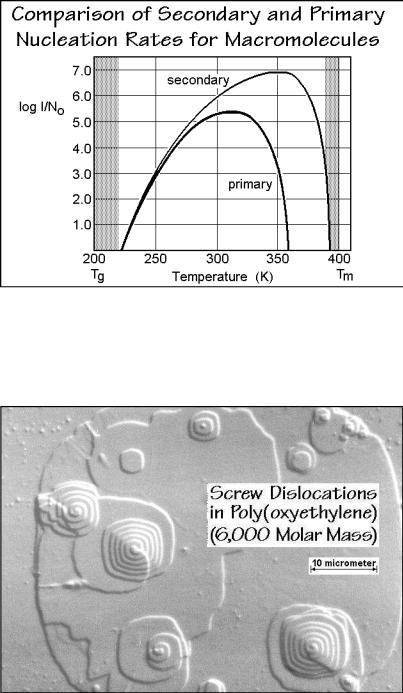
Figure 3.70 shows the derivation of the equations needed to describe such secondary nucleation, along the same path as the equations for primary nucleation in Figs. 3.59–60. As for primary nucleation in Fig. 3.60, the system starts at the lower
Fig. 3.70
left corner in the free-enthalpy graph and must cross the saddle point to reach the negative free enthalpy for continued growth. Using the same parameters as for the primary nucleation, the barrier to crystal growth due to secondary nucleation is lower, thus the rate of nucleation is higher, as shown in Fig. 3.71. One must consider when going to lower temperatures, that one needs only one primary nucleus per crystal, but very many secondary nuclei. The approach to similar nucleation rates when reaching the glass transition means not only that all nucleation stops at the glass transition, but that at the lower temperature, primary nucleation becomes more effective relative to secondary nucleation. Indeed, one observes faster overall crystallization due to enhanced primary nucleation when heating from the glassy state and crystallizing at low temperature than on cooling from the melt. Such low-temperature crystallization is called cold crystallization.
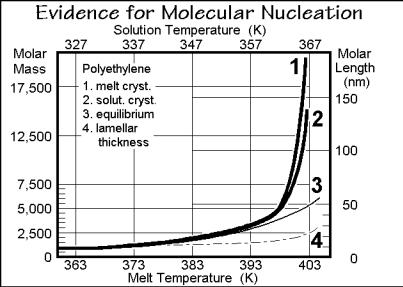
Two final points need to be made about secondary nucleation. First, that screwdislocation defects, described in more detail in Sect. 5.3, produce indestructible secondary nuclei for growth on top of the fold surfaces of polymer lamellae. This surface would otherwise be inactive for further growth and restrict polymer crystals to single lamellae (see Chap. 5). An example of a series of screw dislocations is shown in Fig. 3.72 on the example of poly(oxyethylene) of 6,000 molar mass grown
252 3 Dynamics of Chemical and Phase Changes
___________________________________________________________________
Fig. 3.71
at 332.6 K [28]. These screw dislocations continuously initiate new lamellae at their tops and bottoms without need of nucleation. Their growth, once initiated, should thus avoid the secondary nucleation and cause different linear-crystal-growth kinetics. Experimentally such kinetics, however, was only observed for small molecules.
Next, the rate of completion of a layer on the side surface of a lamella (growth face) and the rate of renewed nucleation seems not in the proper ratio with the simple
Fig. 3.72
3.5 Crystal and Molecular Nucleation Kinetics |
253 |
___________________________________________________________________
models shown to yield smooth surfaces. A rough surface, however, does not need secondary nucleation. Finally, the crystal structure of many polymers, as described in Sect. 5.1, is such that polymer crystal surfaces are inherently rough, causing smaller surface-free energies than assumed. Experiments of nucleation on rough lamellar surfaces have also shown no preference for steps in the surface for nucleation. All these points cast doubt on the usefulness of the concept of secondary nucleation.
Naturally, one can also propose a tertiary nucleation step for starting growth on a smooth ledge as seen at position 2 in Fig. 3.68. Its nucleation barrier would be even smaller than for secondary nucleation and even less likely to slow the crystal growth significantly.
3.5.6 Molecular Nucleation
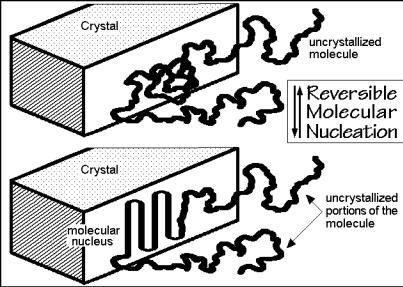
The concept of molecular nucleation was developed to explain some observations not in agreement with the above model of crystallization limited by secondary nucleation [29]. In Fig. 3.73 the molecular length is plotted which is rejected by a crystal growing from the melt or from solution (curves 1 and 2, respectively). These data were obtained by measuring the molar mass of the noncrystallized molecules of a
Fig. 3.73
broad molar mass distribution [30]. The surprise is that this length does not agree with the equilibrium melting temperature given as curve 3 and discussed in more detail in Sect. 7.1.5. A reversible selection of molecular lengths occurs, thus, below the equilibrium melting temperature. This is only possible if a reversible process occurs at this lower temperature. The process with a reversible crossing over a free-enthalpy barrier is assumed to be the molecular nucleation which must occur before a chain can grow onto the crystal surface as shown in Fig. 3.74. The molecular nucleation
254 3 Dynamics of Chemical and Phase Changes
___________________________________________________________________
Fig. 3.74
contrasts crystal nucleation and seems unique for macromolecules. Crystallization of any single repeating unit out of the molecule onto a smooth crystal surface is unlikely since this fixing at a single point would restrict the molecule as a whole, i.e., the decrease in entropy of the molecule cannot be compensated by the heat of crystallization of the single repeating unit. The increase in free enthalpy describing molecular nucleation is similar to the formalism for the secondary nucleation, just that the molecular nucleus is decoupled at the points of junctions to the chain ends which are part of the amorphous phase. A molecule shorter than the critical or supercritical nucleus size can in this case not crystallize, while longer molecules can easily complete the crystallization by decreasing after molecular nucleation the free enthalpy of the molecule with every additional step into the region of stability, similar as shown in the schematic of Fig. 3.60.
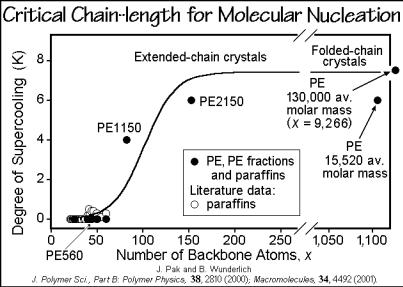
The lower limit of molecular length which needs molecular nucleation on melt crystallization was explored for paraffins and polyethylenes by DSC and TMDSC described in Sects. 4.3 and 4.4. Figure 3.75 illustrates the supercooling necessary for measurable crystallization. The broader molecular mass fractions of polyethylene are marked by labels like PE1150, where the number gives the average molar mass in Da. A critical length of about 75 chain atoms can be derived for polyethylene.
This concludes the discussion of the nucleation dynamics of macromolecules. It shows that the usually assumed constant number of heterogeneous nuclei and linearly increasing number of homogeneous nuclei is a simplification, and secondary nucleation as the basis for crystal growth is a doubtful concept. Finally, molecular nucleation is not a well enough understood concept to quantitatively explain facts such as the molar mass dependence of crystallization. The further work needed to understand the basis of nucleation in polymers is a big challenge for new research in solid-state polymer science.
3.6 Crystallization and Melting Kinetics |
255 |
___________________________________________________________________
Fig. 3.75
3.6 Crystallization and Melting Kinetics
3.6.1 Linear Melting and Crystallization Rates
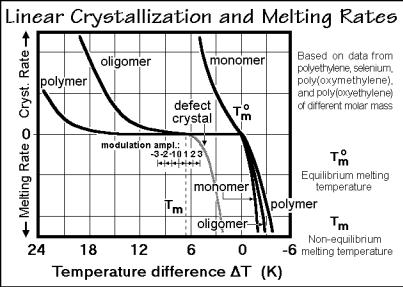
Crystal growth and melting is represented schematically in Fig. 3.76. The effect of primary nucleation, discussed in Sect. 3.5, is eliminated in the experiments by retaining crystals during the analysis. Small molecules, such as monomers, have a slope of the growth rate that does not reach zero on going through the equilibrium melting temperature, Tmo. The slope is determined by the surface roughness or number of screw dislocations which provide secondary nucleation sites (see Sect. 3.5.5) and account for mechanisms, further influenced by crystal geometry. A check of the reversibility seen in Fig. 3.76 can be made with temperature-modulated differential scanning calorimetry, TMDSC. As an example, reversible melting of In is described in Sect. 4.4.7 (Figs. 4.106–109).
The continuity of the change of growth rates at Tmo is interrupted as soon as primary, secondary, or molecular nucleation is necessary. The curves labeled oligomer and polymer in Fig. 3.76 show a region of zero growth rate due to molecular nucleation. Secondary nucleation would produce a smaller hindrance to crystal growth. Despite that there should be no reversible melting for flexible oligomers and macromolecules, TMDSC could show some reversibility based on local equilibria within the global metastable structure. Finally, it is possible to see a reduction of the metastability gap when nonequilibrium crystals of lower melting temperature, Tm, grow on cooling. Specific data will be discussed in Sect. 3.6.7. Also shown in Fig. 3.76 is the magnitude of a typical temperature modulation in TMDSC.
256 3 Dynamics of Chemical and Phase Changes
___________________________________________________________________
Fig. 3.76
This short introduction to possible paths and mechanisms of melting and crystallization indicates how difficult it is to develop a detailed kinetics that links the molecular mechanism to the observed, macroscopic kinetics. Considerable molecular scale information is needed for the interpretation of the macroscopic thermal analysis data. Few data on melting rates are available for polymers, due to the tendency of large crystals to superheat [31], and small crystals to melt very fast.
3.6.2 Directional Dependence of Crystallization
The directional dependence of the crystal shape is sketched in Fig. 3.77. With differences in the linear growth rates, v, in different crystallographic directions, different crystal shapes are produced. The three-dimensional sketch is given for different growth rates along three rectangular crystallographic directions a, b, and c. Assuming that no other growth is possible, the simple tetragonal crystal results. A somewhat more complicated, monoclinic crystal shape is illustrated in the bottom sketch and photograph of the figure for the example of a single crystal of gypsum. More details about the shape or morphology of crystals are given in Sect. 5.2. The linear increase of size with time at right angles to the chain direction is documented in Fig. 3.78 for a folded-chain crystal of polyethylene grown from dilute solution. After about 11 days the crystallization is completed and the final crystal size is reached, determined in this case by the number of nuclei and the total crystallizable material available. The shape, however, is the result of the different rates of growth. In the analyzed case of chain folding, no crystal thickening occurred in the chain direction with the exception of some thickening due to screw-dislocation growth, as seen in Fig. 3.72. For polyethylene crystallization from solution at high temperatures, the growth faces are {110} planes, giving the shape shown in Fig. 5.5.2.