

Thermal Analysis of Polymeric Materials
.pdf3.4 Copolymerization and Reactions of Polymers |
237 |
___________________________________________________________________
the carboxylic acid with NaOH. This example is patterned after the DuPont Surlin® polymer. Properties such as modulus and tensile strength increase with ionic content. At higher ionic content microphase separation may occur, indicated by two glass transitions, one for the matrix phase, the other for the ion-rich phase.
Segmented polyurethanes with nanophase-separated hard and soft segments, linked together after prior partial polymerization, followed by joining of the molecules are summarized as reaction 8 in Fig. 3.53. The initial copolymer (A) is a polyurethane listed in Fig. 3.12, made, for example of poly(oxyethylene) of molar mass 3,000 with x 68, reacted with an excess of 2,4-toluenediisocyanate. This prepolymer is then extended with some ethylene diamine (B) which reacts the remaining diisocyanates with urea bridges. The resulting segmented polyurethane consists of the ureaconnected hard segments (HN–CO–NH–C2H4–HN–CONH–) and the remaining ethylene-oxide soft segments with embedded isolated urethane groups. These segmented polyurethanes are elastomers known for their good abrasion and solvent resistence. As fibers they have high elasticity and are used for stretch-fabrics which have largely replaced rubber latex threads. The hard segments are in the glassy state, microor nanophase separated from the segments that remain liquid (rubbery).
Polymer-supported chemistry, summarized in Fig. 3.54, is a large new field of chemistry involving polymer molecules. It is proving to be an important advance in modern chemistry. The reactant, byproduct, or catalyst can be attached to a polymer gel (see Fig. 3.48), which permits clean separation of the product by simply washingout the small molecules. The open structure of the gel permits easy access to the active sites. An example of such reaction was given before in the Merrifield synthesis (see Fig. 3.2). Various gels with specific functional groups are listed in Fig. 3.54. With these tools a large number of chemical reactions can be undertaken. Note that this type of chemical reaction mimics biochemical reactions in living systems and may
Fig. 3.54
238 3 Dynamics of Chemical and Phase Changes
___________________________________________________________________
help to rid chemical industry of many of the problems found in side-product separation and lead to cleaner processes.
Naturally, only a short summary of the many reactions that lead to the complicated polymer structures can be given here. It must be noted that modern research in polymer science needs a close cooperation between the synthesis of new structures and the characterization of the achieved molecular and phase structures produced and their properties. Of main interest are in this connection the developments of particular phase aggregates such as were first found in proteins. Different small areas within globular proteins are different in polarity, capability of hydrogen bonding, and charge distribution. Sufficiently large differences between such domains can lead to nanometer-size phase separation, a phase separation occasionally referred-to in the different examples of polymer reactions that link incompatible molecular segments. These different phase domains take on special functions in the overall structure, such as giving strength or elasticity, setting up precise geometries and affinities for attraction of small molecules from a surrounding solution, and ultimately enhance reactions between the absorbed molecules. Such phase structures are still poorly understood, but lead to increasing numbers of new and useful materials.
3.5 Crystal and Molecular Nucleation Kinetics
3.5.1 Observation of Nucleation and Crystal Growth
Crystallization and melting kinetics describe the dynamics of the transitions between random and ordered phases. A crystal is an aggregate of many motifs that satisfy a common ordering principle, the repetition scheme, defined in Sect. 5.1. Much is known about the crystallization step since it is often sufficiently slow to be studied. The melting kinetics, on the other hand, is frequently as fast as the conduction of the heat of fusion into the samples, and thus assumed to occur instantaneously. For linear macromolecules, one finds the crystallization usually to be incomplete, and the melting kinetics slow enough to be measured. The kinetics of crystallization differs from the chemical reaction kinetics discussed in Sects. 3.1. Any two reactant molecules can collide in a simple chemical reaction, and rearrange to the product. Before crystallization can occur, however, the melt or solution has to overcome a nucleation barrier. Furthermore, once in the crystalline state, there may still be the possibility of rearrangements to improve the initial, imperfect crystal. As a result, one must discuss crystallization at least in three stages: nucleation, growth, and perfection. There is a similarity of a chain-reaction polymerization to a crystallization in one dimension where nucleation is equal to the initiation of the reaction described in Sect. 3.2. The nucleation steps are treated in this section, details about crystallization and melting in Sect. 3.6, crystal perfection is also a topic in Chap. 5. Little quantitative information is available about crystal perfection, but it is evident in many thermal analyses.
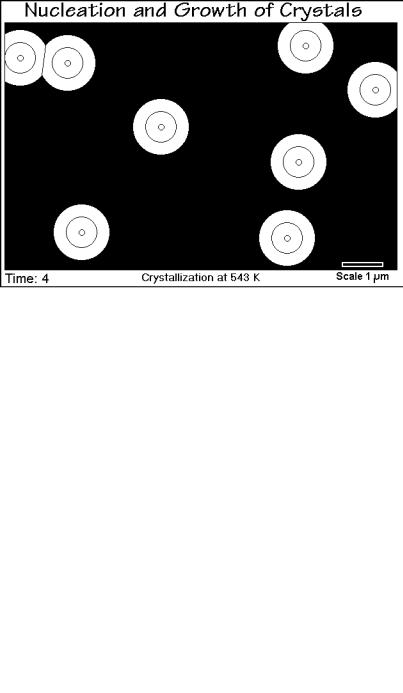
Figure 3.55 illustrates a typical spherulitic crystallization in progress. The black background simulates the empty field of view of a polarizing microscope when looking at an isotropic melt. Time-step 4 is shown in the figure. Step 1 is the
3.5 Crystal and Molecular Nucleation Kinetics |
239 |
___________________________________________________________________
Fig. 3.55
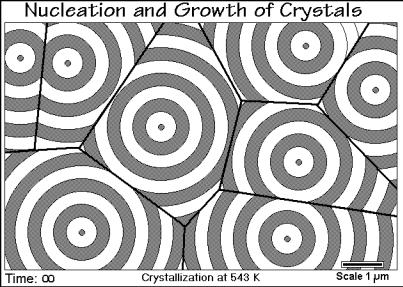
induction time before nucleation occurs and is not visible with an optical microscope. As soon as the growing crystals are large enough they appear as small, birefringent dots in step 2 and subsequently grow until they impinge. Such first impingement can be seen in the upper left corner of Fig. 3.55 where two neighboring crystals ran into each other between steps 3 and 4. After sufficient impingements, the crystal growth slows down, as is obvious in Fig. 3.56 which reproduces time step 6. It is interesting
Fig. 3.56
240 3 Dynamics of Chemical and Phase Changes
___________________________________________________________________
to note that the lines of intersection of neighboring crystals are straight. This is a consequence of nucleation of all crystals at the same time and at equal crystal growth rates. Figure 3.57 illustrates the crystallization, completed to impinging spherulites.
Fig. 3.57
Quite clearly information about the number of nuclei, their moment of appearance, and the subsequent crystal growth rate can be gained from such a microscopic picture. If the produced crystals are of larger than micrometer size, a microscopic inspection of the completed crystallization, or even better a video taping of the overall process, should be part of the thermal analysis of the crystallization process. More about the detailed crystallization kinetics will be discussed in Sect. 3.6.
3.5.2 Evaluation of Nucleation Rates
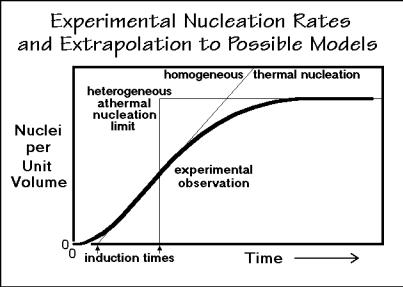
Nucleation of a crystal is called primary nucleation and is assumed to be one of two types. Most common is heterogeneous nucleation, also called athermal nucleation (Gk. - = no change with heat or temperature, a misnomer, as shown in Fig. 3.63, below). It is thought to arise from preexisting nuclei, left over small crystals from prior, incomplete melting or dissolution, named self-nucleation, or foreign, solid particles. For heterogeneous nucleation one expects a constant number of nuclei that grow when the crystallization temperature is reached. Homogeneous nucleation is the second type of crystallization, often described as thermal nucleation. The number of nuclei increases with time in the volume not yet crystallized. On cooling, the nucleation rate increases first, then decreases as the glass transition is approached.
Figure 3.58 displays the results of a typical nucleation experiment. The data can be obtained, for example, with optical microscopy by counting the number of small crystals as a function of time in a given volume element. Easiest is to evaluate a video
3.5 Crystal and Molecular Nucleation Kinetics |
241 |
___________________________________________________________________
Fig. 3.58
recording of the crystallization of a sample of known thickness. There is a short induction time where no crystals grow and no viable nuclei seem to exist. Next, the number of nuclei increases to a fixed number, pointing to the presence of heterogeneous nuclei.
The data of Fig. 3.58 do not fully fit into the simple scheme of nucleations outlined above. The induction time is not explained, and indeed, little is known about it. Constant numbers of heterogeneous nuclei are only reached after some time, indicating that the initial nucleation proceeds similar to homogeneous nucleation, then reach saturation, not expected for homogeneous nucleation, but easily explained by the exhaustion of preexisting nuclei which become active only after a certain time at the given temperature. In case of fast crystal growth, nucleation might not extend to times permitting to see the finite number of nuclei, and thermal nucleation may be assumed by mistake. The data that need to be extracted from such experiment are: N, the number of nuclei, to, the induction time, and b, the rate constant for nucleation. The experimental observations of Fig. 3.58 were modeled after LiPO3, which crystallizes after polymerizing, as discussed in Sect. 3.1.6.
Assuming athermal nucleation for the data treatment, the results for the LiPO3 nucleation at different temperatures are listed in Table 3.2. The number of nuclei does not vary substantially over the very large range of supercooling. The induction time seems to increase with supercooling. A detailed explanation of the mechanism cannot be given since the molecules could have undergone active interchange reactions with another temperature dependency (see Sect. 3.1). Finally, the data should also be fitted to a thermal nucleation model, i.e., the homogeneous nucleation limit N would not have been taken to be constant, but would vary with time as N = b(t to). Obviously this approximation would only be useful if considerable impingement of the crystals would have begun before the nucleation is leveling-off, which was not the case. The
242 |
|
3 Dynamics of Chemical and Phase Changes |
|
___________________________________________________________________ |
|||
Table 3.2. Nucleation data for LiPO3 |
crystallization from the LiH2PO4 melt |
||
___________________________________________________________________ |
|||
Temperature (K) |
Nuclei (#/cm3) |
Nucleation Time (s) |
|
___________________________________________________________________ |
|||
848 |
0.5 108 |
|
? |
793 |
1.2 108 |
|
? |
713 |
1.6 108 |
|
? |
648 |
6.9 108 |
|
? |
573 |
2.4 108 |
|
165 |
568 |
4.3 108 |
|
226 |
563 |
4.7 108 |
|
245 |
553 |
8.3 108 |
|
317 |
549 |
5.3 108 |
|
360 |
___________________________________________________________________
conclusion that heterogeneous nucleation is a better model for the LiPO3 crystallization can also be derived from the morphology of the crystals grown. The LiPO3 crystal morphology is spherulitic as described in Sect. 5.2.5, as is also depicted in Fig. 3.57. All spherulites are nucleated at about the same time which causes straight lines of impingement. Spherulites nucleated at largely different times would have had hyperbolic lines of impingement.
3.5.3 Mathematical Description of Primary Nucleation
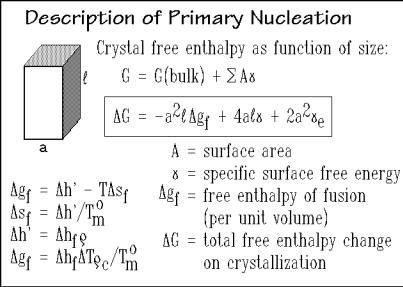
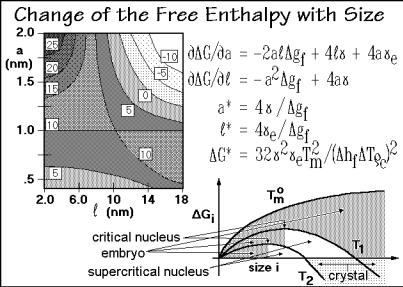
The thermodynamic description of a nucleus as a small crystal is given in Fig. 3.59. It shows a drawing of a prismatic nucleus with a quadratic cross-section, a. Its free enthalpy, G, can be expressed as a function of dimensions a and , where the lengthis taken always along the molecular chain axis. The term a2 gf represents the bulk
Fig. 3.59
3.5 Crystal and Molecular Nucleation Kinetics |
243 |
___________________________________________________________________ |
|
free enthalpy of crystallization which is the negative of the free enthalpy of fusion,gf, and and e are the surface free energies (per unit area). The change of gf into an expression containing the heat of fusion hf (per unit mass), the supercooling T
(= T ° T), crystal density , and equilibrium melting temperature T ° are indicated
m c m
in the figure. This expression will also be used extensively in the discussion of the thermodynamics of defect crystals (Chap. 5).
Figure 3.60 illustrates the change in free enthalpy of a nucleus with dimensions a and , and with parameters typical for polyethylene in units of 10 20 J. The lines of equal value lead to a saddle point at G* = +10 (= 10 19 J) and a volume, a2 , of 10 nm3. At the saddle point a critical nucleus size has been reached (a*, *, and G*). The equations for the slopes of the saddle surface and the critical parameters are listed in the figure. The critical parameters are easily computed by recognizing that at the saddle point both slopes are zero. Any increase beyond the size of the critical nucleus decreases the free enthalpy, i.e., the nucleus becomes more stable. Smaller nuclei are called embryos, and beyond G = 0, a nucleus is a stable crystal that can now grow without further hindrance. One expects, however, additional complications as crystallization proceeds. The crystallizing entities are not small, rigid spheres, but are repeating units of a flexible, linear macromolecule that needs to have the proper conformation for crystallization. One of these complications is molecular nucleation, treated at the end of this section.
The change of G for a given shape is shown schematically in the bottom graph of Fig. 3.60 for different temperatures and as a function of a single size parameter, i. Close to the melting temperature the temperature dependence of the free enthalpy
curve is caused mainly by the change of g |
f |
with temperature. At T °, the equilibrium |
|
m |
melting temperature, no crystallization is possible since gf is zero and Gi can never become negative. With decreasing temperature the critical nucleus becomes smaller
Fig. 3.60
244 3 Dynamics of Chemical and Phase Changes
___________________________________________________________________
Table 3.3. Critical nucleus dimensions, *, in nm.
___________________________________________________________________
|
|
Surface Free Energy ( J cm 2) |
|
||||
T (K) |
____________________________________________________ |
||||||
|
|
|
|
|
|
|
|
|
0.1 |
0.5 |
1.0 |
1.5 |
5.0 |
10.0 |
20.0 |
___________________________________________________________________ |
|||||||
0.1 |
76.5 |
382.4 |
764.8 |
1,147.2 |
3,824 |
7,648 |
15,209 |
1.0 |
7.6 |
38.2 |
76.5 |
114.7 |
382 |
765 |
1,521 |
10.0 |
0.8 |
3.8 |
7.6 |
11.5 |
38 |
76 |
153 |
25.0 |
0.3 |
1.5 |
3.0 |
4.5 |
15 |
31 |
61 |
50.0 |
0.2 |
0.8 |
1.5 |
2.3 |
8 |
15 |
31 |
100.0 |
0.1 |
0.4 |
0.8 |
1.2 |
4 |
8 |
15 |
150.0 |
0.1 |
0.2 |
0.5 |
0.8 |
3 |
5 |
10 |
___________________________________________________________________
and the nucleation rate speeds up, as can be deduced from the data of Table 3.3 which are calculated for a range of possible surface free energies and supercoolings, T. Typical fold-surface free energies are 5 J cm 2 and side-surface free energies are 0.5 J cm 2. The calculations for Table 3.3 made use of heats of fusion of 200 J g 1,
densities of 1.0 g cm 3, and T ° = 400 K, typical for polyethylene-like polymers.
m
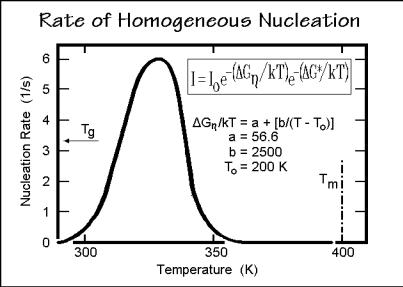
The rate of nucleation, I, has been estimated by Turnbull and Fisher [25] from the shape of Gi and the influence of local viscosity, governed by a free enthalpy G . In Fig. 3.61 this equation is listed. The rate Io applies to the case that nucleation is unhindered. The first exponent of the equation expresses retardation of nucleation due to viscosity effects with the given parameters (see Sect. 5.6). It stops nucleation as the glass transition temperature is approached. The nucleation described is homogeneous nucleation and creates a continuous stream of new crystals in the remaining melt or solution. For polymers it takes a supercooling of about 50 K to overcome the
Fig. 3.61
3.5 Crystal and Molecular Nucleation Kinetics |
245 |
___________________________________________________________________
nucleation barrier with an observable rate. The curve drawn for homogeneous nucleation is calculated for polymers with = 0.5 J cm 2, e = 5 J cm 2, Tmo = 400 K,hf = 210 J g 1, c = 1.00 g cm 3, Io = 6.2×10 12 s 1. The nucleation rate I is expressed in nuclei per second for one mole of elements that can crystallize in a single step and is not expected to be more precise than one order of magnitude. Nucleation stops when approaching the glass or the melting transitions.
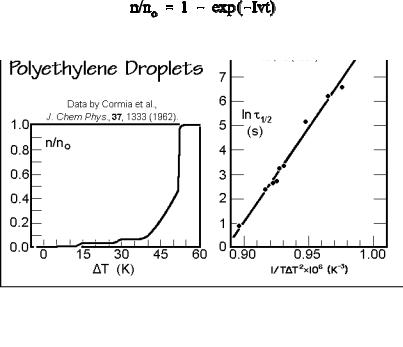
It is rather difficult to obtain experimental confirmation of the just derived expressions. One must have a melt or solution free of inadvertent heterogeneous nuclei. This was attempted by subdividing the crystallizing phase into small droplets. Each droplet has then only a small chance to contain a heterogeneous nucleus. Experimental data for homogeneous nucleation of polyethylene melt are displayed on the left side of Fig. 3.62. The polyethylene droplets of 1 3 m diameter were dispersed in silicon oil and observed under a polarizing microscope on cooling at 0.17 K min 1. Four different regions of nucleation are obvious. Until 15 K of supercooling none of the droplets crystallized. Then a small number of droplets crystallized with the help of heterogeneous nuclei. Typically these were the larger droplets. A second stage of heterogeneous nucleation occurred at about 30 K supercooling. These nuclei are less efficient and need additional supercooling to develop into critical nuclei. The homogeneous nucleation range is then found at more than 45 K supercooling where ultimately all droplets crystallize.
The right figure gives more quantitative kinetics, gained from isothermal experiments. The fraction of droplets crystallized, n/no, can then be estimated from:
where v is the volume of the droplet and t the time. From the half-time, t = 1/2 [= 1.649/(Iv)], it is then possible to estimate the surface free energies contained in
Fig. 3.62
246 3 Dynamics of Chemical and Phase Changes
___________________________________________________________________
G* ( 2 e 11×10 18 J3 cm 6). Other polymers may need much larger supercooling for homogeneous nucleation than the just analyzed polyethylene. Typical examples are 105 K for polypropylene, 100 K for nylon 6, 70 K for poly(oxymethylene), and 68 K for poly(oxyethylene).
3.5.4 Heterogeneous Nucleation
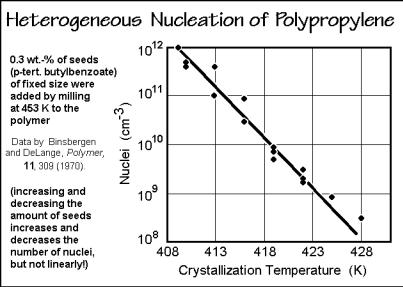
Experimentally one usually observes not homogeneous, but heterogeneous nucleation. This is nucleation where small particles initiate crystallization. Instead of the interfacial surface free energy to the melt or solution preventing nucleation, the crystallization is now either unhindered or only restricted by the interfacial free energy with the heterogeneous nucleus. Analogous equations as for homogeneous nucleation can be derived for the latter case, but are difficult to verify because of insufficient knowledge of the interfacial free energies and the influence of the surface geometry.
Figure 3.63 illustrates a typical heterogeneous nucleation experiment for a melt of polypropylene. For a given amount of seeding material the number of active nuclei does not stay constant, but increases logarithmically with supercooling. For macromolecules, the effect of seeding disappears long before the melting temperature is reached. Even self-seeding does not cause crystal growth close to the melting temperature (see Sect. 3.6). Figure 3.64 shows some solution-grown, self-seeded polyethylene crystals as published originally by Keller and Willmouth [26]. The seeds are visible in the center of most of the lamellar crystals. Note, the crystals that grow under these conditions have the lattice orientation fixed by the seed. Figure 3.65 illustrates the growth of poly(oxymethylene) on a single-crystal surface of NaCl. Clearly the crystal order of the NaCl surface affects the alignment of the subsequently grown polymer crystals. This transmittal of order is called epitaxy. The term epitaxy
Fig. 3.63