

Thermal Analysis of Polymeric Materials
.pdf2.3 Heat Capacity |
127 |
__________________________________________________________________
higher temperatures, valuable information can be extracted from the deviations of the experiment, as will be shown below. A detailed understanding of the origin of the heat capacity of polyethylene, thus, is achieved and the link between the macroscopic heat capacity and the molecular motion is established.
Figure 2.52 shows a newer fitting procedure on the example of one of the most complicated linear macromolecules, a solid, water-free (denatured) protein [23]. The protein chosen is bovine -chymotrypsinogen, type 2. Its degree of polymerization is 245, containing all 20 naturally occurring amino acids in known amounts and established sequence. The molar mass is 25,646 Da. All group vibration contributions were calculated using the data for synthetic poly(amino acid)s in the ATHAS Data Bank, and then subtracted from the experimental Cv. The remaining experimental skeletal heat capacity up to 300 K was then fitted to a Tarasov expression for 3005 skeletal vibrators (Ns) as is shown in 2.3.25. A 20×20 mesh with 3 values between 10 and 200 K and 1 values between 200 and 900 K is evaluated point by point, and then least-squares fitted to the experimental Cp. It is obvious that a unique minimum in error is present in Fig. 2.52, proving also the relevance of the ATHAS for the
Fig. 2.52
evaluation of the vibrational heat capacities of proteins. An interpolation method was used to fix the global minimum between the mesh points.
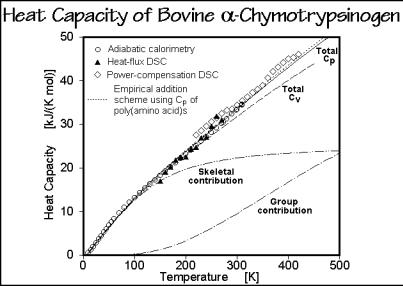
Figure 2.53 illustrates the fit between calculation of the heat capacity from the various vibrational contributions and the experiments from various laboratories. Within the experimental error, which is particularly large for proteins which are difficult to obtain free of water, the measured and calculated data agree. Also indicated are the results of an empirical addition scheme, using the appropriate proportions of Cp from all poly(amino acid)s. All transitions and possible segmental melting occur above the temperature range shown in the figure.
128 2 Basics of Thermal Analysis
__________________________________________________________________
Fig. 2.53
2.3.8 Polyoxide Heat Capacities
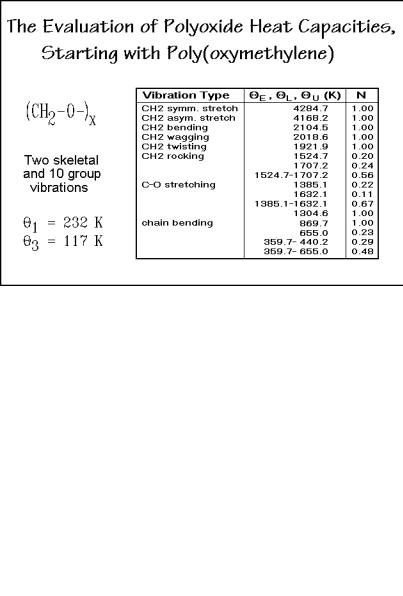
Besides providing heat capacities of single polymers, the ATHAS Data Bank also permits us to correlate data of homologous series of polymers. The aliphatic series of polyoxides is an example to be analyzed next. An approximate spectrum of the group vibrations of poly(oxymethylene), POM (CH2 O )x, the simplest polyoxide, is listed in Fig. 2.54. The CH2-bending and -stretching vibrations are similar to the data for polyethylene, PE (CH2 )x. The fitted theta-temperatures are given also in the figure. Note that they are calculated for only two modes of vibration. The missing two skeletal vibrations, contributed by the added O group, are included (arbitrarily) in the list of group vibrations since they are well known.
The table of group vibration frequencies with their -temperatures and the number of skeletal vibrators, Ns, with their two -temperatures permits us now to calculate the total Cv and, with help of the expressions for Cp Cv, also Cp. Figure 2.55 shows the results of such calculations, not only for POM and PE in the bottom two curves, but also for a larger series of homologous, aliphatic polyoxides. The calculations are based on the proper number of group vibrations for the number of O and CH2 in the repeating unit from Fig. 2.54:
PO8M |
= |
poly(oxyoctamethylene) |
[O (CH2 )8]x |
POMO4M= |
poly(oxymethyleneoxytetramethylene) [O CH2 O (CH2 )4]x |
||
PO4M |
= |
poly(oxytetramethylene) |
[O (CH2 )4]x |
PO3M |
= |
poly(oxytrimethylene) |
[O (CH2 )3]x |
POMOE |
= |
poly(oxymethyleneoxyethylene) |
[O CH2 O (CH2 )2]x |
POE |
= |
poly(oxyethylene) |
[O (CH2 )2]x |
2.3 Heat Capacity |
129 |
__________________________________________________________________
Fig. 2.54
Fig. 2.55
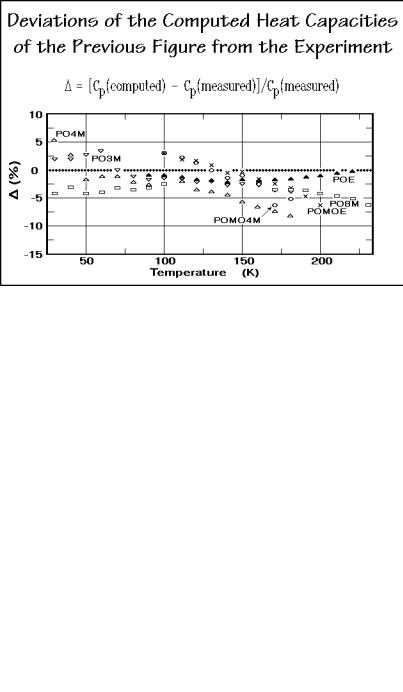
The more detailed analysis of the heat capacities of the solid, aliphatic polyoxides is summarized in the next two figures. Figure 2.56 displays the deviations of the calculations from the experiment. Although the agreement is close to the accuracy of the experiment (±3%), some systematic deviation is visible. It is, however, too little to interpret as long as no compressibility and expansivity data are available for
130 2 Basics of Thermal Analysis
__________________________________________________________________
Fig. 2.56
a more precise Cp to Cv conversion. Figure 2.57 indicates that the 1 and 3 values are changing continuously with chemical composition. It is thus possible to estimate1 and 3 values for intermediate compositions, and to compute heat capacities of unknown polyoxides or copolymers of different monomers without reference to measurement. An interesting observation is that the 1-values are not very dependent on crystallinity (see also Fig. 2.50 for polyethylene). The values for 3, in contrast,
Fig. 2.57
2.3 Heat Capacity |
131 |
__________________________________________________________________
are as much as double as high for the crystalline polymers than for the glassy ones. Since the 3 values are, however, relatively small, the skeletal contributions are usually close-to-fully excited above room temperature.
Similar analyses were accomplished for more than 150 macromolecules. The data on N, 1, and 3 together with the ranges of experimental Cp data, are collected in the ATHAS Data Bank and summarized in Appendix 1. The precision of these computed heat capacities is in general better than ±5%, close to the experimental accuracy.
The strict additivity of the heat capacity contributions of the group vibrations, and the continuous change in 1 with chemical composition, led to the development of addition schemes for heat capacities. As long as the contribution which corresponds to the backbone grouping of a polymer is known empirically, it is possible to estimate heat capacities of such polymers and copolymers. The just completed discussion of the Tarasov analysis indicates that, indeed, the group vibrations are additive, but that for the low-temperature heat capacities deviations are to be expected as long as the intermolecular skeletal vibrations are not fully excited. In this case it is possible to estimate 3 from similar substances for an improved estimate.
2.3.9 Heat Capacities of Liquids
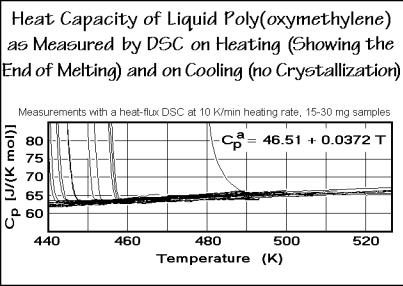
The heat capacities of liquids are much more difficult to understand. The motion involves now also large-amplitude rotations and translations. Since, however, in the liquid state polymers are usually in equilibrium, measurements are more reproducible, as is shown in Fig. 2.58 using the example of poly(oxymethylene), POM. The graph is a direct copy of 36 runs of differently treated poly(oxymethylenes). The almost vertical approach of some curves to the liquid Cp is caused by the end of melting of crystallized samples. All curves superimpose when the samples are liquid.
Fig. 2.58
132 2 Basics of Thermal Analysis
__________________________________________________________________
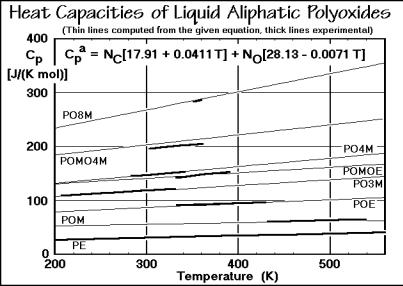
The addition scheme of group contributions helps to connect larger bodies of data for liquid polymers. In the liquid state one is always at a sufficiently high temperature so that the intermolecular skeletal vibrations are fully excited so that additivity holds for both the intramolecular skeletal vibrations and the group vibrations. Figure 2.59 shows the experimental data for the liquids for the same series of polyoxides as analyzed for the solid state. The equation in the top of the graph represents all the thin lines, while the thick lines represent the experimental data. The equation for Cpa was arrived at by least-squares fitting of all experiments and seems more precise than any of the separate experiments.
Fig. 2.59
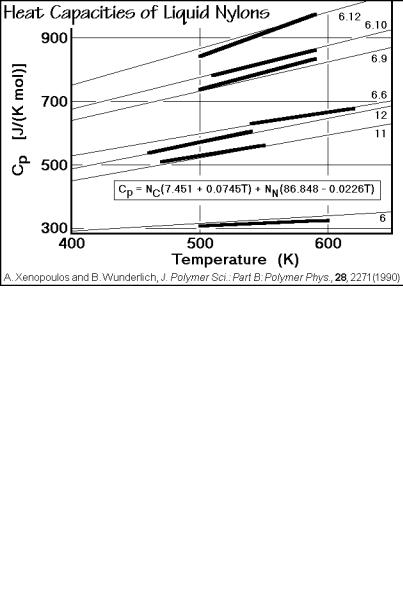
Other examples of the heat capacities of homologous series of liquid polymers are given in Figs. 2.60 and 2.61 for aliphatic nylons and polyesters. The nylons are indicated by their number of carbon atoms in the repeating units (see Sect. 1.2). The names of the polyesters are abbreviated as follows:
PHMS |
= |
poly(hexamethylene sebacate) |
[(CH2–)6OCO–(CH2–)8COO–] |
PPDL |
= |
polypentadecanolactone |
(CH2–)14COO– |
PES |
= |
poly(ethylene sebacate) |
[(CH2–)2OCO–(CH2–)8COO–] |
PTDL |
= |
polytridecanolactone |
(CH2–)12COO– |
PUDL |
= |
polyundecanolactone |
(CH2–)10COO– |
PTMA |
= |
poly(trimethylene adipate) |
[(CH2–)3OCO–(CH2–)4COO–] |
PTMS |
= |
poly(trimethylene succinate) |
[(CH2–)3OCO–(CH2–)3COO–] |
PCL |
= poly( -valerolactone) |
(CH2–)5COO– |
|
PVL |
= poly( -valerolactone) |
(CH2–)4COO– |
|
PBL |
= poly( -butyrolactone) |
(CH2–)3COO– |
|
PPL |
= poly( -propiolactone) |
(CH2–)2COO– |
|
PGL |
= |
polyglycolide |
(CH2–)COO– |
2.3 Heat Capacity |
133 |
__________________________________________________________________
Again, single equations represent all data for each, the liquid aliphatic nylons and polyesters. The overall error using all experimental data is less than for any single measurement. It is typical for the data taken by DSC that over larger temperature regions a slope develops which introduces a systematic error. For higher quality data, the temperature range of measurement should be limited, as was suggested in Sect. 2.3.1.
Fig. 2.60
Fig. 2.61
134 2 Basics of Thermal Analysis
__________________________________________________________________
2.3.10. Examples of Application of ATHAS
The application of the ATHAS has produced a large volume of critically reviewed and interpreted heat capacity data on solid and liquid homopolymers. This knowledge is helpful in the determination of the integral thermodynamic functions which are also part of the data bank. Even of greater importance is the help these basic data give in the separation of nonequilibrium enthalpy and heat capacity effects as will be illustrated in a number of examples.
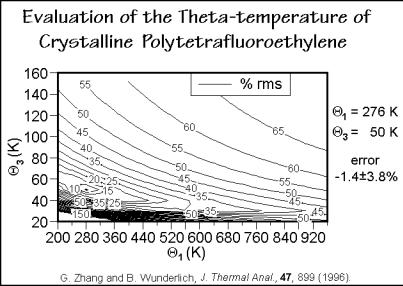
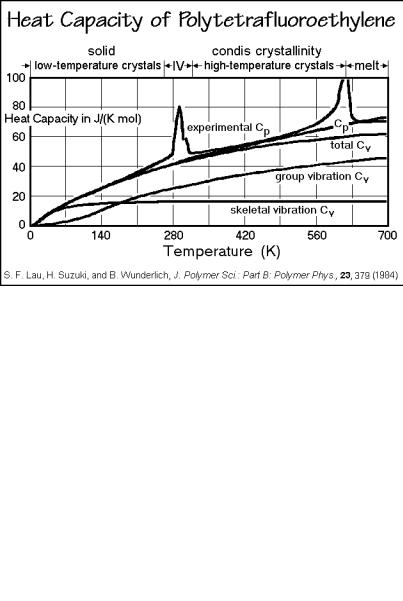
Polytetrafluoroethylene. Figure 2.62 shows the analysis of the heat capacity of crystalline polytetrafluoroethylene (PTFE). The comparison between calculation and measurement is given in Fig. 2.63. As in the case of the polyoxides, it is also possible to predict heat capacities of all less fluorinated polyethylenes. The measured sample
Fig. 2.62
was almost completely crystalline, but it is obvious from the graph that there are two rather broad endotherms superimposed on the heat capacity curves. The room temperature transition is particularly broad. It represents a crystal-to-condis-crystal transition, discussed in Sect. 2.5. Without the computed heat capacity as a baseline, it is impossible to separate the heat of transition quantitatively from the heat capacity. Based on these data it was possible to show that the entropies of transition, when added, give a similar value (9.6 J K 1 mol 1) as the entropy of fusion of polyethylene (9.9 J K 1mol 1). The high temperature of the appearance of liquid PTFE is thus due to the disorder in the crystal, not a lesser entropy in the melt.
Poly(oxybenzoate-co-oxynaphthoate). Figure 2.64 represents an even more complicated polymer system. In this case the macromolecule is the random copolymer poly(oxybenzoate-co-oxynaphthoate), a high-strength material (Vectra™).
2.3 Heat Capacity |
135 |
__________________________________________________________________
Fig. 2.63
Fig. 2.64
The graph shows a rather small endotherm and a broad, possibly two-stage glass transition which stretches over more than 100 K. Without precise computation of the liquid and solid heat capacities, it would not have been possible to identify the glass transition and provide important characteristics for the practical application of the polymer. The broad glass transition is caused by the small amount of ordering in the
136 2 Basics of Thermal Analysis
__________________________________________________________________
copolymer that produced a nanophase-separated structure with each molecule traversing many different nanophases. A similar broadening of the glass transition is found for all semicrystalline polymers (see Sect 6.3.4).
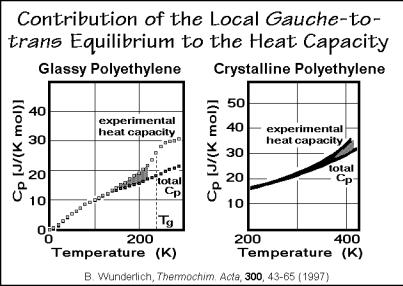
Large-amplitude motions of polyethylene. The increasing deviation from the glassy or crystalline vibrational heat capacity of polyethylene with temperature was already noted in Figs. 2.46 and 2.51. In Fig. 2.65 these two effects are compared side-by-side. The glassy polyethylene shows local gauche-trans exchanges down to almost 100 K. With mechanical measurements this has been identified as the - transition. This small increase in heat capacity has also been mistaken as the glass transition, which, however, is clearly seen at 237 K. A similar increase in heat capacity occurs for the crystalline polyethylene. It could also be linked to the local formation of dynamic gauche-defects in the crystals (see Sects. 5.3 and 5.5). One expects that these small increases in heat capacity are indicative of the possibility of plastic deformation. Many other polymers have similar gradual beginnings of the increase in heat capacity at the glass transition and also before melting.
Fig. 2.65
Polymethionine. Figures 2.66 and 2.67 illustrate the analysis of the heat capacity of anhydrous, solid polymethionine, a synthetic poly(amino acid) with the structural formula [CH(CH2 CH2 S CH3) CO NH )x]. This is only one of the 20 poly(amino acid)s that can be made out of the naturally occurring amino acids and were analyzed for the data bank (see Appendix 1). These data form the basis for the addition scheme of protein heat capacities. Of particular interest is the positive deviation starting at room temperature or maybe even earlier. It was suggested that this increase in heat capacity may be connected with a glass transition involving the side groups of the polymer. Confirmation of this suggestion is still pending and could have important implications for the understanding of proteins.