

Thermal Analysis of Polymeric Materials
.pdf2.5 Phases and Their Transitions |
167 |
__________________________________________________________________
Fig. 2.103
with mesophase order, but without the large-amplitude motion. The recognition of mesophases and mesophase glasses as states of intermediate order and their study by thermal analysis has become of great importance for the understanding of the multitude of materials. The empirical rule of change of the heat capacity when going through a glass transition, is described in Sect. 2.5.6.
2.5.2 Phases of Different Sizes
It was noted about 150 years ago that the properties of phases change when their dimensions decrease to the micrometer scale. This observation was first made after the discovery of colloids. Today, such small phases are better called microphases [27]. In microphases, the effect of the surfaces cannot be neglected. Surface free energies and charges (surface potentials) govern the properties and stability (or metastability) of the microphases. Similarly, in Fig. 1.6 it is shown that molecules may be classified into three types, small, large and flexible, and large and rigid. In this section the changes of phase size and molecular size are analyzed briefly.
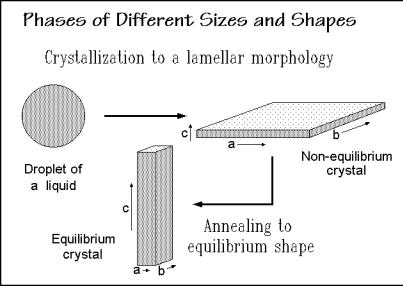
When forming a crystal via nucleation and growth, as described in Sects. 3.5 and 3.6, the linear growth rates in the various crystallographic directions determine the initial, usually metastable, crystal shape. Linear, flexible macromolecules, for example, chain-fold to lamellar crystals with much faster growth in the crystallographic a- and b-directions than in direction c, along the chain direction, as outlined in Fig. 2.104. The folds accumulate in the ab-surface (see Sect. 5.2). By limiting the available material to a few macromolecules, the initial liquid takes the shape of a small droplet with a micrometer diameter, and the crystal is also a microphase, as assumed in the figure. On annealing, the initial, kinetically-determined morphology
168 2 Basics of Thermal Analysis
__________________________________________________________________
Fig. 2.104
(shape) may approach equilibrium, as shown in the sketch at the bottom. The major rearrangement of the molecules within the crystal requires sufficient mobility, as has been observed, for example, in the condis mesophase of polyethylene. The equilibrium crystal must have a minimum of the positive surface free energy. Based on this principle, Wulff devised in 1901 a construction to establish the equilibrium shape (Wulff construction). By drawing normals from a point within the crystal to the various possible surfaces with lengths proportional to the surface free energy, the innermost complete body of these surfaces is the equilibrium shape. The proper volume can be achieved by adjusting the lengths without changing the proportions. The equilibrium polymer crystal should have, thus, its large dimension at right angles to the high energy fold surface ab, as indicated in Fig. 2.104.
New properties arise when the molecular sizes increase to the dimensions of the phase, as for example in the case of a typical polyethylene of 500,000 Da. It has a contour length of 2.8 m and can easily cross microphase boundaries. This traversing of the surface makes neighboring phases interact strongly, in contrast to the weak interactions by intermolecular forces (see Fig. 1.5).
The lower limit of the size of crystals of macromolecules may be as small as 2 nm and must then be called a nanophase as displayed in Fig. 2.98. The noncrystalline material surrounding the macromolecular crystals, containing folds, chain ends, noncrystallizable repeating units, and tie molecules, has similarly small phase dimensions. In nanophases the opposing surfaces of a phase area are sufficiently close to interact so that no bulk phase exists anymore. Macromolecules traversing a nanophase will strongly link the surfaces; but even weaker forces, such as caused by polarity at the interface, or by charges in the surface, may bridge nanophases and may give rise to special properties of the nanophases. For characterization, nanophases need a detailed study of composition, physical state, molecular structure,
2.5 Phases and Their Transitions |
169 |
__________________________________________________________________
and molecular motion. The macromolecules can now traverse not only one, but several or many phase domains and influence the macroscopic properties.
The limit of nanophases towards smaller sizes occurs at perhaps one nanometer. Two causes exist for this limit: The increasing loss in homogeneity due to the inherent molecular structure and their fluctuations in energy makes the recognition of a homogeneous phase impossible; and for copolymers, the decreasing gain in enthalpy on mixing due to the larger surface contribution relative to the entropy loss on phase separation makes the nanophase unstable compared to a solution.
This short summary illustrates that three size-ranges must be considered for each type of phase (macrophases, microphases, and nanophases). In addition, the phase structure may be different for each of the three types of molecules. This leads to a total of nine possible situations for each of the nine condensed phases shown in Fig. 2.103. Of the 81 combinations, 57 have been suggested to be possible at the beginning of Sect. 2.5 [27]. Thermal analysis is the main technique to distinguish and identify this multitude of different systems.
2.5.3 Mesophases
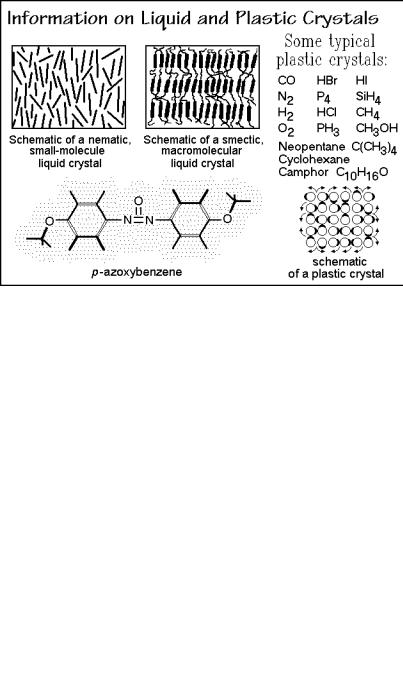
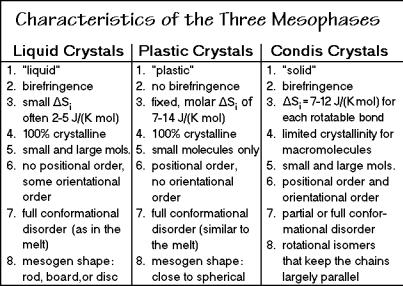
The term mesophase, introduced in Sect. 2.5.1, was first coined in 1922 by Friedel to describe mainly liquid crystals which are known since 1888. They are related to liquids, but maintain a certain degree of orientational order, as shown schematically in Fig. 2.105. A list of characteristic properties of liquid crystals is given in the left column of Fig. 2.107, below. In the examples shown in Fig. 2.105, the liquid crystalline order is due to an elongated, rod-like or flat, board or disk-like segment of the molecules, the mesogen. The left example in Fig. 2.105 is a two-dimensional representation of a nematic liquid crystal (Gk. %, thread, from the thread-like interference patterns of nematic liquid crystals under the polarizing microscope). The nematic phase shows orientation of the mesogens in only one direction. The right example is a macromolecular smectic liquid crystal (Gk. , soap). In this case the limited orientational order is in two dimensions. The example is of a polymer that has a mesogen included in the otherwise flexible chain. For example, CH2-sequences can link the mesogens and providing the mobility needed to give a liquid-crystalline character. A typical example of a mesogen is shown at the bottom of Fig. 2.105. The orientation in the liquid crystals gives rise to the birefringence and its high mobility allows the use of liquid crystals in display devices.
Soaps and lipids are also liquid crystals. These molecules consist of two parts that would be phase-separated, if not connected by strong bonds. In the pure state these molecules arrange such that the junction between their two incompatible segments form an interface ( | ) between two phase areas, for example, in sodium stearate, a soap: Na+ OOC ( | )(CH2)16 CH3, and in lipids as seen in Fig. 2.106. The domain size of these phases is about one nanometer in the direction of the molecule, i.e., they are nanophases. On crystallization, the molecules of the liquid crystals have to pack closely, which is not always possible for more complicated structures, so that glasses are common low-temperature phases for such molecules. For the soaps and lipids, a nanophase-separation remains in the crystals. Sometimes the two types of nanophases within the overall crystal undergo separate phase transitions.
170 2 Basics of Thermal Analysis
__________________________________________________________________
Fig. 2.105
Plastic crystals are more closely related to the classical crystals. They have full positional order as shown in the sketch in Fig. 2.105. The plastic crystal consist, however, of molecules (their mesogens) that are almost spherical and can start to rotate within the crystal at a given transition temperature. Figure 2.107 contains a list of typical properties of plastic crystals and allows a comparison to liquid crystals. The plastic crystalline state was first recognized in the 1930's. Most plastic crystals
Fig. 2.106
2.5 Phases and Their Transitions |
171 |
__________________________________________________________________
Fig. 2.107
have a cubic crystal structure. Due to the rotation of the molecules in the crystal, their actual symmetry is averaged to a sphere, eliminating both the birefringence and causing an entropy of fusion similar to the metals and noble gases which have spherical motifs (see Sects. 5.4 and 5.5). Cubic crystals have also many slip planes and with rotating, weakly bound molecules, the crystals easily deform, they are plastic. Metals with similar crystal structures and spherical motifs, but stronger bonding, still show ductility, but no plastic-crystal behavior. Both liquid and plastic crystals show conformational mobility and disorder if the basic molecule is flexible, i.e., can change to different conformational isomers.
Conformationally disordered crystals (condis crystals) were discovered in the 1980’s. They show positional and orientational order, but are partially or fully conformationally mobile. The condis crystals complete the comparison of mesophases in Figs. 2.103 and 2.107. Linear, flexible molecules can show chain mobility that leaves the position and orientation of the molecule unchanged, but introduces large-amplitude conformational motion about the chain axis. Again, the symmetry of the molecule is in this case increased. Condis crystals have often a hexagonal, columnar crystal structure. Typical examples of condis crystals are the high-temperature phase of polyethylene, polytetrafluoroethylene, trans-1,4- polybutadiene, and the low-temperature phases of soaps, lipids and other liquidcrystal forming, flexible molecules.
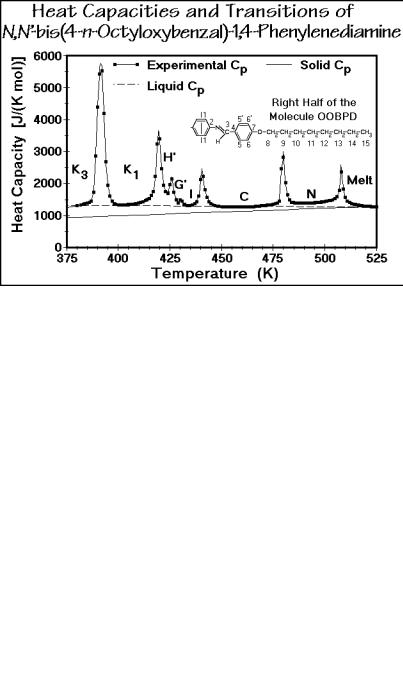
Figure 2.108 illustrates the chemical structure and a thermal analysis curve of a typical small molecule with liquid-crystal and condis-crystal phases, OOBPD. The mesogen is the rigid bisoxybenzalphenylenediamine. Two flexible octyl groups enable conformational disorder by rotation about the C C and O C bonds. The letter N represents the nematic phase, letters C, I, G’, and H’ the increasingly better ordered smectic phases, and K designates condis phases. Note that phase K3 has still not
172 2 Basics of Thermal Analysis
__________________________________________________________________
Fig. 2.108
reached the heat capacity expected for the solid crystalline or glassy state indicated by the thin, bottom line (vibration-only crystalline heat capacity, see Sect. 2.3). Since no further crystallization occurs, a glass transition is expected and is seen in thermal analysis at about 350 K. More details about this compound are given in Sect. 5.5.4.
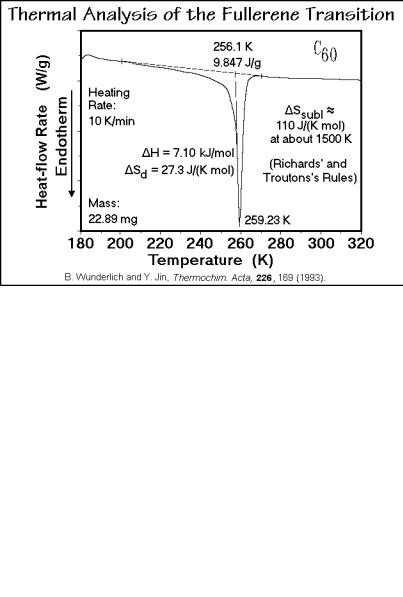
Fullerene, C60, is an example of a molecule with a plastic-crystal phase. Its structure is given in Fig. 2.109 together with the other two allotropes of carbon,
Fig. 2.109
2.5 Phases and Their Transitions |
173 |
__________________________________________________________________
diamond and graphite. Its calorimetry is discussed in Sect. 4.2.7 (see also Figs. 2.39–41). Figure 2.110 is a thermal analysis trace (DSC, see Sect. 4.3). The transition starts rather broad and then becomes sharp as full rotation becomes possible. More details about this transition are available through 13C nuclear magnetic resonance experiments. Figure 2.111 is a recording of the spin-lattice relaxation time T1. It is a measure of the rotation of the molecule. Three models
Fig. 2.110
Fig. 2.111
174 2 Basics of Thermal Analysis
__________________________________________________________________
were fitted to the data: (1) molecular motion about the five-fold symmetry axis C5 (see Sect. 5.1.5 for a discussion of symmetry), (2) motion about the incomplete, sixfold axis, C6, and (3) full rotation. Since there is no change in heat capacity (entropy) in the lowest temperature region of Fig. 2.111, motion (1) must be a jump between indistinguishable states of lower energy and longer residence time. This agrees with the symmetry axis C5, best seen in Fig. 5.37. The mechanism (2) is energetically only slightly more difficult, but the symmetry is incomplete and produces disorder, i.e., the entropy (heat capacity) increases. Stage (3), finally, leads orientational disorder.
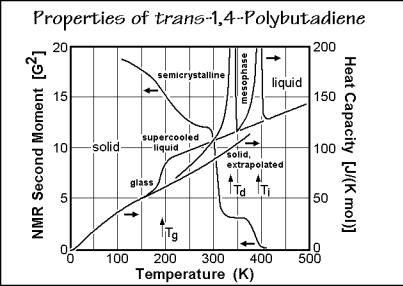
Polytetrafluoroethylene and trans-1,4-polybutadiene are two examples of macromolecular condis crystals. The heat capacity of polytetrafluoroethylene is shown in Fig. 2.63, that of trans-1,4-polybutadiene is illustrated in Fig. 2.112. Both polymers
Fig. 2.112
have two endothermic transitions. At low temperature they show an endotherm at the disordering temperature, Td, on going from the crystal to the condis phase, then they ultimately melt at Ti (isotropization temperature). In Fig. 2.112 the motion of trans- 1,4-polybutadiene is characterized with 1H solid-state NMR, using the line width of the signal as a measure of mobility. The line width can be modeled quantitatively in terms of its second moment (G2). The first narrowing is due to the glass transition of the not-crystallized, amorphous fraction of the semicrystalline polymer, the second, due to the conformational mobility gained at Td, the third to final melting (isotropization) at Ti.
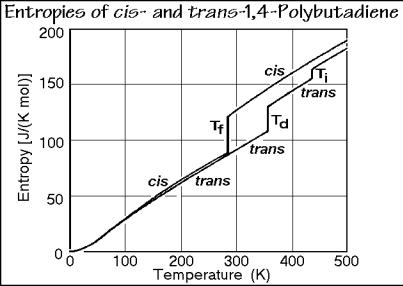
Figure 2.113 indicates with an entropy plot that only the trans isomer of the 1,4- butadienes displays a stable mesophase. The crystals of the cis isomer have a more helical structure which packs less well in the crystal and needs much more space to rotate into a conformationally disordered structure. As a result of this different structure, the cis polymer melts at a lower temperature, and in one step.
2.5 Phases and Their Transitions |
175 |
__________________________________________________________________
Fig. 2.113
2.5.4 Mesophase Glasses
All mesophases have some large-amplitude type of motion. On cooling the mesophases have two paths to the solid state as seen in Fig. 2.103. Either the mesophase orders to the crystal state, or the large-amplitude motion changes to the corresponding vibrations without change of order. In the second case there is no entropy of transition to the solid state (see Sect. 2.5.6), only the heat capacity changes to the vibration-only case, discussed in Sect. 2.3. The mesophase glass differs from the amorphous glass by possessing the order of the mobile mesophase. Each mesophase, thus, has a corresponding glass, as was discussed in Sect. 2.5.1 and shown in Fig. 2.103. Liquid crystal glasses were seen already in the 1930’s [28].
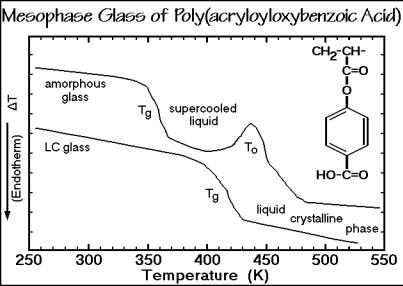
Liquid crystals are quite similar to the liquids in their mobility, their glass transition is similar to the glass transition of an amorphous liquid. Figure 2.114 shows a special example. The monomer of the chosen polymer, acryloyloxybenzoic acid, does not have a liquid crystalline phase. On polymerization, an amorphous liquid results that changes with time to a liquid crystal on dimerization of the oxybenzoic acid side-group via hydrogen bonds. The thermal analysis of Fig. 2.114 shows in its upper trace a sample quenched to the amorphous glass before ordering. A normal glass transition occurs on heating, followed by ordering to the liquid crystal at To. On the second cooling, the LC glass is formed, which, on reheating (bottom trace) shows a glass transition of similar magnitude, but at higher temperature because of the dimerization. Glass transitions also have been observed for plastic crystals and condis crystals. Depending on the degree of cooperation necessary between neighboring molecules, narrow or broad glass transition regions result. For some additional information, see Sect. 5.5.
176 2 Basics of Thermal Analysis
__________________________________________________________________
Fig. 2.114
2.5.5 Thermodynamics and Motion
Thermodynamics and motion can be used as a base for an operational definition of the solid state. A solid is a phase below its glassor melting-transition temperature where the molecular motion is almost completely restricted to small-amplitude vibrations. Both transitions are easily determined by thermal analysis (the operation). Recently it has become possible by simulation on supercomputers to establish the link from the microscopic thermal motion of macromolecules to the macroscopic thermal analysis. By solving the equation of motion, one can produce a detailed movie of molecular motion (see Sect. 1.3.4, Fig. 1.47). At high temperature, conformational disorder is seen, i.e., the crystal can change to a condis state. Note that even the conformational motion occurs in a picosecond time scale (see Sect. 5.3.4).
The meaning of the word transition is not specific. In Fig. 2.115 a dictionary definition is listed, which states: Transition means just a passing from one condition to another. The basic transitions of interest to thermal analysis are described in the classification scheme of Fig. 2.103. In the bottom half of Fig. 2.115 the properties of the condensed phases are reviewed and their transitions identified. On the left side, the solid states are characterized by their order. The mobility and degrees of packing are listed at the bottom, and the physical states above the diagram. The mobile mesophases appear at higher temperatures via glass transitions (at Tg) or disordering transitions (at Td). The liquid phase (melt) is reached with an additional transition, the isotropization (at Ti), or by bypassing the mesophases from the glass via a glass transition (at Tg) or a one-step melting from the crystal (at Tm). The liquid is still a condensed phase, meaning that the constituent motifs, the atoms, ions, or molecules, are more or less touching. The gas phase is dilute, in contrast to the condensed