

126—Chapter 6. EViews 5.1 Command Reference Update Summary
See xy (p. 137), and graph for graph declaration and modification, and additional graph types. See also xyline (p. 140) for XY line graphs.
setelem |
Graph Proc |
|
|
Set individual line, bar and legend options for each series in the graph.
Syntax
Graph Proc: |
graph_name.setelem(graph_elem) argument_list |
where graph_elem is the identifier for the graph element whose options you wish to modify:
integer |
Index for graph element (for non-boxplot graphs). For |
|
example, if you provide the integer “2”, EViews will |
|
modify the second line in the graph. |
|
|
box_elem |
Boxplot element to be modified: box (“b”), median |
|
(“med”), mean (“mean”), near outliers (“near” or |
|
“no”), far outliers (“far” or “fo”), whiskers (“w”), sta- |
|
ples (“s”). For boxplot graphs only. |
The argument list for setelem may contain one or more of the following:
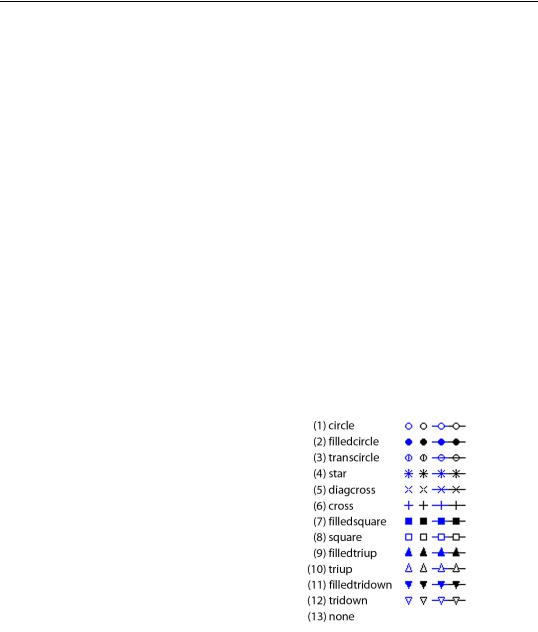
symbol(arg) |
Sets the drawing |
|
|
|
|||
|
symbol: arg can be |
|
|
|
an integer from 1– |
|
|
|
13, or one of the |
|
|
|
matching keywords. |
|
|
|
Selecting a symbol |
|
|
|
automatically turns |
|
|
|
on symbol use. The |
|
|
|
“none” option turns |
|
|
|
off symbol use. |
|
|
|
|
|
|
|
|
|
|
|
|
EViews 5.1 Command Reference Update Summary—127 |
|
|
|
|
|
|
linecolor(args), |
Sets the line and symbol color. The args value may set |
|
|
lcolor(args) |
by using one of the color keywords (e.g., “blue”), or by |
|
|
|
using the RGB values (e.g., “@RGB(255, 255, 0)”). For |
|
|
|
a description of the available color keywords (“blue”, |
|
|
|
“red”, “green”, “black”, “white”, “purple”, “orange”, |
|
|
|
“yellow”, “gray”, “ltgray”). For a full description of the |
|
|
|
keywords, see setfillcolor. |
|
|
|
|
|
|
linewidth(n1), |
Sets the line and symbol width: n1 should be a number |
|
|
lwidth(n1) |
between “.25” and “5”, indicating the width in points. |
|
|
|
|
|
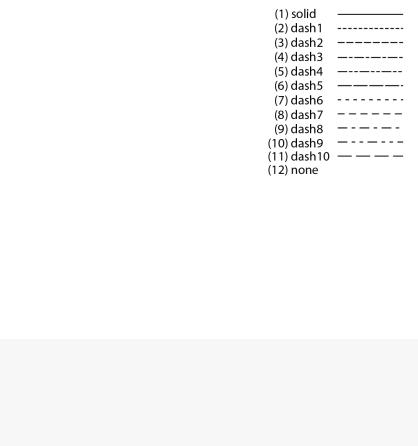
linepattern(arg), lpat(arg)
fillcolor(arg), fcolor(arg)
Sets the line pattern to the type specified by arg. arg can be an integer from 1–12 or one of the matching keywords.
Note that the option interacts with the graph options for “color”, “lineauto”, “linesolid”, “linepat” (see options
(p. 117), for details). You may need to set the graph option for “linepat” to
enable the display of line patterns. See options (p. 117).
Note also that the patterns with index values 7–11 have been modfied since version 5.0. In particular, the “none” option has been moved to position 12.
The “none” option turns off lines and uses only symbols.
Sets the fill color for symbols, bars, and pies. The args value may set by using of the color keywords (“blue”, “red”, “green”, “black”, “white”, “purple”, “orange”, “yellow”, “gray”, “ltgray”) or by using the RGB values (e.g., “@RGB(255, 255, 0)”). For a full description of the keywords, see setfillcolor
128—Chapter 6. EViews 5.1 Command Reference Update Summary
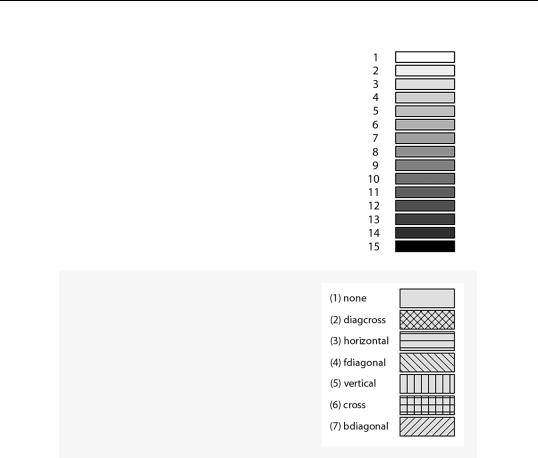
fillgray(n1), gray(n1)
Sets the gray scale for bars and pies: n1 should be an integer from 1–15 corresponding to one of the predefined gray scale settings (from lightest to darkest).
fillhatch(arg), hatch(arg)
Sets the hatch characteristics for bars and pies: arg can be an integer from 1–7, or one of the matching keywords.
preset(n1) |
Sets line and fill characteristics to the specified EViews |
|
preset values, where n1 is an integer from 1–30. Simul- |
|
taneously sets “linecolor”, “linepattern”, “linewidth”, |
|
“symbol”, “fillcolor”, “fillgray”, and “fillhatch” to the |
|
EViews predefined definitions for graph element n1. |
|
When applied to boxplots, the line color of the specified |
|
element will be applied to the box, whiskers, and sta- |
|
ples. |
EViews 5.1 Command Reference Update Summary—129
default(n1)
axis(arg), axisscale(arg)
Sets line and fill characteristics to the specified userdefined default settings where n1 is an integer from 1– 30. Simultaneously sets “linecolor”, “linepattern”, “linewidth”, “symbol”, “fillcolor”, “fillgray”, and “fillhatch” to the values in the user-defined global defaults for graph element n1.
When applied to boxplots, the line color of the specified settings will be applied to the box, whiskers, and staples.
Assigns the element to an axis: left (“l”), right (“r”), bottom (“b”), top (“t”). The latter two options are only applicable for XY and scatter graphs (scat (p. 123), xy (p. 137), xyline (p. 140), xypair (p. 143)).
legend(str) |
Assigns legend text for the element. str will be used in |
|
the legend to label the element. |
|
|
Examples
graph1.setelem(2) lcolor(blue) lwidth(2) symbol(circle)
sets the second line of GRAPH1 to be a blue line of width 2 with circle symbols.
graph1.setelem(1) lcolor(blue)
graph1.setelem(1) linecolor(0, 0, 255)
are equivalent methods of setting the linecolor to blue.
graph1.setelem(1) fillgray(6)
sets the gray-scale color for the first graph element.
The lines:
graph1.setelem(1) scale(l)
graph1.setelem(2) scale(l)
graph1.setelem(3) scale(r)
create a dual scale graph where the first two series are scaled together and labeled on the left axis, and the third series is scaled and labeled on the right axis.
graph1.setelem(2) legend("gross domestic product")
sets the legend for the second graph element.