


Chapter 6. EViews 5.1 Command Reference Update Summary
The following is an alphabetical listing of the commands, views, and procedures in EViews that have undergone substantial updating for Version 5.1.
•addtext (p. 70)
•area (p. 73)
•axis (p. 75)
•bar (p. 77)
•copy (p. 79)
•dbopen (p. 86)
•draw (p. 87)
•drawdefault (p. 89)
•errbar (p. 91)
•fit (p. 93)
•fixedtest (p. 95)
•forecast (p. 96)
•garch (p. 98)
•hilo (p. 99)
•legend (p. 102)
•line (p. 104)
•linkto (p. 106)
•makegarch (p. 111)
•makemap (p. 112)
•pagecreate (p. 113)
•options (p. 117)
•pie (p. 120)
•ranhaus (p. 122)
•scat (p. 123)

70—Chapter 6. EViews 5.1 Command Reference Update Summary
•setelem (p. 126)
•spike (p. 130)
•template (p. 132)
•testadd (p. 134)
•testdrop (p. 135)
•textdefault (p. 136)
•xy (p. 137)
•xyline (p. 140)
•xypair (p. 143)
addtext |
Graph Proc |
|
|
Place text in graphs. |
|
Syntax |
|
Graph Proc: |
graph_name.addtext(options) "text" |
Follow the addtext keyword with the text to be placed in the graph, enclosed in double quotes.
To include carriage returns in your text, use the control “\r” or “\n” to represent the return. Since the backslash “\” is a special character in the addtext command, use a double slash “\\” to include the literal backslash character.
Options
The following options may be provided to change the characteristics of the specified text object. Any unspecified options will use the default text settings of the graph.
font([face], [pt], [+/- b], [+/- i], [+/- u], [+/- s])
Set characteristics of text font. The font name (face), size (pt), and characteristics are all optional. face should be a valid font name, enclosed in double quotes. pt should be the font size in points. The remaining options specify whether to turn on/off boldface (b), italic (i), underline (u), and strikeout (s) styles.
|
|
EViews 5.1 Command Reference Update Summary—71 |
|
|
|
|
|
|
textcolor(arg) |
Sets the color of the text. arg may be one of the pre- |
|
|
|
defined color keywords, or it may be made up of n1, |
|
|
|
n2, n3, a set of three integers from 0 to 255, represent- |
|
|
|
ing the RGB values of the color. For a description of the |
|
|
|
available color keywords (“blue”, “red”, “green”, |
|
|
|
“black”, “white”, “purple”, “orange”, “yellow”, “gray”, |
|
|
|
“ltgray”), see setfillcolor. |
|
|
|
|
|
|
fillcolor(arg) |
Sets the background fill color of the text box. arg may |
|
|
|
be one of the predefined color keywords, or it may be |
|
|
|
made up of n1, n2, n3, a set of three integers from 0 to |
|
|
|
255, representing the RGB values of the color. For a |
|
|
|
description of the available color keywords (“blue”, |
|
|
|
“red”, “green”, “black”, “white”, “purple”, “orange”, |
|
|
|
“yellow”, “gray”, “ltgray”), see setfillcolor. |
|
|
|
|
|
|
framecolor(arg) |
Sets the color of the text box frame. arg may be one of |
|
|
|
the predefined color keywords, or it may be made up of |
|
|
|
n1, n2, n3, a set of three integers from 0 to 255, repre- |
|
|
|
senting the RGB values of the color. For a description of |
|
|
|
the available color keywords (“blue”, “red”, “green”, |
|
|
|
“black”, “white”, “purple”, “orange”, “yellow”, “gray”, |
|
|
|
“ltgray”), see setfillcolor. |
|
The following options control the position of the text:
t |
Top (above the graph and centered). |
|
|
l |
Left rotated. |
|
|
r |
Right rotated. |
|
|
b |
Below and centered. |
|
|
x |
Enclose text in box. |
|
|
The options which support the “-” may be proceeded by a “+” or “-” indicating whether to turn on or off the option. The “+” is optional.
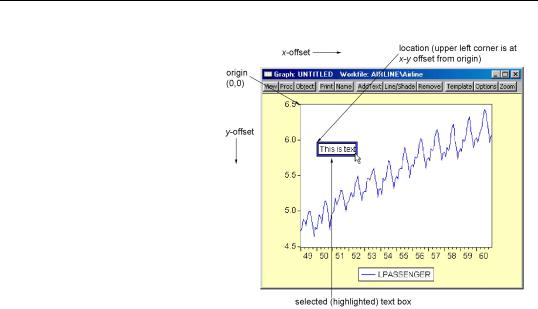
To place text within a graph, you can use explicit coordinates to specify the position of the upper left corner of the text.
72—Chapter 6. EViews 5.1 Command Reference Update Summary
Coordinates are set by a pair of numbers h, v in virtual inches. Individual graphs are always 4 × 3 virtual inches (scatter diagrams are 3 × 3 virtual inches) or a user-speci- fied size, regardless of their current display size.
The origin of the coordinate is the upper left hand corner of the graph. The first number h specifies how many virtual inches to offset to the right from the origin. The second number v specifies how many virtual inches to offset below the origin. The upper left
hand corner of the text will be placed at the specified coordinate.
Coordinates may be used with other options, but they must be in the first two positions of the options list. Coordinates are overridden by other options that specify location.
When addtext is used with a multiple graph, the text is applied to the whole graph, not to each individual graph.
Examples
freeze(g1) gdp.line
g1.addtext(t) "Fig 1: Monthly GDP (78m1-95m12)"
places the text “Fig1: Monthly GDP (78m1-95m12)” centered above the graph G1.
g1.addtext(.2, .2, X) "Seasonally Adjusted"
places the text “Seasonally Adjusted” in a box within the graph, slightly indented from the upper left corner.
g1.addtext(t, x, textcolor(red), fillcolor(128,128,128), framecolor(black)) "Civilian\rUnemployment (First\\Last)"
adds the text “Civilian Unemployment (First\Last)” where there is a return between the “Civilian” and “Unemployment”. The text is colored red, and is enclosed in a gray box with a black frame.