

Encyclopedia of SociologyVol._3
.pdfLONGITUDINAL RESEARCH
DESIGN ISSUES
Although it might be argued that the ideal longitudinal study should take a huge sample of the population without age restriction, measure it constantly, and follow it in perpetuity with systematic supplements to the original sample, cost and logistics intervene. Although there is an infinite range of potential designs, longitudinal studies can be classified on various dimensions including (a) the consistency of the sample over time, (b) population coverage, particularly with regard to age, and
(c) measurement protocols, including not only choice of variables but also timing, interval, and frequency. These factors will influence the extent to which the study can be used for descriptive purposes, relating information to a well-de- fined population, and/or drawing causal inferences on temporal and quasi-experimental aspects of the design.
Consistency of the Sample. The following classification is based on Duncan and Kalton (1987) and on Menard (1991).
1.Repeated Cross-Sectional Surveys. A new sample is drawn at each measurement point. The GSS, described above, is an example. This is a longitudinal study at the macro level. It describes a dynamic population.
2.Fixed-Sample Panel. A sample is drawn at baseline and measured repeatedly over time. No new subjects enter the sample after baseline. Several examples are described above. The sample refers only to the cohorts from which it was drawn. It may continue to represent them adequately if panel attrition is completely at random.
3.Dynamic Sample Panel. After baseline, subjects are added to the panel in an attempt to compensate for panel attrition and represent changes in the underlying population. The PSID is a major example.
4.Rotating Panels. A sample is drawn and interviewed for a fixed number of waves and then dropped. At each measurement point a new sample is also drawn so that samples enter and leave on a staggered basis. The best-known example is the Current Population Survey carried out by
the U.S. Bureau of the Census. At any given time, the sample consists of subjects who have been in the panel from one to four months.
5.Split Panels. In addition to a basic panel survey, a coordinated cross-sectional survey is drawn at each measurement point. In effect, this is a quasi-experimental design in which comparisons between samples permit tests of panel conditioning, among other things. This design is rare.
Population Definition. The broader the population sampled, the wider the potential generalization. On the other hand, homogeneity provides greater leverage for some kinds of causal inference. The following rough classification is useful. See Campbell (1988) for elaboration.
1.Unrestricted Age Range. A sample of the entire (adult) population is selected and followed.
2.Restricted Age Range. A sample of persons in a narrow age band, such as adolescents in developing nations, is selected, with resulting homogeneity of developmental process.
3.Event-Based. A sample is selected on the basis of a particular event. Birth is the prime example; others are motherhood, school completion, business start-up, and administrative reorganization. Subjects can be members of a cohort experiencing the event at a fixed time or can be drawn on a floating baseline, as is the case when each new patient in a given clinic is followed prospectively.
4.Population at Risk. A sample is selected on the likelihood (but not the certainty) that it will experience a particular event.
Although similar to an event-based sample, it is less controlled. Age-restricted samples are usually at risk for certain events, which is one reason for restricting age in the
first place. An interesting example at the macro level is a sample of cities likely to experience a disaster such as an earthquake or a hurricane.
Measurement Protocols. What variables should one measure with what frequency at what time
1687

LONGITUDINAL RESEARCH
intervals? Answering such a question requires a clear appreciation of the linkage between the substantive purpose of an investigation and the mode of data analysis. For example, if one’s intent is to study labor-force participation using event history models, then frequency of measurement would be dictated primarily by (a) the frequency of change of labor-force status among subjects, (b) the amount of variability in individual rates of change, (c) the necessity to obtain exact dates of transitions for the analysis, and (d) the maximum time interval at which subjects can provide reliable and valid recall data. If the investigators have explanatory models in mind, then the measurement protocol will have to deal with similar issues for the regressors.
If one is, however, interested in the effects of widowhood, which might be studied either descriptively or as a quasi-experiment using an interrupted time series approach, very different measurement strategies would be optimal. At the very least, one would try to schedule measurements at fixed intervals preceding and following the event. If economic effects were the primary focus, annual measurement might be sufficient; but if the grief process was the focus, more frequent measurement would be required.
The more undifferentiated the sample, and the more multipurpose the study, the more difficult it is to achieve an effective measurement strategy. Many of the large-scale longitudinal studies carried out since the 1960s have one or more of the following characteristics that tend to interfere with analysis:
1.Multiple substantive foci that result in attempts to measure scores, if not hundreds, of variables.
2.Nonoptimal measurement intervals because of conflicting demands of different kinds of variables and topics. A secondary problem is that intervals are often determined by administrative and funding criteria rather than by substantive intent.
3.Measurement strategies that are chosen without regard to statistical analysis. The problem is acute for event history models
that require dated transitions rather than reports of status at fixed intervals. Other examples are failure to acquire multiple indicators of constructs for LISREL models and intersubject variation in measurement intervals that interferes with growth curve estimation.
4.Weak identification of temporal sequence. This problem is most often a result of a ‘‘snapshot’’ orientation to measurement in which the subject’s status is ascertained at a sequence of fixed measurement points. Knowing that at time 1 someone is married and prosperous and that at time 2 that person is single and poverty-stricken doesn’t tell us much about causal order
or effect.
CAUSAL INFERENCE AND
LONGITUDINAL DESIGN
As noted, the extent to which longitudinal studies allow one to establish causal effects is the subject of some controversy. Indeed, the whole issue of causal inference from nonexperimental data is extremely controversial (Berk 1988; Freedman 1991), with some taking the position that it is impossible in any circumstance other than a randomized design involving an experimentally manipulated stimulus. Although that may be an extreme position, the assumption that one can use time-ordered observational data to establish causal order is difficult to defend.
Cross-sectional analyses and retrospective designs suffer from the fact that variables which are supposed to have time-ordered causal effects are measured simultaneously. As a result, various competing explanations of observed associations, particularly contaminated measurement, cannot be ruled out. Asking about educational aspirations after completion of schooling is an example. Panel designs at least have the advantage of measuring presumed causes prior to their effects. Even in that case, establishing temporal order is not as easy as it might appear. This is particularly true when one attempts to relate intentions, attitudes, and similar
1688

LONGITUDINAL RESEARCH
cognitive variables to behaviors. Marini and Singer (1988) give an example based on education and marriage. Consider two women who leave school and get married. One may have decided to terminate her education in light of a planned marriage, and the other may have decided to marry following a decision to terminate education. The observed sequence of events tells us nothing. They note:
Because human beings can anticipate and plan for the future, much human behavior follows from goals, intentions and motives, i.e., it is teleologically determined. As a result, causal priority is established in the mind in a way that is not reflected in the temporal sequences of behavior or even in the temporal sequence of the formation of behavioral intentions. (Marini and Singer 1988, p. 377)
Because of the many varieties of longitudinal research design and the many controversies in the field, it is difficult to give hard-and-fast rules about when causal inference may be justified. Dwyer (1991), writing for epidemiologists, provides a useful way to approach the problem based on whether there is variance in presumed causes and effects at baseline.
Variation in Independent Variable
|
|
NO |
YES |
|
|
|
|
Variation |
NO |
I |
II |
in Dependent |
|
|
|
|
|
|
|
Variable |
YES |
III |
IV |
|
|
|
|
Examples include the following:
I.Follow crime-free baseline sample through possible arrest, incarceration, and later recidivism.
II.Relate aspirations of eighth graders to eventual level of educational attainment.
III.Carry out an experimental intervention, such as a job training program, that attempts to increase existing skill levels.
IV. Relate organizational characteristics at baseline to later levels of productivity.
Cases I and III can be observational or (quasi-) experimental. Cases II and IV are strictly observational. In each case, although variation may not
exist in the variable of direct interest, there may be variation in closely related variables. In the experimental case, this corresponds to lack of randomization and, thus, uncontrolled variation in potential causal variables. The same is true in purely observational studies. In case II, although there is no variation in the direct outcome of interest, there is often variation in related variables at baseline. In the example given, although there is no variation in educational attainment in terms of years of schooling completed, aspirations are certainly based in part on the child’s prior academic success in the grade school environment. Case IV presents the most difficult situation because it picks up data in the middle of an ongoing causal sequence. This is precisely the situation where many researchers believe that panel data can untangle causal sequence, but neither temporal-se- quenced observations nor complex analysis is likely to do so.
To reiterate an important point about design, in large-scale longitudinal research each of these four cases is typically embedded in a complex design, and the degree of causal inference depends on many factors ranging from the timing of measurement to attrition processes.
COMMON PROBLEMS IN LONGITUDINAL
DATA ANALYSIS
Those who collect and analyze longitudinal data face certain generic problems. Virtually any researcher will face some or all of the following difficulties.
Conceptualizing Change. James Coleman notes that the concept of change is ‘‘a second order abstraction . . . based on a comparison, or difference, between two sense impressions, and, simultaneously, a comparison of the times at which the impressions occurred’’ (1968, pp. 428–429). It is particularly difficult to think about the causes of change, and this difficulty has been reflected in arguments about how to model it. In particular, there has been a running debate about the use of change scores, computed as a simple difference (∆Y = Y2 − Y1) versus a regression approach in which
1689

LONGITUDINAL RESEARCH
the time 2 variable is regressed on time 1 plus other variables. In an influential paper, Bohrnstedt (1970) showed that simple gain scores tended to have very low reliability relative to either variable composing them. In light of that and other problems, Cronbach and Furby (1969) argued that the best way to model change was to treat ‘‘residualized gain scores’’ as dependent variables in regression analysis. The basic equation is
Y2 = a + β1Y1 + β2X1...+βkXk + ε
where Y1 is the baseline measure and the X’s are any set of independent variables. Hence the effect of X is net of the baseline score. This method has become standard in many fields of inquiry.
More recently, a number of papers have appeared that question the use of residualized gain scores. Liker, Augustyniak, and Duncan (1985) argue that equations in which one takes differences on both sides of the model (∆y = α + ß(∆X) + ε) have strong advantages, particularly when one wants to ‘‘difference out’’ unchanging characteristics of subjects. Allison (1990) argues that in some cases the difference score as a dependent variable is not only acceptable but necessary. The issue is not purely statistical; it depends in large part on exactly what process one is attempting to model. Suffice it to say here that an issue which was once thought to be resolved has been reopened for serious examination.
Related to the issue of change scores and their reliability is the problem of regression toward the mean. Whenever a variable is positively correlated over time, subjects with high scores at time 1 will tend to have somewhat lower scores at time 2, while those with lower time 1 scores will tend to have higher scores at time 2. As a result, gain scores will be negatively correlated with initial values. This problem is exacerbated by random measurement error and was a primary reason for the predominance of residualized gain models in the past. Again, however, the issue is one of the underlying model. There are cases where feedback processes do indeed result in regression to the mean (Dwyer 1991) and the regression is by no means an ‘‘artifact.’’ There is no question that one
always needs to correct for measurement error, but regression to the mean should not necessarily be treated as an annoyance to be gotten rid of by statistical manipulation.
Lack of Independence. A standard assumption in elementary statistical models such as least squares regression is that errors are independent across observations. In the equation we typically assume cov(εiεj) = 0. If the same subject is observed at two or more points in time, the independence assumption is almost certain to be violated due to omitted variables, correlated errors of measurement, or other problems. This difficulty permeates virtually all statistical approaches to longitudinal data and requires complex methods of estimation.
Articulating Analysis with Observation Plan.
Ideally, one should have in mind a model for how the underlying process of change in a variable articulates with the observation plan. In part, this requires some knowledge of causal lag or how long it takes for changes in X to result in changes in Y. The data analysis method chosen should be congruent with both the underlying process of change and the observation plan. Observation plans may obtain exact dates of transitions (when did you quit your job?), locate the subject’s state at time t (are you currently working?), or obtain retrospective information relative to some other time point (were you working as of June 30?). Studies that have multiple goals are difficult to optimize in this respect.
Construct Validity. In long-term longitudinal studies, the validity of constructs may degrade over time, sometimes through changes in the subjects themselves, sometimes through measurement problems such as conditioning, and sometimes through changes in the environment. For example, the meaning of terms used in political research such as liberal may change with time, or references to specific issues such as abortion may become more or less salient. In growth studies, subjects may ‘‘age out’’ of certain variables. This issue is quite understudied, at least by sociologists.
Measurement Error. Measurement error is a serious problem for statistical analysis, particularly regression, because it results in biased estimates.
1690

LONGITUDINAL RESEARCH
The problem is particularly acute when independent variables are subject to error. In the longitudinal case, errors of measurement tend to be correlated across subjects over time, causing even greater difficulty. A major reason for the popularity of structural equation packages like LISREL (Jöreskog and Sörbom 1988; Bollen 1989) is that they permit one to model correlated error structures. This is not to say that LISREL is an allpurpose solution; indeed, its error-handling capabilities probably lead to its use in situations where other approaches would be better.
Time-varying Independent Variables. In a typical situation one is faced with a set of fixed independent variables such as age, sex, and race, and a set of variables whose values may change over the course of a study. In studies of income, for example, educational levels and family structure may change between observations. Although work on this problem has been going on in economics for some years (Hsiao 1986), sociologists have been slow to respond. The problem always leads to great statistical and computational complexity.
Missing Data, Attrition, Censoring, and Selection Bias. Attrition in panel studies is inevitable. In rare cases attrition is completely random, but more commonly it is associated with other variables. Standard listwise and pairwise missing data ‘‘solutions’’ are rarely appropriate in this situation. Three types of solutions are available. First, one can develop weights to correct for attrition. Second, one can model the attrition process directly, using ‘‘selection bias’’ models (Heckman 1979; Berk 1983). Finally, one can impute estimates of missing data (Little and Rubin 1987). This entire area is controversial and under rapid development. A special case of attrition occurs when observations are censored in such a way that measurement stops before a transition of interest, such as ending a panel study of fertility before all subjects have completed childbearing.
APPROACHES TO DATA ANALYSIS
The period since 1975 or 1980 has seen enormous increases in the power and sophistication of longitudinal data analysis. Singer (1985) is a useful
overview; Dwyer and Feinleib (1991), especially chapter 1, provides a comprehensive review, as does Von Eye (1990). This material is much too complex to cover in this brief review. A more reasonable goal is to provide a few examples of the kinds of substantive questions that one can ask with longitudinal data and appropriate methods for answering them.
Outcomes at Fixed Points in Time. Example: ‘‘predicting’’ a person’s savings at age sixty-five. This is the simplest longitudinal question; indeed, in one sense it is not longitudinal at all. The dependent variable involves change over time very indirectly, and the independent variables usually involve life cycle variables like the nature of laborforce participation. These data can often be collected retrospectively, and the only advantage of a repeated measures approach is control over measurement error.
It is not uncommon to see models for fixed outcomes at arbitrary time points—for example, level of education attainment as of the last available wave of an ongoing panel study. This is a particular problem when the sample consists of subjects who vary in age or is not defined on the basis of some reasonable baseline. When the outcome is a discrete transition, such as marriage, censoring is often a problem.
Means over Time. Example: Comparison of aspiration levels of boys and girls over the middle school years. With a sequence of independent samples, this is a straightforward analysis-of-vari- ance problem. If the same individuals are measured repeatedly, a number of problems arise. First, the observations are not independent over time; we have to assume that the usual statistical assumption of independence in the error terms will be violated. Within the ANOVA tradition, this problem can be approached via multivariate analysis of variance or as a classic univariate design. Hertzog and Rovine (1985) compare the two approaches. Sociologists have tended to ignore mean comparisons, preferring to work with structural equations; however, analyses of means are often far more direct and informative. See Fox (1984) for an interesting application to an interrupted time series.
1691

LONGITUDINAL RESEARCH
Classic ANOVA ignores individual-level heterogeneity. Over the course of five observation points, students vary about the group means. The description of change at the individual level rather than at the group level may be of some interest. A simple approach is to use ‘‘blocking variables’’ such as race to account for additional heterogeneity. Adding covariates to the model is another. A more sophisticated approach is to model the indi- vidual-level growth curve directly. Conceptually, analysis begins by estimating an equation to describe each respondent’s score with respect to time, often using a polynomial model. The coefficients of these equations are then treated as dependent variables in a second-stage analysis. There are a number of different statistical approaches to this kind of analysis. Rogosa (1988) has argued forcefully in favor of approaching longitudinal analysis in this way. Dwyer (1991) provides an interesting example. McCardle and Aber (1990) deal with such models in a LISREL context.
Structural Equation Systems. Figure 1, based on Blau and Duncan’s classic path model of occupational mobility, is a longitudinal analysis, although it is not often thought of in those terms. For our purposes, the important point is that the exact timing of variables was not assumed to be of great import, although the sequence was. Education was taken to intervene between measures of family background and occupational attainment, and its timing was not specified. The latter variable was assumed to reach some plateau relatively early in the occupational career; again, timing was not important. Models of this kind, with rather vague time referents and in which it is assumed that the order of events does not vary across subjects, have played an important role in sociology for some time, adding great clarity to the notion of intervening variables. It is natural to assume that structural equation models are a natural way to analyze multiwave panel data.
Kessler and Greenberg (1981) deal at length with the application of structural equation models to panel data, particularly to cross-lagged structures where both variables vary at baseline. They show that attempting to estimate relative causal effects must be handled in the context of a formal
Father’s |
Respondent’s |
|
Education |
|
Education |
 Occupation
 in 1962
Father’s |
|
Occupation |
First Job |
Figure 1
NOTE: A Basic Model of Attainment (Adapted from Blau and Duncan 1967)
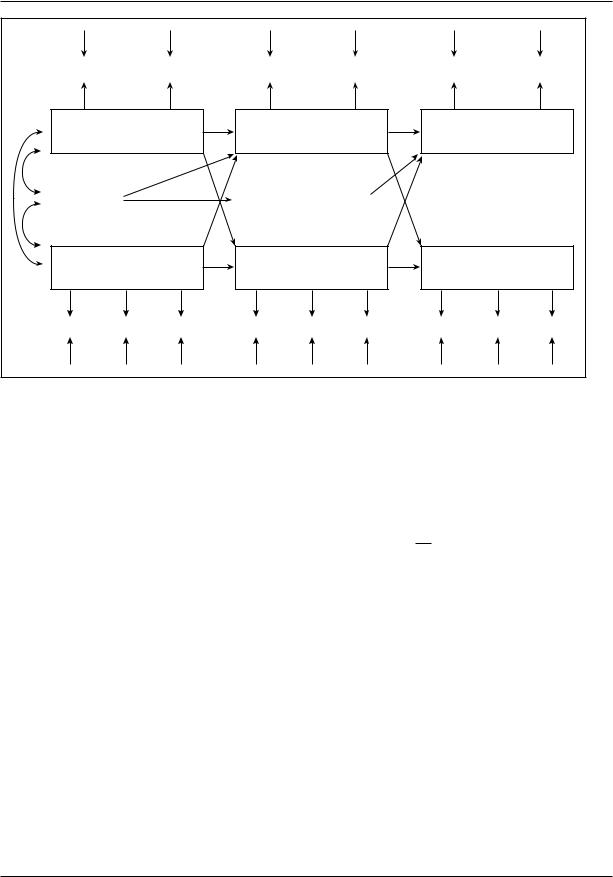
model rather than by comparing cross-lagged partial correlations. Figure 2, based on Campbell and Mutran (1982), is a multiwave panel model with intervening variables. Here, a number of statistical and conceptual difficulties become obvious. First, what is the lag time for the effect of health on income satisfaction and vice versa? Second, how does one deal with the potentially complex error structure of observed variables? Third, if illnesses intervene (as measured by times in hospital), how does the timing of events relative to the timing of observations affect the results? Fourth, how does one deal with discrete intervening variables that fail to meet standard distributional assumptions? Finally, how does one handle correlated errors in equations over time? These are by no means the only questions that could be raised, and it is not clear that models of this kind are the most effective way to approach multiwave panel data.
Event History Models. This class of models treats the underlying rate of change in a discrete variable as the dependent variable in a regressionlike framework. Typically, the dependent variable is conceived of as the instantaneous risk of transition at time t conditional on prior history. The formulation is dynamic rather than static, and time enters the analysis explicitly. Allison (this volume) discusses a number of such models in detail. At first glance, the model may seem mathematically esoteric, but the basic ideas are straightforward. The underlying concepts are closely related to the life table and to Markov models. The Markov model, as applied in the classic labor-force studies of Blumen, Kogen, and McCarthy (1955), assumes a transition process that is constant over time and invariant across subjects. Event history
1692
LONGITUDINAL RESEARCH
SAT 69 |
GET 69 |
SAT 71 |
GET 71 |
SAT 73 |
GET 73 |
|||
|
1969 INCOME |
1971 INCOME |
|
1973 INCOME |
|
|||
|
SATISFACTION |
SATISFACTION |
|
SATISFACTION |
|
|||
INCOME 69 |
|
TIMES IN HOSPITAL 70 |
|
|
|
|||
|
HEALTH 1969 |
HEALTH 1971 |
|
HEALTH 1973 |
|
|||
LIM 69 |
OUT 69 |
PUB 69 |
LIM 71 |
OUT 71 |
PUB 71 |
LIM 73 |
OUT 73 |
PUB 73 |
Figure 2
NOTE: A Model for Health and Income Satisfaction (Adapted from Campbell and Mutron 1982)
models allow one to relax both assumptions, specifying a time-dependent rate of change and a set of individual-level ‘‘covariates’’ that allow transition processes to vary with characteristics of the subjects. Covariates can be allowed to change with time as well, at the cost of substantial computational complexity.
In one of the first applications in sociology, Tuma, Hannon, and Groeneveld (1979) showed that the rate of marital dissolution among subjects in an income-maintenance experiment depended on the treatment condition, thus demonstrating that event models could be used for causal analysis. Event models are inherently dynamic and take the timing of transitions explicitly into account. They are having enormous impact not only on how sociologists analyze data but also on how they conceptualize problems and design data collection.
Differential Equation Models. Coleman (1964, 1968, 1981), among others, has argued that the appropriate way to study change in continuous
variables is via differential equation models. A simple differential equation relating Y to its own level and to an exogenous variable takes the form
dY
dt = a + b1Y + b2X1
where dY/dt is the rate of change in Y with respect to time, that is, the derivative. The rate of change is not directly observed, of course; and to estimate the coefficients of the model, it is necessary to integrate the equation. Coleman (1968) shows that for this particular model, it is possible to obtain estimates of a, b1, and b2 by first estimating a regression equation of the form
Yt = a* + b1*Y(t–1) + b2*X1
using ordinary regression and then transforming the regression coefficients to obtain the coefficients of the differential equation model. In this particular case the coefficients of the differential equation model are
1693

LONGITUDINAL RESEARCH
a |
= |
a*C* |
||
|
∆t |
|||
|
|
|
||
b1 |
= |
|
In b1* |
|
|
∆t |
|||
|
|
|
||
b2 |
= |
|
b2*C* |
|
|
∆t |
|
||
|
|
|
||
where
* |
= |
In b1* |
C |
|
|
|
(b1* – 1)
The resulting coefficients describe the time path of Y as a function of its initial value and the value of X. Note that this model assumes that X is not changing over time. One implication of this model is that if one wishes to assume that Y at time t does not depend on its initial value, then residualized gain score models of the kind described above are inappropriate.
Applications of differential equation models in sociology have been relatively rare, although they would seem to be a natural way to approach the analysis of change. Many of the seemingly endless arguments about the representation of change in regression models stems from the application of static methods to dynamic processes. The difficulty is that it is not easy or always possible to transform the differential equations in such a way that they can be estimated by simple regression. Doing so requires considerable mathematical sophistication on the part of the researcher. Tuma and Hannon (1984) discuss these and related models at length. Arminger (1986) provides an example of how to recast a standard three-wave LISRELbased panel analysis into a differential equation model.
CONCLUSION
It is no accident that words like controversial and under discussion recur frequently in this review. Many important issues regarding the collection, analysis, and interpretation of longitudinal data remain to be resolved. Frequently, what are in fact conceptual issues are argued in statistical terms. The literature is technical and mathematically demanding. But important progress is being made
and will continue as new methods of research continue to emerge.
(SEE ALSO: Causal Inference Models; Cohort Analysis; Event
History Analysis; Time Series Analysis; Quasi-Experimental
Research Designs)
REFERENCES
Allison, Paul D. 1984 Event History Analysis: Regression for Longitudinal Event Data. Newbury Park, Calif.: Sage.
———1990 ‘‘Change Scores as Dependent Variables in Regression Analysis.’’ In Clifford C. Clogg, ed., Sociological Methodology, Vol. 20. London: Basil Blackwell.
———1996 ‘‘Fixed-Effects Partial Likelihood for Repeated Events.’’ Sociological Methods and Research
25:207–222.
Anderson, Edward R. 1993 ‘‘Analyzing Change in ShortTerm Longitudinal Research Using Cohort-Sequen- tial Designs.’’ Journal of Consulting and Clinical Psychology 61:929–940.
Arminger, Gerhard 1986 ‘‘Linear Stochastic Differential Equation Models for Panel Data with Unobserved Variables.’’ In Nancy B. Tuma, ed., Sociological Methodology, Vol. 16. Washington, D.C.: American Sociological Association.
Baltes, Paul B., and John R. Nesselroade 1977 ‘‘History and Rationale of Longitudinal Research.’’ In John R. Nesselroade and Paul B. Baltes, eds., Longitudinal Research in the Study of Behavior and Development. New York: Academic Press.
Barton, Thomas R., Vijayan K. Pillai, and Tracy J. Dietz 1996 ‘‘Program Evaluation Using Event History Analysis.’’ Evaluation Practice 17:7–17.
Berk, Richard A. 1983 ‘‘An Introduction to Sample Selection Bias in Sociological Research.’’ American Sociological Review 48:386–398.
——— 1988 ‘‘Causal Inference in Social Science.’’ In Neil J. Smelser, ed., Handbook of Sociology. Newbury Park, Calif.: Sage.
Bijleveld, Catrien C. J. H. et al. 1998 Longitudinal Data Analysis: Designs, Models and Methods. London: Sage Publications.
Blau, Peter M., and Otis Dudley Duncan 1967 The American Occupational Structure. New York: Wiley.
Blossfeld, Hans-Peter, Goetz Rohwer, and Gotz Rohwer 1995 Techniques of Event History Modeling: New Approaches to Causal Analysis, vol. 31. Mahwah, N.J.: Lawrence Erlbaum Associates.
1694

LONGITUDINAL RESEARCH
Blumen, Isadore, M. Kogan, and P. J. McCarthy 1955
The Industrial Mobility of Labor as a Probability Process. Ithaca, N.Y.: Cornell University Press.
Bohrnstedt, George W. 1969 ‘‘Observations on the Measurement of Change.’’ In Edgar F. Borgatta, ed., Sociological Methodology, Vol. 2. San Francisco: Jossey-Bass.
Bollen, Kenneth A. 1989 Structural Equations with Latent Variables. New York: Wiley.
Campbell, Richard T. 1988 ‘‘Integrating Conceptualization, Design, and Analysis in Panel Studies of the Life Course.’’ In K. W. Schaie, R. T. Campbell, W. Meredith, and S. C. Rawlings, eds., Methodological Issues in Aging Research. New York: Springer.
———, and Elizabeth Mutran 1982 ‘‘Analyzing Panel Data in Studies of Aging.’’ Research on Aging 4:3–41.
Coleman, James S. 1964 Introduction to Mathematical Sociology. New York: Free Press.
———1968 ‘‘The Mathematical Study of Change.’’ In Hubert M. Blalock, Jr., and Ann B. Blalock, eds.,
Methodology in Social Research. New York: McGraw Hill.
———1981 Longitudinal Data Analysis. New York: Basic Books.
Collins, Linda M. 1996 ‘‘Measurement of Change in Research on Aging: Old and New Issues From an Individual Growth Perspective.’’ In J. E. Birren and K. W. Schaie, eds., Handbook of the Psychology Aging. San Diego: Academic Press.
Cook, Nancy R., and James H. Ware 1983 ‘‘Design and Analysis Methods for Longitudinal Research.’’ Annual Review of Public Health 4:1–23.
Cronbach, Lee J., and Leta Furby 1970 ‘‘How We Should Measure Change—Or Should We?’’ Psychological Bulletin 74:32–49.
DeShon, Richard P., Robert E. Ployhart, and Joshua M. Sacco 1998 ‘‘The Estimation of Reliability in Longitudinal Models.’’ International Journal of Behavioral Development 22:493–515.
DiPrete, Thomas A., and David B. Grusky 1990 ‘‘Structure and Trend in the Process of Stratification for
American Men and Women.’’ American Journal of Sociology 96:107–143.
Duncan, Greg J., and Graham Kalton 1987 ‘‘Issues of Design and Analysis of Surveys Across Time.’’ International Statistical Review 55:97–117.
Duncan, Greg J., and James Morgan 1985 ‘‘The Panel Study of Income Dynamics.’’ In Glen H. Elder, ed.,
Life Course Dynamics: Trajectories and Transitions, 1968– 1980. Cambridge: Cambridge University Press.
Duncan, Terry E. et al. 1999 An Introduction to Latent Variable Growth Curve Modeling: Concepts Issues, and
Applications. Mahwah, N.J.: Lawrence Erlbaum
Associates.
Dwyer, James 1991 ‘‘Overview of Models for Longitudinal Data.’’ In James Dwyer and Manning Feinleib, eds., Statistical Models for Longitudinal Studies of Health. Oxford: Oxford University Press.
———, and Manning Feinleib (eds.) 1991 Statistical Models for Longitudinal Studies of Health. Oxford: Oxford University Press.
Featherman, David L. 1977 ‘‘Retrospective Longitudinal Research: Methodological Considerations.’’ Journal of Economics and Business 32:152–169.
Fox, John 1984 ‘‘Detecting Change in Level and Slope in Repeated Measures Analysis.’’ Sociological Methods and Research 12:263–278.
Freedman, David A. 1991 ‘‘Statistical Models and Shoe Leather.’’ In Peter V. Marsden, ed., Sociological Methodology. Oxford: Basil Blackwell.
Freedman, Deborah, Arland Thornton, Donald Camburn, Duane Alwin, and Linda Young-DeMarco 1988 ‘‘The Life History Calendar: A Technique for Collection of Retrospective Data.’’ In Clifford C. Clogg, ed., Sociological Methodology, Vol. 18. Washington D.C.: American Sociological Association.
Goodman, Jodi S., and Terry C. Blum 1996 ‘‘Assessing the Non-Random Sampling Effects of Subject Attrition in Longitudinal Research.’’ Journal of Management 22:627–652.
Gottman, John-Mordechai 1995 The Analysis of Change. Mahwah, N.J.: Lawrence Erlbaum Associates.
Heckman, James J. 1979 ‘‘Sample Selection Bias as a Specification Error.’’ Econometrica 47:153–161.
———, and Burton Singer 1985 Longitudinal Analysis of Labor Market Data. Cambridge: Cambridge University Press.
Hertzog, Christopher, and Michael Rovine 1985 ‘‘Re- peated-Measures Analysis of Variance in Developmental Research: Selected Issues.’’ Child Development 56:787–809.
Hsiao, Cheng 1986 Analysis of Panel Data. Cambridge:
Cambridge University Press.
Inter-University Consortium for Political and Social Research 1991 Guide to Resources and Services. Ann Arbor, Mich.: Institute for Social Research.
Jöreskog, Karl G., and Dag Sörbom 1988 LISREL 7: A Guide to the Program and Applications. Chicago: SPSS.
Kessler, Ronald C., and David F. Greenberg 1981 Linear Panel Analysis: Models of Quantitative Change. New York: Academic Press.
1695

LOVE
Lazarsfeld, Paul R., and M. Fiske 1938 ‘‘The ‘Panel’ as a New Tool for Measuring Opinion.’’ Public Opinion Quarterly 2:596–612.
Lieberson, Stanley 1985 Making It Count. Berkeley: University of California Press.
Liker, Jeffrey, Susan Augustyniak, and Greg J. Duncan 1985 ‘‘Panel Data and Models of Change: A Comparison of First Order Difference and Conventional Two-Wave Models.’’ Social Science Research 14:80–101.
Little, Roderick J. A., and Donald B. Rubin 1987 Statistical Analysis with Missing Data. New York: Wiley.
Magnusson, David et al. 1994 Problems and Methods in Longitudinal Research: Stability and Change. Cambridge: Cambridge University Press.
Marini, Margaret M., and Burton F. Singer 1988 ‘‘Causality in the Social Sciences.’’ In Clifford C. Clogg, ed., Sociological Methodology, Vol. 18. Washington, D.C.: American Sociological Association.
Maxwell, Scott E. 1998 ‘‘Longitudinal Designs in Randomized Group Comparisons: When will Intermediate Observations Increase Statistical Power?’’ Psychological Methods 3:275–290.
McArdle, John J. 1998 ‘‘Modeling Longitudinal Data by Latent Growth Curve methods.’’ In G. A. Marcoulides, ed., Modern Methods for Business Research. Methodology for Business and Management. Mahwah, N.J.: Lawrence Erlbaum Associates.
———, and Mark S. Aber 1990 ‘‘Patterns of Change within Latent Variable Structural Equation Models.’’ In Alexander von Eye, ed., Statistical Methods in Longitudinal Research, Vol 1. San Diego, Calif.: Academic Press.
McPhee, Robert D. 1998 ‘‘Alternate Approaches to Integrating Longitudinal Case Studies.’’ In George P. Huber and Andrew H. Van de Ven, eds., Longitudinal Field Research Methods: Studying Processes of Organizational Change. Thousand Oaks, Calif.: Sage.
Menard, Scott 1991 Longitudinal Research. Newbury Park,
Calif.: Sage.
Migdal, Susan, Ronald P. Abeles, and Lonnie R. Sherrod 1981 An Inventory of Longitudinal Studies of Middle and Old Age. New York: Social Science Research Council.
Nielson, Francois, and Rachel A. Rosenfeld 1981 ‘‘Substantive Interpretations of Differential Equation Models.’’ American Sociological Review 46:159–174.
Petersen, Trond 1993 ‘‘Recent Advances in Longitudinal Methodology.’’ Annual Review of Sociology 19:425–454.
Pitts, Steven C., Stephen G. West, and Tein Jenn-Yun 1996 ‘‘Longitudinal Measurement Models in Evaluation Research: Examining Stability and Change.’’
Evaluation and Program Planning 19:333–350.
Raykov, Tenko 1993 ‘‘On Estimating True Change Interrelationships with Other Variables.’’ Quality and Quantity 27:353–370.
Rogosa, David 1988 ‘‘Myths About Longitudinal Research.’’ In K. W. Schaie, R. T. Campbell, W. Meredith, and S. C. Rawlings, eds., Methodological Issues in Aging Research. New York: Springer.
———, and Hilary Saner 1995 ‘‘Longitudinal Data Analysis Examples with Random Coefficient Models.’’ Journal of Educational and Behavioral Statistics 20:149–170.
Rovine, Michael J, and Pete C. M. Molenaar 1998 ‘‘A Nonstandard Method for Estimating a Linear Growth Model in LISREL.’’ International Journal of Behavioral Development 22:453–473.
Singer, Burton 1988 ‘‘Longitudinal Data Analysis.’’ In Samuel Kotz and Norman Johnson, eds., Encyclopedia of Statistical Sciences, Vol. 5. New York: Wiley.
Smith, Tom W. 1986 ‘‘The International Social Survey Program.’’ Journal of Official Statistics 2:337–338.
Speer, David C., and Paul E. Greenbaum 1995 ‘‘Five Methods for Computing Significant Individual Client Change and Improvement Rates: Support for an Individual Growth Curve Approach.’’ Journal of Consulting and Clinical Psychology 63:1044–1048.
Thornberry, Terence P., Beth Bjerregaard, and William Miles 1993 ‘‘The Consequences of Respondent Attrition in Panel Studies: A Simulation Based on the Rochester Youth Development Study.’’ Journal of Quantitative Criminology 9:127–158.
Tuma, Nancy Brandon, and Michael T. Hannan 1984
Social Dynamics: Methods and Models. Orlando, Fla.: Academic Press.
Vermunt, Jeroen K. 1997 Log-linear Models for Event Histories. Thousand Oaks, Calif.: Sage.
von Eye, Alexander 1990 Statistical Methods in Longitudinal Research. San Diego: Academic Press.
Wall, W. D., and H. L. Williams 1970 Longitudinal Studies and the Social Sciences. London: Heinemann.
RICHARD T. CAMPBELL
LOVE
Sociologists agree that love is one of the most complex and elusive concepts to deal with from a scientific point of view. Indeed, they often point out that poets, novelists, and musical composers are much more adept at producing eloquent expressions about this pervasive sentiment. Dictionary definitions are of limited use in categorizing
1696