

nanotechnology / nano6_12_031
.pdfINSTITUTE OF PHYSICS PUBLISHING |
NANOTECHNOLOGY |
Nanotechnology 17 (2006) 3002–3007 |
doi:10.1088/0957-4484/17/12/031 |
Backbone-induced effects in the charge transport efficiency of synthetic DNA molecules
Enrique Macia´1 and Stephan Roche2
1 Departamento de Fisica de Materiales, Facultad CC F´ısicas, Universidad Complutense de Madrid, E-28040, Madrid, Spain
2 |
´ |
|
DSM/DRFMC/SPSMS, Commissariat a` l’Energie Atomique, 17 avenue des Martyrs 38054 |
Grenoble, France
Received 21 March 2006, in final form 18 April 2006
Published 2 June 2006
Online at stacks.iop.org/Nano/17/3002
Abstract
We report on a theoretical study pointing out the fundamental role of the backbone energetics in the charge transfer efficiency of polyG–polyC and polyA–polyT chains. The double-strand DNA (ds-DNA) molecules are modelled in terms of a single channel effective Hamiltonian. By introducing a two-step renormalization scheme analytical results for the energy spectrum and transmission coefficient are derived, and current–voltage characteristics are numerically investigated. Significant modulations of the main I –V features (voltage threshold, current amplitude) are reported and their physical origin is traced back to backbone-induced electronic effects. These results open new perspectives for experimental work aimed at controlling the charge transfer efficiency in nanodevices based on synthetic DNA.
The issue of charge transfer through DNA molecules has been the subject of intense debate in recent years [1]. Duplex DNA molecules can be classified into biological samples and synthetic nucleic acids, like poly(dG)–poly(dC) or poly(dA)–poly(dT) chains, where relatively few base pairs (bps) are periodically arranged. These artificially engineered molecules are quite different from the biological ones, in which thousands to millions of bps, including four different nucleotides, are aperiodically distributed [2]. Notwithstanding, a common charge transport mechanism is currently envisioned on the basis of aromatic base stacking between adjacent nucleotides promoting charge delocalization over a certain length scale. The transport may then result from either coherent (superexchange) [3] or incoherent (phonon-assisted sequential tunnelling) processes [4]. Several experimental measurements, directly probing the electric current as a function of the potential applied across synthetic DNA molecules, have evidenced the presence of a conduction gap in the current–voltage (I –V ) curves at room temperature [5], even in the presence of an unordered sequence of bps [6]. Different physical mechanisms have been proposed to account for the opening of such a gap, including base pairing anisotropy effects [7], sugar–phosphate backbone hybridization effects [8], Coulomb repulsion between bases [9], or inelastic electron–phonon scattering
events [10]. First-principles band structure calculations of short (5–12 bp) polyG–polyC chains in acidic dry conditions reveal the presence of two narrow bands (G-HOMO bandwidth50 meV; C-LUMO bandwidth 300 meV) close to the Fermi level and a HOMO–LUMO band gap of about 1–3 eV [11]3. The possible existence of resonant band tunnelling in synthetic DNAs has been proposed [13], and recent experiments suggest the presence of current flowing through the G-HOMO states of polyGC–polyGC chains, located about 1.2–1.5 eV below the Fermi level of the Au(111) contact used in the experiment [14]. On the other hand, the construction of effective tight-binding models has been crucial in identifying the main origin of several current–voltage features [4, 8], although the relative contributions of aromatic base stacking delocalization versus backbone-induced electronic effects remain unsettled to date, and some numerical results indicate that the counterions of the phosphate group could play a role in determining the conductance [15].
Broadly speaking, the electronic DNA energetics includes three different contributions related to the nucleobase system, the backbone system and the environment. Environmental effects are related to the presence of counterions and water
3 Experimental measurements have reported wider gaps within the range 7– 10 eV, mainly attributed to solvent effects [12].
0957-4484/06/123002+06$30.00 © 2006 IOP Publishing Ltd Printed in the UK |
3002 |
Backbone-induced effects in the charge transport efficiency of synthetic DNA molecules
molecules, interacting with the nucleobases and the backbone by means of hydration, solvation and charge transfer processes. The energy scale of these interactions (1–5 eV) is about one order of magnitude larger than the hydrogen bonding between Watson–Crick pairs4 (0.4–0.9 eV), [17], and about two orders of magnitude larger than the base stacking energies (0.01– 0.4 eV) [17, 18]. In addition, the nucleobase system can interact with the backbone one by means of the coupling between the bases and the sugar moiety, a process involving bonding energies of about 1 eV [19]. The actual values of most of these interactions depend on environmental effects either in a direct way (Coulomb interactions) or indirectly, through charge rearrangements in the system. Keeping in mind this complex energy network we can hierarchically arrange the different parameters included in our tight-binding model, ranging from high energy values related to the on-site energies of the bases (7–10 eV) and sugar–phosphate groups ( 5 eV) [17, 19], to intermediate energy values related to the coupling between the complementary bases and the base–sugar interaction, and ending up with the aromatic base stacking low energies.
Depending on the parameters included in the effective Hamiltonian, several kinds of DNA model have been discussed
in |
the literature. Thus, earlier |
models |
explicitly |
included |
a |
transport channel associated |
to the |
possible |
hopping |
of charge carriers between successive phosphate groups along the backbone [7, 20, 21]. However, first-principles calculations showing that the phosphate molecular orbitals are systematically below the base related ones do not favour the presence of a backbone transport channel [1, 22]. On the other hand, quantum mechanical studies show that hydrogen bonding interaction gives rise to a spatial separation of the HOMO and LUMO in the nucleobase system, so that hole (electron) transfer proceeds through the purine (pyrimidine) bases, where the HOMO (LUMO) carriers are located in polyG–polyC (polyA–polyT), respectively [23, 24]. Accordingly, in our model we shall consider that the charge transfer mainly proceeds through the aromatic base stacking low energy channel.
In this work we introduce a renormalization approach aimed at describing the energetics of realistic double-stranded (ds) DNA chains in terms of an effective one-dimensional tight-binding model accounting for the nucleobase system interactions (hydrogen bonding and aromatic base stacking), the coupling of the sugar groups to the neighbouring bases, and the backbone interaction with its close environment (water molecules and counterions) in a unified way. Analytical expressions describing the energy and transmission spectra are derived from a model Hamiltonian, demonstrating the important role played by backbone-induced electronic effects, which significantly alter the overall structure of transmission bands. The resulting variations of charge transfer efficiency are further analysed by numerically computing the main features of the I –V curves at zero temperature.
4 The precise nature of hydrogen bonding in Watson–Crick bps has been the subject of number of recent quantum chemistry studies indicating that the orbital interaction accounts for about 40% and the electrostatic attraction about 60% of all attractive forces (see Fonseca Guerra et al [16]). Taking the value 25 kcal mol−1 for the G–C energy coupling, the figure corresponding to the orbital overlapping yields tGC 0.4 eV. This transfer integral value is significantly larger than that reported from first-principles band structure calculations for guanine ribbons (see Calzolari et al [16]).
a) |
|
|
|
b) |
|
|
|
|
|
c) |
|
|
|
|
|
d) |
|
|
|||||
|
|
|
|
|
|
|
|
|
|
|
|
|
|
|
|
|
|
|
|
|
|
|
|
|
|
|
|
|
|
|
|
|
|
|
|
|
|
|
|
|
|
|
|
|
|
|
|
|
|
|
|
|
|
|
|
|
|
|
|
|
|
|
|
|
|
|
|
|
|
|
|
|
|
|
|
|
|
|
|
|
|
|
|
|
|
|
|
|
|
|
|
|
|
|
|
|
|
|
|
|
|
|
|
|
|
|
|
|
|
|
|
|
|
|
|
|
|
|
|
|
|
|
|
|
|
|
|
|
|
|
|
|
|
|
|
|
|
|
|
|
|
|
|
|
|
|
|
|
|
|
|
|
|
|
|
|
|
|
|
|
|
|
|
|
|
|
|
|
|
|
|
|
|
|
|
|
|
|
|
|
|
|
|
|
|
|
|
|
|
|
|
|
|
|
|
|
|
|
|
|
|
|
|
|
|
|
|
|
|
|
|
|
|
|
|
|
|
|
|
|
|
|
|
|
|
|
|
|
|
|
|
|
|
|
|
|
|
|
|
|
|
|
|
|
|
|
|
|
|
|
|
|
|
|
|
|
|
|
|
|
|
|
|
|
|
|
|
|
|
|
|
|
|
|
|
|
|
|
|
|
|
|
|
|
|
|
|
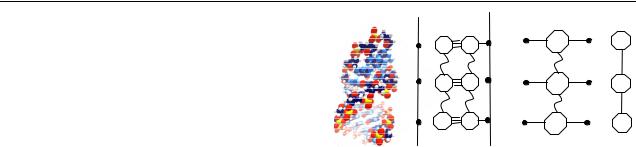
Figure 1. Sketch illustrating the two-step renormalization process mapping the ds-DNA chain into a linear monatomic lattice. (a) Atomistic picture of a DNA polyG–polyC molecule (from [11]). (b) Starting ds-DNA effective tight-binding model. (c) Renormalized model after the first decimation step. (d) Renormalized model after the second decimation step.
(This figure is in colour only in the electronic version)
The ds-DNA poly(dG)–poly(dC) chain shown in figure 1(a) is described in terms of the tight-binding model shown in figure 1(b) (the model for a poly(dA)–poly(dT) chain is completely analogous), where ε j , with j = {G, C} (alternatively, j = {A, T}), are the on-site energies of the bases, t j is the hopping integral between the sugar’s oxygen atom and the base’s nitrogen atom5, and tGC (tAT) respectively describe the hydrogen bonding between complementary bases. The backbone’s contribution is described by means of the on-site energies γ j . In general, these energies will depend on the nature of the neighbouring base as well as the presence of water molecules and/or counterions attached to the backbone.
In order to obtain a simple mathematical description keeping most of the relevant physical information, one introduces a two-step renormalization process as follows. Attending to the hierarchical nature of the previously discussed DNA energetics we will start by focusing on the high energy interactions within the nucleobase system, neglecting, for the moment, the presence of the π couplings between the basepairs. Accordingly, the Watson–Crick bps are first renormalized to obtain the branched tight-binding model shown in figure 1(c). The renormalized on-site energies and
transfer |
integrals |
are respectively given by ε = tGC, and |
τ j = t j |
+ ε j (E |
− γ j )/t j . Note that the renormalized on- |
site energies (given by the hydrogen bonding energy scale) are now about one order of magnitude lower than the original ones (given by the ionization potentials of the nucleobases), so that the effective π –π overlap integral describing the aromatic base stacking between adjacent nucleotides, which had remained dormant during the first decimation step, can now be properly included into the model by means of the hopping integral t0. The topological structure of the renormalized chain shown in figure 1(c) coincides with the Fishbone model originally proposed by Cuniberti and coworkers [8], but in our model the renormalized parameters ε and τ j entail substantial physicochemical information concerning nucleotide interactions along with backbone gating
5 According to quantum calculations reported by Unge et al [25]; the orbital overlapping between the sugar carbon and nucleobase nitrogen atoms forming the glycosidic bond is almost negligible for G-sugar and A-sugar nucleosides. In the case of C-sugar and T-sugar moieties such overlapping gives rise to a small shift of the on-site base energies of about 0.12 eV.
3003

E Maci´ and S Roche
effects, hence substantially extending previous treatments, where Watson–Crick bps were treated as single on-site centres. Next, the backbone contribution is decimated to obtain the one-dimensional lattice shown in figure 1(d), where the renormalized on-site energies are given by α(E) = ε + τG2 /(E −γG)+τC2/(E −γC). In this way, the original poly(dG)– poly(dC) chain is mapped into the equivalent monatomic lattice shown in figure 1(d), where the renormalized ‘atoms’ correspond to the Watson–Crick complementary pairs in the DNA molecule. The renormalized lattice includes eight physical parameters, {ε j , t j , γ j , tGC, t0}, fully describing the basic energetics of the DNA molecule in terms of two variables only (i.e., α, t0). We recall that we are considering a singlechannel model for charge carrier propagation through the DNA duplex. In some recent works, similar renormalization approaches have been introduced to discuss multichannel transport [20, 21, 26].
In order to ascertain the intrinsic DNA electrical transport properties, one must pay a particular attention to the role of contacts [27]. On the one hand, transport experiments have shown that chemical bonding between DNA and metal electrodes is a prerequisite for achieving reproducible conductivity results [1, 5, 6, 9, 28]. On the other hand, if the bonding strength is too strong we should consider the states belonging to the coupled molecular–metallic system rather than those of the molecular subsystem alone [29]. Fortunately, in the DNA–metal junction case, one can mostly restrict the analysis to the weak coupling limit [1, 27]. Accordingly, the effective Hamiltonian describing the ds-DNA in between two metallic leads will be written as [3, 30]
N
H = α(E)cn†cn − t0cn†cn+1 + h.c.
n=1
− τ c†c1 + c† + cN + h.c.
0 N 1
−∞
+εmck†ck − tmck†ck+1 + h.c.
k=0 |
|
|
+∞ |
εmck†ck − tmck†ck+1 + h.c. , |
|
+ |
(1) |
|
k=N +1 |
|
|
where cs (cs†) |
is the creation (annihilation) operator |
for a |
charge at sth site in the chain. The first term describes the charge carrier propagation through the DNA chain in terms of the renormalized variables α(E) and t0. The second term describes the DNA–metal contacts, where τ measures the coupling strength between the leads and the end nucleotides, roughly describing bonding effects at the interface, and the last two terms describe the metallic leads at both sides of the DNA chain, modelled as semi-infinite one-dimensional chains of atoms with one orbital per site, where εm is the on-site energy and tm is the hopping term.
Within the framework of the transfer matrix formalism the dispersion relation of the renormalized DNA chain shown in figure 1(d) (assuming periodic boundary conditions) is
N
given by cos(q L) = 12 Tr[Qα ], where q is the wavevector, L is
the chain length, N is the bp number, and |
|
|||
Qα |
≡ |
1 |
0 |
(2) |
|
2x |
−1 , |
||
where x = (E − α)/2t0. Making use of the Cayley–Hamilton theorem for unimodular matrices, one obtains
QN |
= |
UN |
−UN −1 |
, |
(3) |
α |
UN −1 |
−UN −2 |
|
|
where Um (x) ≡ sin [(m + 1)θ ]/ sin θ , with x ≡ cos θ , are Chebyshev polynomials of the second kind, satisfying the recurrence relationship Um+1 − 2xUm + Um−1 = 0. Taking into account the expression Um − Um−2 = 2 cos(mθ ), the dispersion relation can be expressed as E = α(E) + 2t0 cos ϕ, where ϕ ≡ q L/N . This expression has the typical form for a monatomic chain, though in this case the renormalized on-site energy α explicitly depends on the charge carrier energy E. In fact, the explicit expression for the dispersion relation reads
E − |
|
[t2j + ε j (E − γ j )]2 |
= tGC + 2t0 cos ϕ, (4) |
j |
t2j (E − γ j ) |
leading to an energy spectrum composed of three bands in the general case. Nevertheless, recent x-ray experiments indicated that counterions condense around nucleic acid chain in a tightly bound layer, in agreement with early model calculations [31]. Accordingly, a homogeneous charge distribution through the backbone can be assumed as a first approximation, that is γ j ≡ γ . In addition, since all the nucleobases are attached to the backbone sugars through similar glucosidic C–N bonds it is reasonable to assume t j ≡ t as well. In that case, equation (4) takes a quadratic dependence in energy given by
|
|
|
AE2 + B(ϕ)E + C(ϕ) = 0, |
|
(5) |
|||||||||||||||||
where A ≡ a12 |
− 1, B(ϕ) ≡ a0 + γ (1 − 2a1) + 2t0 cos ϕ, |
|||||||||||||||||||||
and C(ϕ) |
≡ |
2t |
+ |
|
|
1 |
2− 0 |
−2 |
2 |
|
|
|
|
|
≡ |
tGC |
+ |
|||||
|
|
γ (a |
γ |
a |
2t0 cos ϕ), with a0 |
|
|
|||||||||||||||
2(εG + εC) and a1 |
≡ (εG + εC)/t . |
Therefore, the energy |
||||||||||||||||||||
spectrum consists of two asymmetric bands of width |
|
|
|
|||||||||||||||||||
|
|
|
|
|
|
|
√ |
|
|
|
√ |
|
|
|
4t |
|
|
|
|
|
||
|
|
|
|
|
|
|
|
|
|
|
|
|
0 |
|
|
|
|
|||||
|
|
WL,R = |
|
|
± − |
− |
|
, |
|
(6) |
||||||||||||
|
|
|
|
2A |
|
|
|
|
|
|||||||||||||
separated by a gap of width |
|
|
|
|
|
|
|
|
|
|
|
|
|
|
||||||||
|
|
|
|
|
|
4t0 − √ |
|
− √ |
|
, |
|
|
||||||||||
|
|
|
|
g |
= |
+ |
− |
|
(7) |
|||||||||||||
|
|
|
|
|
||||||||||||||||||
|
|
|
|
|
|
|
|
|
2A |
|
|
|
|
|
|
|
|
|
||||
where ± |
= (a0 |
± 2t0)2 |
− 8At2 |
+ γ (γ − 2a0 |
4t0). |
|||||||||||||||||
By inspecting equation (7) one realizes that several physical mechanisms contribute to the gap opening in a intertwined fashion, including the backbone charge distribution (γ ), the hydrogen bonding between complementary bases (tGC), the coupling between bps and sugar orbitals (t), the aromatic base stacking between neighbouring bps (t0), and the on-site bases
energies ε j . |
By adopting the values considered in [8], i.e., |
|||||||||||||||||||
ε |
G = |
ε |
C = tGC ≡ 0, and γ |
≡ 0, |
we get a |
|
a |
|
0, so that |
|||||||||||
|
|
E |
2 |
|
2t |
0 = |
1 = |
|
2t |
2 |
|
0, |
||||||||
the dispersion |
relation reduces to |
|
− |
0 |
E cos ϕ |
− |
|
= |
||||||||||||
2 |
+ 2t |
2 |
|
|
|
|
|
|
|
|
|
|||||||||
and + = − = 4(t0 |
|
). In this case the energy spectrum |
||||||||||||||||||
exhibits two symmetric bands of width W = 2t0 separated by a gap of width g = 2 t02 + 2t2 − 2t0, as was previously
reported [8]. Now, if we keep εG = εC = tGC ≡ 0 but allow for γ = 0, one gets ± = (γ 2t0)2 + 8t2, so
that an asymmetric energy spectrum will be obtained in the general case. In particular, we see that the on-site energy at
3004
Backbone-induced effects in the charge transport efficiency of synthetic DNA molecules
|
1 |
|
|
|
|
|
|
0.75 |
|
WL=WR=0.3eV |
|
||
T(E) |
|
γ=0.0 |
|
|||
0.5 |
∆g=0.442eV |
|
|
|||
|
0.25 |
|
|
|
||
|
|
|
|
|
|
|
|
0 |
|
|
|
|
|
|
1 |
|
|
|
|
|
|
|
|
0,6 |
|
|
WL |
|
0.75 |
|
|
|
|
|
|
|
0,4 |
|
|
|
|
|
|
|
|
|
|
|
T(E) |
0.5 |
γ=0.5 |
0,2 |
|
|
WR |
|
|
|
0 |
|
|
|
|
0.25 |
|
2 |
4 |
6 |
|
|
|
0 |
||||
γ [eV]
0 |
|
|
|
|
|
|
1 |
5 |
|
|
|
|
|
|
∆g[eV] |
|
|
|
||
0.75 |
4 |
|
|
|
||
T(E) 0.5 |
3 |
|
|
|
|
γ=1.0 |
2 |
|
|
|
|
||
|
|
|
|
|
|
|
|
1 |
|
|
|
|
|
0.25 |
0 |
1 |
2 |
3 |
4 |
5 |
0 |
||||||
|
|
|
γ [ eV] |
|
|
|
0 |
0 |
0.25 0.5 0.75 |
1 |
1.25 1.5 1.75 |
2 |
-0.5 -0.25 |
Energy [eV]
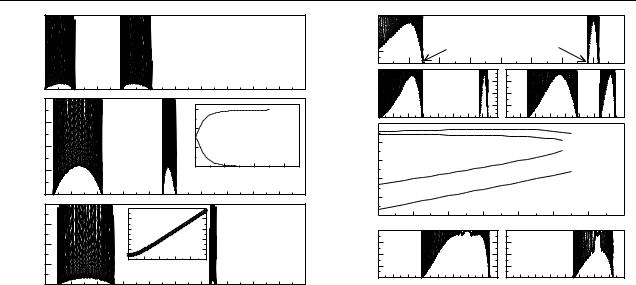
Figure 2. Energy dependence of the transmission coefficient as a function of the injected charges energy at zero bias for
εm = εG = εC = tGC ≡ 0, t0 = 0.15 eV, t = 0.24 eV, tm = 2 eV, τ = 1 eV and γ = 0.0 eV (top panel), γ = 0.5 eV (central panel),
and γ = 1 eV (bottom panel). Starting from the values indicated in the top panel the left (right) transmission band progressively widens (shrinks) as γ is increased (central panel inset). A systematic shift of these bands towards higher energies along with a progressive widening of the band gap is also observed by increasing γ (bottom panel inset).
the sugar–phosphate groups controls the size of the energy gap, along with the structure-dependent transfer integrals t and t0 (whose value will remain essentially constant if the DNA structure does). Gap width variability of poly(dG)–poly(dC) has been experimentally reported [5], and generally attributed to structural fluctuations in the nucleoside distribution along the double helix. Our analytical results, lending support to that view, also highlight the role played by the backbone contribution.
In the absence of any applied voltage the fraction of tunnelling electrons transmitted through a DNA chain of length N is given by the energy-dependent transmission coefficient
TN (E), which is related to the Landauer conductance G(E) = G0TN (E), where G0 ≡ 2e2/ h 12 906−1 −1. The
transmission coefficient can be obtained from the knowledge of the leads’ dispersion relation, E = εm + 2tm cos k, and the matrix elements of the metal–DNA–metal transfer matrix M(N, E) = L N (Qα )N −2 L1 [30], where L1( N ) describe the coupling between the DNA and the metallic contacts. Taking into account equation (3), after some algebra one gets
TN (E) = 1 + |
FUN −1 + (1 − λ2)UN −2 2 |
−1 |
(E − E−)(E+ − E) |
, (8) |
where F ≡ E − εm − 2 cos ϕ, ≡ tm t0/τ , λ ≡ τ /t0, and E± = εm ± 2tm define the allowed spectral window as determined by the metallic leads bandwidth. In figure 2, the energy dependence of the transmission coefficient is shown as a function of the injected charges energy at zero bias, for
|
1 |
|
|
|
|
|
|
|
T(E) |
0.75 |
|
|
γ=0.0 |
|
|
|
|
0.5 |
|
EL(max) |
|
ER(min) |
|
|
||
|
0.25 |
|
|
|
|
|
||
|
|
|
|
|
|
|
|
|
|
0 |
|
|
|
|
|
|
|
|
1 |
|
|
|
|
|
|
|
|
0.75 |
|
|
|
|
|
|
|
T(E) |
0.5 |
|
γ=0.25 |
|
|
γ=0.5 |
|
|
|
0.25 |
|
|
|
|
|
||
|
|
|
|
|
|
|
|
|
|
0 |
|
|
|
|
|
|
|
|
0 |
|
|
|
|
|
ER(max) |
|
|
-2 |
|
|
|
|
|
|
|
[eV] |
|
|
|
|
|
ER(min) |
|
|
-4 |
|
|
|
|
|
EL(max) |
|
|
|
|
|
|
|
EL(min) |
|
||
|
|
|
|
|
|
|
||
Energy |
-6 |
|
|
|
|
|
|
|
|
|
|
|
|
|
|
||
-8 |
|
|
|
|
|
γ [eV] |
|
|
|
|
|
|
|
|
|
|
|
|
-10 0 |
0.1 |
0.2 |
0.3 |
0.4 |
0.5 |
0.6 |
0.7 |
|
1 |
|
|
|
|
|
|
|
T(E) |
0.75 |
γ=0.75 |
|
|
|
γ=1 |
|
|
0.5 |
|
|
|
|
|
|||
|
0.25 |
|
|
|
|
|
|
|
|
0 |
-7 -6 -5 -4 -3 -2 -1 0 -8 -7 -6 -5 -4 -3 -2 -1 0 |
||||||
|
-8 |
|||||||
|
|
|
|
Energy[eV] |
|
|
|
|
Figure 3. Energy dependence of the transmission coefficient as a function of the charge energy at zero bias for εm = εG = 0,
εC = 1.12 eV, tGC = 0.04 eV, t0 = 0.15 eV, t = 1 eV, tm = 2 eV, τ = 1 eV and different values of the backbone coupling (top and
bottom panels). In the central panel the energy spectrum structure, derived from the dispersion relation equation (5), is plotted as a function of the γ value.
different values of γ and N = 60 bp. In order to compare with prior works [8], that correctly reproduced some experimental results [5], we will first consider the effective parameters εG = εC = tGC ≡ 0, t0 = 0.15 eV and t = 0.24 eV. By progressively increasing the γ value, the following features are observed in the transmission spectra.
(i) The left (right) band respectively widens (shrinks). In fact, from equation (6) we get limγ →∞ WL
and limγ →∞ WR |
= 0. Actually, the asymptotic regime |
is reached for γ |
2 eV, as is illustrated in the central |
panel inset of figure 2.
(ii)The transmission bands are progressively shifted towards higher energies.
(iii)The gap between the bands widens, as prescribed by equation (7).
This result suggests an enhanced insulating behaviour as γ is increased keeping all the remaining model parameters fixed, as is shown in the bottom panel inset. Nevertheless, according to equations (6) and (7), the overall structure of the transmission bands is very sensitive to the adopted model parameters. For the sake of illustration, in figure 3 the γ dependence of the transmission spectra is shown for a more realistic choice of the model parameters [18]. In this case, both transmission bands progressively approach each other, eventually merging as the coupling parameter γ is increased (top and bottom panels). We have checked that this behaviour is quite insensitive to the adopted value for the hydrogen bonding strength. In fact, by adopting the large value tGC = 0.9 eV [16], we obtain the same qualitative γ dependence for the bands bounds as that plotted in the central panel for the lower value tGC = 0.04 eV, simply rescaled in energies.
3005
E Maci´ and S Roche
By inspecting figures 2 and 3 one concludes that, depending on the relative position of the Fermi level of the leads and the DNA bands, a seeming semiconductor–metal transition would develop as a result of a modulation of the backbone coupling in the DNA chain. This physical scenario illustrates the difficulty in properly disentangling intrinsic DNA conductance properties from environmental effects on the basis of the experimentally obtained I –V curves alone, and could qualitatively explain the large scatter of the experimental data concerning the conducting properties of DNA. In fact, the presence of a number of counterions located along the DNA sugar–phosphate backbone has been reported from the study of DNA chains obtained from solution. Classical molecular dynamics simulations, in conjunction with large-scale firstprinciples electronic structure calculations, reveal different counterion configurations in which Na+ counterions populate both backbone sites (mainly in the vicinity of negatively charged phosphates) and the grooves of the DNA helix (mainly near the nitrogen electronegative atoms of guanine and adenine) [32]. In this way, phosphate groups can be regarded as a template for a helical wire consisting of sodium ions. These counterion wires give rise to a number of electronic states, most of which could be located in the gap region between the guanine HOMO and cytosine LUMO bands [1, 15, 33]. Accordingly, an additional transport channel may appear, leading to an effective decrease of the system’s gap. In our study, the electronic coupling between the backbone and the water shell plus counterions atmosphere is described in terms of the parameter γ . On the basis of a recent study of H¨uckel parameters for biomolecules we adopt the value γ = 4.5 eV for the unperturbed on-site energy of the backbone phosphate group [19]. A crude estimation of the influence of the cations on this γ value can then be obtained by considering the average charge transfer amount between Na+ ions and phosphate groups, which has been reported to be about 0.60e in dry conditions [15]. This charge transfer leads to a relative variation of the electrostatic Coulomb energy of δU 0.6U 0.6γ = 2.7 eV. This figure indicates that the on-site energy value is significantly reduced due to the presence of cations close to the phosphate group. However, the inclusion of a water shell shields the intensity of the electrostatic effect of cations on the backbone charge distribution, due to solvation effects. Accordingly, we can reasonably consider γ values within the range 2 γ 3 eV as representative reference ones.
|
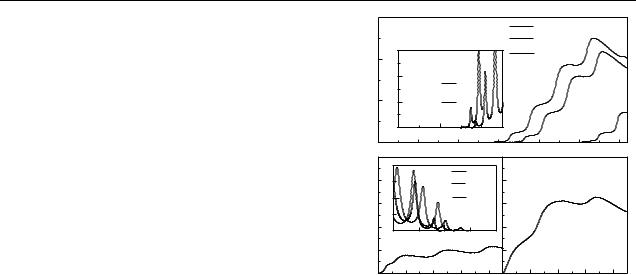
Finally, in figure 4 the I (V ) characteristics of the ds- |
|||||||
DNA studied in figure 2 are |
reported for several values |
|||||||
of |
γ . |
The I –V |
curves |
are numerically |
computed |
at |
||
zero temperature, |
assuming |
a |
linear |
voltage |
drop across |
|||
2e |
DNA |
molecules in the |
usual |
expression I (V ) |
= |
|||
the |
|
|||||||
h |
TN (E, V ) fL(E, T, V ) − fR(E, T, V ) dE [34]. |
To |
||||||
reproduce the potential mismatch at zero bias, the energy difference between the G-HOMO energy level and the metallic Fermi level is set to 1.2 eV [14]. One further assumes εG = εC without affecting the main conclusions of the results. As the voltage drop is switched on, the transmission coefficient becomes voltage-dependent, resulting in transmission band shifts (shown in figure 4 insets), which in turn lead to a voltage threshold modulation. For the case γ = 0 eV (top panel, main frame) the onset of current appears for V 0.25 V, which actually corresponds to the energy interval between
|
3×10⁻⁶ |
|
|
|
|
|
|
|
|
γ=0.00 |
|
|
|
|
|
|
PolyGPolyC (12bp) |
|
|
|
|
|
|||||
|
|
|
|
|
|
γ=0.05 |
|
|
|||||
|
|
|
|
|
|
|
|
|
|
|
|
|
|
I[Amps] |
2×10⁻⁶ |
0.6 |
T(E,V) |
|
|
|
|
γ=0.25 |
|
|
|||
|
|
|
|
|
|
|
|
||||||
|
|
0.4 |
V=0.4 |
|
|
|
|
|
|
|
|||
|
|
|
|
|
|
|
|
|
|
||||
1×10⁻⁶ |
|
V=0.5 |
|
|
|
|
|
|
|
||||
|
0.2 |
|
|
|
|
|
|
|
|||||
|
|
|
0 |
|
|
0.2 |
|
0.4 |
|
|
|
|
|
|
|
0 |
0 |
|
|
|
|
|
|
|
|
||
|
|
0 |
|
0.1 |
|
0.2 |
0.3 |
0.4 |
0.5 |
0.6 |
|||
|
1×10⁻⁵ |
1 |
|
|
|
|
|
|
|
|
|
|
|
|
|
|
|
T(E,V) |
|
V=0.2 |
|
|
|
|
|
||
|
8×10⁻⁶ |
|
|
|
|
|
|
|
|
||||
|
|
|
|
|
|
V=0.4 |
|
|
|
|
|
||
I[Amps] |
6×10 |
-6 |
0.5 |
|
|
|
|
V=0.5 |
|
|
|
|
|
|
|
|
|
|
|
|
|
|
|
|
|
||
4×10 |
-6 |
0 |
|
|
|
|
|
|
|
|
|
|
|
|
|
|
0.1 |
|
0.2 |
|
|
|
|
||||
|
|
|
|
|
|
|
|
|
|||||
|
|
|
0 |
γ=0.5 |
|
|
γ=1.0 |
|
|
||||
|
2×10⁻⁶ |
|
|
|
|
|
|
|
|
||||
|
|
|
|
|
|
|
|
|
|
||||
|
|
00 |
0.1 |
|
0.2 |
0.3 |
0.4 |
0 |
0.1 |
0.2 |
0.3 |
0.4 |
|
|
|
|
|
V[Volts] |
|
|
|
|
V[Volts] |
|
|||
Figure 4. Current–voltage characteristics for various values of γ |
|||||||||||||
assuming |εG − EF| = |εC − EF| = 1.2 eV [14]. Top inset: |
|
||||||||||||
voltage-dependent transmission coefficient for γ = 0 and two |
|
||||||||||||
potential drop values. Bottom inset: voltage-dependent transmission |
|||||||||||||
coefficient for γ |
= 0.5 and three potential drop values. |
|
|
||||||||||
the chosen Fermi level (EF = 0) and the lower bound of the right transmission band (see figure 2). In the interval 0 γ 0.25 eV, the voltage threshold moves in energy, resulting in much lower current at a given bias. For γ = 0.5 eV (left bottom panel) the left transmission band starts to enter within the integration window. As a result, the turn-on current is significantly enhanced at low bias, as compared to the γ = 0 case. This effect is further enhanced by progressively increasing the backbone coupling, as is illustrated in the right bottom panel.
In summary, the backbone-induced effects have been shown to play a major role in the charge transfer efficiency of synthetic ds-DNA molecules, leading to significant changes in the transmission spectrum with subsequent strong impact on the I (V ) characteristics, such as the voltage threshold and the turn-on current capability. Different circumstances may affect the coupling between the sugar–phosphate backbone and the nucleobase system in realistic conditions. Thus, the DNA–substrate and/or DNA–contact interactions, or the chemical nature of the surrounding environment (hydration shells, counterions) are likely to result in effective changes in the energetics of the ds-DNA. On the basis of the obtained analytical expressions, a fundamental mechanism that could drive different kinds of synthetic DNA molecules from a relatively poor conductor behaviour to a much more efficient one has been unveiled. The knowledge gained from this renormalization approach might serve as a recipe to control the transport properties of synthetic DNA-based devices.
Acknowledgments
We gratefully thank E Artacho, R Di Felice, R Gutierrez, and E B Starikov for useful comments. Work at Madrid has been
3006

Backbone-induced effects in the charge transport efficiency of synthetic DNA molecules
supported by the Universidad Complutense de Madrid through project PR27/05-14014-BSCH.
References
[1] Endres R G, Cox D L and Singh R R P 2004 Rev. Mod. Phys. 76 195
Porath D, Cuniberti G and Di Felice R 2004 Top. Curr. Chem.
237 183
Ratner M A 1999 Nature 397 480
[2]Maci´ E 2006 Rep. Prog. Phys. 69 397
[3]Berlin Y A, Burin M L and Ratner M A 2000 Superlatt.
Microstruct. 28 241
Roche S 2003 Phys. Rev. Lett. 91 108101
Zhu Y, Kaun C C and Guo H 2004 Phys. Rev. B 69 245112 [4] Guti´errez R, Mandal S and Cuniberti G 2005 Phys. Rev. B
71 235116
Guti´errez R, Mandal S and Cuniberti G 2005 Nano Lett. 5 1093 Nitzan A 2001 J. Phys. Chem. A 105 2677
[5] Porath D, Bezryadin A, de Vries S and Dekker C 2000 Nature
403 635
Yoo K H et al 2001 Phys. Rev. Lett. 87 198102 Hwang J S et al 2002 Appl. Phys. Lett. 81 1134
Xu B, Zhang P M, Li X L and Tao N J 2004 Nano Lett. 4 1105 [6] Cohen H, Nogues C, Naaman R and Porath D 2005 Proc. Natl
Acad. Sci. 102 11589
Hihath J, Xu B, Zhang P and Tao N J 2005 Proc. Natl Acad. Sci. 102 16979
[7]Iguchi K 2001 J. Phys. Soc. Japan 70 593 Iguchi K 1997 Int. J. Mod. Phys. B 11 2405
[8]Cuniberti G, Graco L, Porath D and Dekker C 2002 Phys. Rev. B 65 241314
[9]Yi J 2003 Phys. Rev. B 68 193103
[10]Feng J F and Xiong S J 2002 Phys. Rev. E 66 021908
[11]Lewis J P, Ordej´on P and Sankey O F 1997 Phys. Rev. B
55 6880
de Pablo P J et al 2000 Phys. Rev. Lett. 85 4992
Adessi Ch and Anantram M P 2003 Appl. Phys. Lett. 82 2353 Wang H, Lewis J P and Sankey O F 2004 Phys. Rev. Lett.
93 016401
[12]See York D M, Lee T S and Yang W 1998 Phys. Rev. Lett. 80 5011
[13]Hjort M and Stafstr¨om S 2001 Phys. Rev. Lett. 87 228101
[14]Xu M S et al 2005 Appl. Phys. Lett. 87 083902
[15]Adessi Ch, Walch S and Anantram M P 2003 Phys. Rev. B 67 081405(R)
[16]Fonseca Guerra C, Bickelhaupt F M and Baerends E J 2002
Cryst. Growth Des. 2 239
Calzolari A, Di Felice R, Molinari E and Garbesi A 2002
Physica E 13 1236
[17]Yan Y J and Zhang H 2002 J. Theor. Comput. Chem. 1 225
[18]Sugiyama H and Saito I 1996 J. Am. Chem. Soc. 118 7063 Voityuk A A, Jortner J, Bixon M and Rosch¨ N 2001 J. Chem.
Phys. 114 5614
[19]Iguchi K 2004 Int. J. Mod. Phys. B 18 1845
[20]Yamada H 2004 Int. J. Mod. Phys. B 18 1697
[21]Xiong G and Wang X R 2005 Phys. Lett. A 344 64
[22]Xu M S et al 2005 Small 1 1168
[23]Starikov E B 2005 Phil. Mag. 85 3435
[24]Artacho E, Machado M, S´anchez-Portal D, Ordej´on P and Soler J M 2003 Mol. Phys. 101 1587
[25]Unge M and Stafstr¨om S 2003 Nano Lett. 3 1417
[26]Klotsa D, Romer¨ R A and Turner M S 2005 Biophys. J.
89 2187
[27]Maci´ E, Triozon F and Roche S 2005 Phys. Rev. B 71 113106
[28]Storm A J, van Noort J, de Vries S and Dekker C 2001 Appl. Phys. Lett. 79 3881
Zhang Y et al 2002 Phys. Rev. Lett. 89 198102
Hartzell B et al 2003 Appl. Phys. Lett. 82 4800
[29]Emberly E G and Kirczenow G 1998 Phys. Rev. B 58 10911
[30]Roche S and Maci´ E 2004 Mod. Phys. Lett. B 18 847 Maci´ E 2005 Nanotechnology 16 S254
[31]Andresen K et al 2004 Phys. Rev. Lett. 93 248103 Das R et al 2003 Phys. Rev. Lett. 90 188103
[32]Barnett R N, Cleveland C L, Joy A, Landman U and Schuster G B 2001 Science 294 567
[33]Gervasio F L, Carloni P and Parrinello M 2002 Phys. Rev. Lett. 89 108102
[34]Mugica V, Kemp M, Roitberg A and Ratner M A 1996
J. Chem. Phys. 104 7296
Kostyrko T 2002 J. Phys.: Condens. Matter 14 4393
3007