

generates 390 psig/ 950°F reheated steam. The unit is equipped with four rows of four low-NOx burners situated on the front wall of the boiler. There are four B&W Ball and Race mills, each supplying pulverized coal to four burners. There is essentially no spare capacity in the mills. If one mill is out of service, boiler capacity declines from 130 to 103 MWe. Shawville Unit 3 is a 180 MWe (net) Combustion Engineering (CE) tangentially-fired, twin-furnace pulverized coal boiler that typically generates 1,200,000 lb/hr of 2450 psig/1020°F steam at full load. It also typically generates 475 psig/980°F reheated steam. The unit is equipped with four rows of eight low-NOx burners situated at the corners of the twin furnaces. There are four CE Raymond Bowl mills, each supplying pulverized coal to eight burners. There is essentially no spare capacity in the mills. If one mill is out of service, the boiler capacity declines from 180 to 135 MWe. If two mills are out of service, oil is used to maintain capacity in the unit (Prinzing and Hunt, 1996).
The test program was designed to test the following issues:
∙The economics of off-site blending of coal and woody biofuels rather than incorporating blending into plant operations
∙The impacts of ground right-of-way trimmings, and ground hybrid poplar grown on reclaimed coal strip mines as biomass feedstocks
∙Potential impacts on the pulverizer circuit and consequences for the operation of the power plant
∙Impacts—if any—on low NOx burners installed in Shawville Generating Station
The tests were conducted in 1995 with primary funding from GPU Genco, supported by EPRI and by USDOE-FETC. Wood was procured from three different sources, ground and screened at an off-site location. It was brought from this location to the Tanoma Coal Tipple, and blended with coal to make up the fuel supply to Shawville Generating Station.
Biofuels were processed prior to blending with coal by grinding (if necessary) in a tub grinder and screening with a combination auger screen/trommel screen to ensure a particle size of less than ¼ inch. The processed sawdust had a bulk density of 19 lbs/ft3 and the processed ROW material had a bulk density of 20 lbs/ft3. The processed short rotation woody crop (SRWC) hybrid poplar had a bulk density of 12 lbs/ft3, indicative of a rapid growth species. The coal had a bulk density of approximately 50 lbs/ft3. Chemical compositions of the fuels are shown in Table 2-6.
Final EPRI Report.doc |
81 |
10/31/01 9:18 PM |
Table 2-6. Characteristics of Individual Fuels Burned During the Shawville Tests
Parameter |
Coal |
Sawdust |
ROW |
SRWC |
Proximate Analysis (Weight Percent) |
|
|
|
|
Moisture |
7.5% |
38.6% |
42.3% |
45.4% |
Ash |
13.0% |
0.4% |
14.5% |
5.4% |
Volatile Matter |
22.7% |
52.5% |
35.7% |
41.4% |
Fixed Carbon |
56.8% |
8.5% |
7.5% |
7.9% |
Ultimate Analysis (Weight Percent) |
|
|
|
|
Carbon |
69.4% |
31.0% |
22.5% |
25.5% |
Hydrogen |
4.0% |
3.6% |
2.6% |
3.0% |
Oxygen |
2.5% |
26.4% |
17.8% |
20.6% |
Nitrogen |
1.2% |
0.0% |
0.3% |
0.1% |
Sulfur |
2.1% |
0.0% |
0.0% |
0.1% |
Chlorine |
0.1% |
0.0% |
0.0% |
0.0% |
Ash |
13.0% |
0.4% |
14.5% |
5.4% |
Moisture |
7.5% |
38.6% |
42.3% |
45.4% |
Higher Heating Value (Btu/lb): |
|
|
|
|
HHV |
12,035 |
5,046 |
3,659 |
4,172 |
The test program evaluated the impact of cofiring on pulverizer performance; and on boiler capacity, efficiency, operability, and airborne emissions. These results have been developed for both Unit #2 and Unit #3. Institutional results included the following:
There was significant evidence that the coal and biofuel industries could team in the arena of fuel supply, producing a blended feedstock; this process, involving blending the wood with the coal, was analogous to blending of different coals to meet a specific specification, however this would provide for a more expensive biomass supply due to the multiple handling operations the “just-in-time” delivery system required by the tight fuel yard impacted the test through more complex and intricate logistics, and this created test limitations; it had significant impacts on the operation of the coal yard as well as the biomass delivery system.
The main impact of cofiring occurred in the pulverizers, both with respect to Unit #2 and Unit #3. Mill fineness was largely not impacted by cofiring at 3 percent by mass biofuel/97 percent coal. Despite difficulties in grinding wood waste, about 80 percent of the pulverized blended fuel always passed 200 mesh, and there was little difference between the coal alone and the wood/coal mixtures.
Mill Amps were impacted both by load and by fuel blend. Three regression equations define these impacts for Unit #2:
TMA,#2coal = 0.0194FR + 105.6 |
|
[3] |
Final EPRI Report.doc |
82 |
10/31/01 9:18 PM |

TMA,#2coal & ROW = 0.0143FR + 117.6 |
[4] |
TMA,#2coal & sawdust = 0.206FR + 110.7 |
[5] |
Where TMA is total mill amps for four mills, and FR is unit firing rate in 106 Btu/hr. Similar regressions exist for Unit #3, as shown below:
TMA,#3coal = 0.0524FR + 76.3 |
[6] |
TMA,#3coal&sawdust = 0.0482FR + 83.6 |
[7] |
TMA,#3 coal,ROW,sawdust,poplar = 0.061FR + 67.1 |
[8] |
In all cases the coefficient of determination (r2) exceeds 0.92 and in most cases the r2 exceeds 0.98. The impact of cofiring on mill amps for Unit #2, as an example, is shown in Figure 2-15
|
|
|
I m p a c t o f 3 % W o o d C o f i r i n g o n M i l l A m p s |
|
|
|
|||
|
|
|
|
S h a w v i l l e U n i t 2 - B a l l & R a c e M i l l s |
|
|
|
||
|
1 4 2 |
|
|
|
|
|
|
|
|
|
|
|
|
C o a l + S a w d u s t |
|
|
C o a l + R O W |
|
|
|
1 4 0 |
|
|
y = 0 . 0 2 0 6 x + 1 1 0 . 7 1 |
|
y = 0 . 0 1 4 3 x + 1 1 7 . 6 4 |
|
||
|
|
|
|
R 2 = 0 . 9 8 6 1 |
|
|
R 2 = 1 |
|
|
|
1 3 8 |
|
|
|
|
|
|
|
|
Mills) |
1 3 6 |
|
|
|
|
|
|
|
|
(Four |
|
|
|
|
|
|
|
|
|
|
|
|
|
|
|
|
B a s e l i n e C o a l |
|
|
Mill Amps |
|
|
|
|
|
|
|
|
|
1 3 4 |
|
|
|
|
|
|
y = 0 . 0 1 9 4 x + 1 0 5 . 5 7 |
|
|
|
|
|
|
|
|
|
R 2 = 0 . 9 6 2 9 |
|
|
1 3 2 |
|
|
|
|
|
|
|
|
|
Total |
|
|
|
|
|
|
|
|
|
|
|
|
|
|
|
|
|
|
|
|
1 3 0 |
|
|
|
|
|
|
|
|
|
1 2 8 |
|
|
|
|
|
|
|
|
|
1 2 6 |
|
|
|
|
|
|
|
|
|
9 0 0 |
1,000 |
1,100 |
1 , 2 0 0 |
1 , 3 0 0 |
1 , 4 0 0 |
1,500 |
1 , 6 0 0 |
1 , 7 0 0 |
|
|
|
|
H e a t I n p u t R a t e ( 1 0 6 B t u / h r ) |
|
|
|
||
Figure 2-15. Impact of Cofiring on Mill Amps at Shawville Unit #2 During Cofiring
For Unit #2, the more significant impact of the cofiring process was to impact mill feeder capacity, as is shown in Table 2-7. Note that mill feeder capacity, reflected in feeder speeds, in turn impacted steam flow and gross unit load. The biofuel, in effect, made the blended fuel behave like very wet coal and reduced overall boiler capacity as a function of mill feeder performance and feeder capacity.
Final EPRI Report.doc |
83 |
10/31/01 9:18 PM |
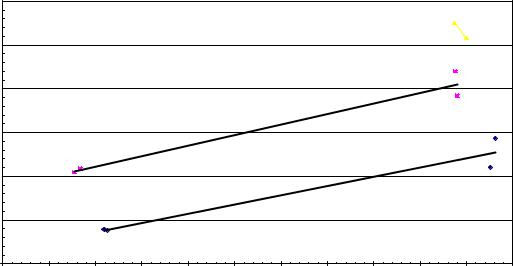
Table 2-7. Unit 2 Average Feeder Speeds and Boiler Capacities Achieved at the Shawville Test
|
Test |
Gross Load |
Steam Flow |
Heat Input |
Feeder Speed |
Fuel Blend |
Number |
(MW) |
(kpph) |
(106Btu/hr) |
(%) |
Full Load Tests: |
|
|
|
|
|
Baseline Coal (100%) |
1 |
132.6 |
895.7 |
1,500 |
72.0 |
Baseline Coal (100%) |
2 |
133.1 |
899.9 |
1,610 |
78.6 |
Coal + 3% Sawdust |
5 |
129.0 |
877.3 |
1,430 |
88.3 |
Coal + 3% Sawdust |
6 |
128.8 |
880.6 |
1,370 |
93.9 |
Coal + 3% Right-of-Way |
9 |
130.0 |
874.1 |
1,460 |
101.6 |
Coal + 3% Right-of-Way |
10 |
128.7 |
858.0 |
1,390 |
105.1 |
The maximum capacity against which the final two tests should be compared is 138 MWe for Unit #2. Cofiring with the biofuel, then, reduced unit capacity by about 9 MWe, or about 6 percent. This is depicted in Figure 2-16.
Impact of 3% Wood Cofiring on Average Feeder Speed
Shawville Unit 2 - Ball & Race Mills with Table Feeders
|
110 |
|
|
|
|
|
|
|
|
|
|
|
|
|
|
|
|
|
|
|
|
Coal + ROW |
|
||
Capacity) |
100 |
|
|
|
|
|
|
|
|
|
|
|
|
|
|
|
|
|
|
|
Coal + Sawdust |
|
|
|
|
|
|
|
|
|
|
|
|
y = 0.4869x + 28.308 |
|
|
||
|
|
|
|
|
|
|
|
R2 = 0.961 |
|
|
|
|
of Max. |
90 |
|
|
|
|
|
|
|
|
|
|
|
|
|
|
|
|
|
|
|
|
|
|
|
|
Speed (Percent |
80 |
|
|
|
|
|
|
|
|
|
|
|
|
|
|
|
|
|
|
|
|
|
|
|
|
Feeder |
70 |
|
|
|
|
|
|
|
|
|
|
|
|
|
|
|
|
|
|
|
|
|
Baseline Coal |
|
|
|
|
|
|
|
|
|
|
|
y = 0.4212x + 19.37 |
|
||
Average |
|
|
|
|
|
|
|
|
|
|
||
|
|
|
|
|
|
|
|
|
|
R2 = 0.9374 |
|
|
60 |
|
|
|
|
|
|
|
|
|
|
|
|
|
|
|
|
|
|
|
|
|
|
|
|
|
|
50 |
|
|
|
|
|
|
|
|
|
|
|
|
80 |
8 5 |
90 |
95 |
100 |
1 0 5 |
110 |
115 |
120 |
125 |
130 |
135 |
Gross Load Achieved (MW)
Figure 2-16. Impact of Cofiring on Ball-and-Race Mill Feeder Speeds at Shawville Generating Station Unit #2
A similar capacity limitation occurred with the mills when firing Unit #3, although the phenomenon causing the limitation was a reduction in mill outlet temperature rather than maximizing feeder speed. This outcome is shown in Figure 2-17 and Table 2-8. The desired mill outlet temperature for Unit #3 is 154oF. At this temperature, the mill accomplishes the requisite fuel drying, while maintaining negative pressure in the pulverizer. Losses in temperature impact the pressure in the pulverizer, and cause the fuel carrier gas (air) to approach dew point. When the carrier gas is below dew point, feeders plug and the unit shuts down.
Final EPRI Report.doc |
84 |
10/31/01 9:18 PM |

|
|
M a x i m u m A c h i e v a b l e C a p a c i t y a s a F u n c t i o n o f M i l l O u t l e t T e m p e r a t u r e |
|
|||||
|
186 |
C a l c u l a t e d V a l u e |
|
|
|
|
|
|
|
|
|
|
|
|
|
|
|
|
184 |
|
|
|
|
|
|
|
|
|
|
|
|
A p p r o x i m a t i o n f o r |
|
|
|
|
|
|
|
|
B a s e l i n e C o a l |
|
|
|
|
|
|
|
|
a t 7 . 3 % M o i s t u r e |
|
|
|
|
182 |
|
|
|
|
|
|
|
|
|
|
|
|
|
|
M e a s u r e d |
|
(MW) |
|
|
|
|
|
|
V a l u e |
|
180 |
|
|
|
|
|
|
|
|
|
|
|
C o a l + 3 % S a w d u s t |
|
|
|
||
Load |
|
|
|
|
|
|
||
|
|
|
y = - 1 . 0 5 5 8 x + 3 3 7 . 9 5 |
|
|
|
||
|
|
|
R 2 |
= 0 . 8 0 0 1 |
|
|
|
|
Gross |
178 |
|
|
|
|
|
|
|
|
|
|
|
|
|
|
|
|
|
176 |
|
|
|
|
|
|
|
|
|
C o a l + 2 % R O W + 1 % S a w d u s t |
|
|
|
|
|
|
|
|
y = - 1 . 1 x + 3 4 1 . 5 |
|
|
|
|
|
|
|
|
R 2 |
= 0 . 8 2 8 8 |
|
|
|
|
|
|
174 |
|
|
|
|
|
|
|
|
172 |
|
|
|
|
|
|
|
|
1 4 8 |
1 4 9 |
150 |
151 |
1 5 2 |
1 5 3 |
1 5 4 |
155 |
|
|
|
|
M i l l O u t l e t T e m p e r a t u r e ( ° F ) |
|
|
|
|
Figure 2-16. Impact of Cofiring on Mill Outlet Temperatures and Capacities at Shawville Unit #3
Table 2-8. Unit 3 Mill Outlet Temperatures at the Shawville Cofiring Test.
Fuel Blend |
Gross Load (MW) |
Fuel Moisture |
Mill Outlet Temp. (°F) |
|
|
(%) |
|
Baseline Coal (100%) |
180.0 |
7.3 |
154 |
Coal + 3% Sawdust |
177.2 |
8.0 |
154 |
Coal + 2% ROW + 1% Sawdust |
175.0 |
9.1 |
151 |
Note that the blended fuel with ROW material in it caused about a 5 MWe loss in capacity, or a 3% loss in capacity. This reduction is proportional to the percentage biofuel in the fuel blend. The reduction in capacity caused by sawdust, 3 MWe or 1.6 percent of capacity, is less severe. Alternatively, the capacity function can be expressed as two regression equations:
GCMW = 1.056MOTF + 338.0 |
[9] |
GCMW = 1.1MOTF + 341.5 |
[10] |
Where GC is gross capacity of the unit expressed in MWe and MOT is mill outlet temperature expressed in oF. Equation 9 relates to the coal/sawdust blend while equation 10 relates to the coal/sawdust-ROW-poplar blend. Through these equations, one can observe that maintaining 154oF mill outlet temperature reduces unit capacity by 3 MWe, or 1.6 percent, when cofiring with 3 percent sawdust; and maintaining 154oF mill outlet temperature while cofiring a 3 percent blend including ROW and hybrid poplar causes an 8 MWe reduction in capacity or a 4.4 percent reduction in unit capacity.
Final EPRI Report.doc |
85 |
10/31/01 9:18 PM |
The Shawville tests also demonstrated that there could be modest impacts on sieve analysis. However the cofiring percentage—3 percent by mass—was sufficiently low that these impacts were limited.
Boiler performance of the Unit #2 and Unit #3 boilers was largely unaffected by the cofiring of a biofuel/coal blend. Boiler efficiencies were calculated within 0.1 percent of the baseline cases, and this is well within the error of estimate. Furnace exit gas temperatures did not decrease significantly. The reduction in SO2 emissions was proportional to the change in fuel, however the 3 percent biofuel/97 percent coal blend was sufficiently close to the baseline that measurement was within the statistical accuracy of the instruments. NOx emissions were largely not impacted by firing the blend, although there was one test where indications were that the biofuel supported early ignition of the coal, increasing the oxides of nitrogen concentration in the flue gas slightly. CO emissions did not change with the cofiring testing.
The conclusion of the Shawville test, then, was to provide the final evidence that the most appropriate method for cofiring woody biofuels in PC boilers is to employ separate injection of the biomass into the boiler. The practice of blending the biomass with the coal prior to introducing it into the pulverizers has significant consequences for mill amps and boiler capacity. Further, these tests demonstrated the high costs associated with off-site blending of the biomass and coal, when double handling is involved.
2.4. OTHER ELEMENTS OF THE INITIAL EPRI COFIRING PROGRAM
The test programs formed the major elements of the EPRI cofiring program, however other research was pursued simultaneously. Further, the EPRI cofiring effort coordinated its analyses with other independent cofiring research.
Under contract to EPRI, Foster Wheeler Environmental evaluated slagging combustion as a means for achieving high percentage (>25 percent, Btu basis) cofiring, and as a means for using biofuels with a high slagging potential. Such fuels include switchgrass and the fertilized energy crops. Miles et. al. (1993) identify biomass materials with high slagging potential as having an alkali content > 0.8 lb/106 Btu and biomass materials with probable slagging potential as having an alkali content > 0.4 lb/106 Btu. Among those with the highest slagging potential as identified by Miles et. al. (1993) are almond shells, refuse derived fuel, switchgrass, wheat straw, and rice straw. Whole tree hybrid poplar chips, urban wood waste, and tree trimmings are among those biomass energy sources identified as having probable slagging problems. The problem is the focal point of research by Baxter (1996a, 1996b) collaborating with Miles and others in analyzing slagging and fouling from biomass combustion.
The concept behind the slagging combustion investigation was to capitalize upon the slagging tendencies of such fuels, using either Babcock & Wilcox cyclones modified to manage a high percentage of biomass in the feed or using one of the more recently proposed slagging combustion technologies. Investigations were made into the use of Coal Tech technology, slagging technology owned by TransAlta of Canada, TRW, and other technology developers.
Final EPRI Report.doc |
86 |
10/31/01 9:18 PM |
The technology was proposed in combination with biomass-based reburning for NOx control. It was proposed both for repowering existing generating stations and for construction of new stand-alone generating stations. Unfortunately the analyses led to the conclusion that slagging combustion of biomass is not economically feasible at this time.
Additional research included developing the initial screening models for evaluating cofiring at existing power plants. These models were based upon the engineering studies and tests performed from 1992 – 1995. They provided screening tools, however the unique features of each candidate power plant led to the conclusion that such screening tools would not be profitable to pursue. As part of the screening modeling effort, however, Foster Wheeler began the development of a biomass fuels database. This database was completed under the USDOE-EPRI Cooperative Agreement (Prinzing, 1996).
The initial EPRI Cofiring program also involved discussions with a wide range of utilities to summarize their experiences in cofiring, and to pursue potential opportunities in this area. Utilities that were involved in this phase of the program included Northern States Power, Minnesota Power, Central Louisiana Electric Co., Arkansas Power & Light, Union Electric, Delmarva, East Kentucky Electric Cooperative, Northeast Utilities, and Colorado Public Service. EPRI coordinated its efforts with Southern Company in the cofiring testing at Plant Kraft. EPRI also coordinated its efforts with the initial design studies and programs of New York State Electric and Gas (NYSEG) at Greenidge Generating Station. EPRI also maintained involvement with researchers evaluating and developing biomass feedstocks at Oak Ridge National Laboratory and State University of New York at Syracuse.
2.5. CONCLUSIONS CONCERNING THE INITIAL EPRI PROGRAM
The EPRI program in cofiring developed prior to the cooperative agreement with USDOE, but with the support of USDOE, achieved numerous objectives:
∙It developed necessary engineering concepts to design and construct either test or permanent cofiring facilities at cyclone and pulverized coal boilers.
∙It developed sufficient background data on fuel properties, fuel transport and storage issues, and on spontaneous combustion-safety issues to provide a basis for promoting testing of cofiring.
∙It sponsored or participated in many of the initial test programs of cofiring, and documented the benefits and limitations of various cofiring approaches; this included documenting problems associated with blending biomass and coal for transport into PC boilers through pulverizers, which showed that this technology has limited potential.
∙It developed research programs investigating additional approaches to cofiring including gasification-based cofiring, slagging combustion-based cofiring, and related approaches.
∙It initiated the development of screening modeling tools that ultimately led to the development of a biomass fuels database.
Final EPRI Report.doc |
87 |
10/31/01 9:18 PM |
EPRI, through this aggressive program, developed numerous active utility partnerships with such organizations as TVA, GPU Genco, Northern States Power, Southern Company, Northern Indiana Public Service Company (NIPSCO), and other strong utilities investigating cofiring as a means for costeffective greenhouse gas emissions reduction, SO2 reduction, and other emissions management. The research results, and the utility partnerships, provided a strong base for commercializing the biomass cofiring technology.
Final EPRI Report.doc |
88 |
10/31/01 9:18 PM |
3.0. COOPERATIVE AGREEMENT DEVELOPMENT OF COFIRING IN WALL FIRED PULVERIZED COAL BOILERS
3.1.OVERVIEW
With the initiation of the cooperative agreement between the Federal Energy Technology Center (FETC)—now the National Energy Technology Center (NETL)—and EPRI, a cooperative agreement joined by the Office of Energy Efficiency and Renewable Energy (EE-RE) of USDOE, cofiring commercialization proceeded. EE-RE would become a major partner in this cooperative agreement, providing the necessary funds for cofiring commercialization. Because wall fired PC boilers are more common than any other type of coal-fired boiler, they became a focus for cooperative agreement activity. Test and demonstration activities occurred at the following locations:
∙Colbert Fossil Plant, TVA
∙Seward Generating Station, GPU Genco
∙Blount St. Station, Madison Gas & Electric
These three test and demonstration sites completed commercialization of low percentage cofiring (e.g., <5 percent biomass, mass basis) of woody biomass by blending sawdust and coal in the coal yard, demonstrating the benefits of 10 – 20 percent cofiring of woody biomass on emissions management, and demonstrating the cofiring of switchgrass as a biofuel in PC boilers. EPRI and the cooperative agreement played a dominant role in the Colbert and Seward demonstrations, and played a supporting role in the Blount St. Station switchgrass demonstration.
3.2.THE COLBERT FOSSIL PLANT COFIRING INSTALLATION
The commercialization of low percentage cofiring at the Colbert Fossil Plant has been documented in several publications (see, for example, Tillman, Stahl, and Therkelsen, 1997; Rollins, Reardon, and Tillman, 1998). This represented the final step in blending wood waste with coal on the coal pile—using this approach in a boiler where sufficient excess pulverizer capacity exists and where cofiring percentages are held sufficiently low to avoid causing problems with the sieve analysis.
The Colbert Fossil Plant (see Figure 3-1), located near Muscle Shoals, AL, is located near one of the Tennessee Valley's larger sources of wood waste from the furniture industry. This is both green hardwood sawdust from primary sawmills and dry wood waste from the furniture manufacturers. Key to this cofiring installation was adequate integration of the cofiring system into the coal yard. This plant has five boilers; four are 192 MWe Babcock & Wilcox subcritical units and the fifth is a 550 MWe wallfired supercritical boiler. Cofiring was demonstrated and commercialized in Boiler #3, one of the 192 MWe units.
Final EPRI Report.doc |
89 |
10/31/01 9:18 PM |

Figure 3-1. The Colbert Fossil Plant of TVA
The Colbert coal yard is stocked with coal supplied from single conveyors that deliver coal from each of two barge unloaders. There is no coal crusher and all sizing is done on the coal belt that moves coal from the barge unloader to either the stockpile or directly to the belt lines supplying the coalbunkers. Two stockpiles of coal are maintained. One is a low sulfur coal stockpile for the 192 MWe units, while a separate high sulfur coal stockpile is maintained for Unit 5 (550 Mwe). A reclaim hopper is also provided for each stockpile. Each of the reclaim hoppers consist of two adjacent hoppers covered by a grizzly or steel grate with a vibrating feeder located under each hopper. Each of the two feeders for the reclaim hopper feeds a common reclaim conveyor belt. This conveyor belt then feeds either one of two parallel coal belt lines on the North side of the coal yard. Each of the two coal belt lines is designed to provide 700 tons of coal per hour. They may be used one at a time or together.
3.2.1. Cofiring Materials Handling Design
The location chosen for wood fuel storage, processing, and handling was on the Northeast corner of the coal yard adjacent to the high sulfur coal stockpile and reclaim hopper. It was next to a roadway that allowed easy routing of delivery trucks from the truck scales. Introduction of the wood fuel was through the reclaim hopper where, it could be easily conveyed to either coal belt line.
Final EPRI Report.doc |
90 |
10/31/01 9:18 PM |