

Figure 4-2. Sawdust Being Transported Up the Walking Floor Unloader
Figure 4-3. Sawdust Being Screened on the Disc Screen
Final EPRI Report.doc |
131 |
10/31/01 9:18 PM |

Figure 4-4. Sawdust Being Metered on the Weigh Belt Feeder
Figure 4-5. The Sawdust Injector in the Albright Boiler #3
Final EPRI Report.doc |
132 |
10/31/01 9:18 PM |

Figure 4-6. Controls for the Cofiring System at Albright Generating Station
This design reflects the basic approach of screening rather than grinding every particle. It is designed to incorporate grinding of oversized particles, should that become economically desirable.
The project was constructed in late 2000 and early 2001. It was commissioned for cofiring operations on June 19, 2001 and dedicated on June 29, 2001.
4.3.2. Demonstration Results
Extensive testing of this cofiring system has been conducted during the period May, 2000 – July, 2001. Some 68 test hours have been completed with extensive data acquisition. Fuels have been characterized, along with operating parameters and airborne emissions. Test variables have included load, excess O2, cofiring percentage, and extent to which SOFA has been employed. The results have been favorable, with an indication that cofiring can address the 3 P’s—SO2, NOx, and mercury—in a cost-effective manner.
Table 4-1 summarizes the ultimate analysis of the coal and sawdust burned at the Albright Generating Station. Note the low nitrogen, sulfur, and ash concentrations in the sawdust. Table 4-1 presents averages. There is inherent variability in both the coal and the sawdust burned at the Albright Generating Station, and this variability influences the measurement of emissions and emissions reduction.
Final EPRI Report.doc |
133 |
10/31/01 9:18 PM |

Table 4-1. Typical Analyses of the Coal and Sawdust at Albright Generating Station
Element/Compound (wt %) |
Coal |
Sawdust |
Carbon |
70.10% |
29.87% |
Hydrogen |
4.30% |
3.51% |
Oxygen |
4.38% |
26.66% |
Nitrogen |
1.30% |
0.12% |
Sulfur |
1.50% |
0.01% |
Chlorine |
0.00% |
0.00% |
Moisture |
7.40% |
39.53% |
Ash |
11.02% |
0.30% |
Total |
100.00% |
100.00% |
Higher Heating Value (Btu/lb) |
12302 |
5087 |
Cofiring at Albright Unit #3 was performed at levels up to 10 percent (mass basis, or 4.7 percent on a heat input basis). This is equivalent to firing 6 ton/hr of sawdust at full load operations. Excess O2 varied from 2.5 percent to 4.9 percent during the test program. There are three SOFA levels at Albright Unit #3, with each level having dampers with 0 – 100 percent open capability. During the testing, SOFA damper positions ranged from 15 percent open (dampers were opened only on one level) to 240 percent open (from a total of 300 percent).
Cofiring did not significantly impact either opacity or CO emissions, as is shown in Figures 4-7 and 4-8. These emissions also are an indication of carbon conversion efficiency. Note that there is a slight apparent upward trend in opacity largely as a result of one 4-hour period of time. For the vast majority of operations, opacity remained between 3 and 4 percent. It is useful to note that cofiring did not increase unburned carbon in flyash or bottom ash appreciably, also supporting the data in Figures 4-7 and 4-8.
|
6 |
|
|
|
|
|
|
|
5 |
|
|
|
|
|
|
|
y = 0 . 0 4 8 3 x + 3 . 4 0 3 5 |
|
|
|
|
|
|
|
R 2 |
= 0 . 0 6 3 2 |
|
|
|
|
|
Percent |
4 |
|
|
|
|
|
|
3 |
|
|
|
|
|
|
|
Opacity, |
|
|
|
|
|
|
|
2 |
|
|
|
|
|
|
|
|
|
|
|
|
|
|
|
|
1 |
|
|
|
|
|
|
|
0 |
|
|
|
|
|
|
|
0 . 0 0 |
2 . 0 0 |
4 . 0 0 |
6 . 0 0 |
8 . 0 0 |
1 0 . 0 0 |
1 2 . 0 0 |
|
|
|
C o f i r i n g P e r c e n t a g e , M a s s B a s i s |
|
|
||
Final EPRI Report.doc |
134 |
10/31/01 9:18 PM |
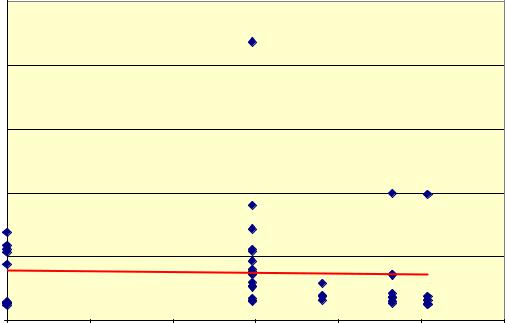
Figure 4-7. Opacity Emissions (Percent) as a Function of Cofiring at Albright Generating Station.
|
250 |
|
|
|
|
|
|
|
200 |
|
|
|
|
|
|
ppmv |
|
y = -0.3637x + 39.609 |
|
|
|
|
|
|
R2 = 0.0014 |
|
|
|
|
|
|
150 |
|
|
|
|
|
|
|
CO Emissions, |
|
|
|
|
|
|
|
100 |
|
|
|
|
|
|
|
|
|
|
|
|
|
|
|
|
50 |
|
|
|
|
|
|
|
0 |
|
|
|
|
|
|
|
0.00 |
2.00 |
4.00 |
6.00 |
8.00 |
10.00 |
12.00 |
Cofiring Percentage, Mass Basis
Figure 4-8. Influence of Cofiring on Carbon Monoxide Emissions at Albright Generating Station
The data presented in Figures 4-7 and 4-8 relates to normal full load (130 MWe net) operation. There was no evidence of increased opacity or CO emissions at part load operation.
SO2 emissions generally decreased as a function of fuel substitution. The inherent variability in the fuel quality results in some scatter in the data generated. These SO2 results are presented in Figures 4-9 and 4-10 on a ppmv basis.
Final EPRI Report.doc |
135 |
10/31/01 9:18 PM |

SO2 Emissions, ppmv
1040
1020
1000
980
960
940
920
900
880 |
|
|
|
|
|
|
0.00 |
2.00 |
4.00 |
6.00 |
8.00 |
10.00 |
12.00 |
Cofiring Percentage, Mass Basis
Figure 4-9. SO2 Emissions as a Function of Cofiring at Albright Generating Station (mass basis)
|
1040 |
|
|
|
|
|
|
|
|
|
|
|
1020 |
|
|
|
|
|
|
|
|
|
|
ppmv |
1000 |
|
|
|
|
|
|
|
|
|
|
980 |
|
|
|
|
|
|
|
|
|
|
|
Emissions, |
|
|
|
|
|
|
|
|
|
|
|
960 |
|
|
|
|
|
|
|
|
|
|
|
940 |
|
|
|
|
|
|
|
|
|
|
|
SO2 |
|
|
|
|
|
|
|
|
|
|
|
|
|
|
|
|
|
|
|
|
|
|
|
|
920 |
|
|
|
|
|
|
|
|
|
|
|
900 |
|
|
|
|
|
|
|
|
|
|
|
880 |
|
|
|
|
|
|
|
|
|
|
|
0.00 |
0.50 |
1.00 |
1.50 |
2.00 |
2.50 |
3.00 |
3.50 |
4.00 |
4.50 |
5.00 |
Cofiring Percentage, Heat Input Basis
Figure 4-10. SO2 Emissions as a Function of Cofiring at Albright Generating Station (heat input basis)
Final EPRI Report.doc |
136 |
10/31/01 9:18 PM |

The cofiring demonstration at Albright Generating Station has reduced NOx emissions as a function of cofiring level and the management of other known NOx – causing variables: excess O2 and SOFA usage. Figure 4-11 depicts the NOx reductions achieved. Note that the variability implied by the data results from the numerous variables employed to achieve NOx reduction.
|
0.6 |
|
|
|
|
|
|
|
0.5 |
|
|
|
|
|
|
lb/MMBtu |
0.4 |
|
|
|
|
|
|
|
|
|
|
|
|
|
|
Emissions, |
0.3 |
|
|
|
|
|
|
0.2 |
|
|
|
|
|
|
|
NOx |
|
|
|
|
|
|
|
|
|
|
|
|
|
|
|
|
0.1 |
|
|
|
|
|
|
|
0 |
|
|
|
|
|
|
|
0.00 |
2.00 |
4.00 |
6.00 |
8.00 |
10.00 |
12.00 |
Cofiring Percentage, Mass Basis
Figure 4-11. NOx Reduction from Cofiring at the Albright Generating Station
The data generated during the testing were converted into a single, robust, regression equation as shown below. The r2 for this equation is 0.873 with 68 data points, or 67 degrees of freedom.
NOx (lb/106 Btu) = 0.361 – 0.0043(W%) + 0.0217(O2%) – 0.00055(SOFA) [16]
Where, W% is sawdust percentage in the fuel on a mass basis, O2% is the percentage excess oxygen measured at the furnace exit, and SOFA is the total percentage of the three SOFA dampers expressed as percent open. Note that the range of W terms is 0 – 10, the range of O2% terms is 2.5 – 4.9, and the range of SOFA terms is 15 – 240. This may explain the difference in the coefficients.
Table 4-2 demonstrates the robustness of equation 16. It presents the probabilities that any given calculated value occurs randomly. Any probability <0.05 can be considered significant; any probability <0.01 can be considered highly significant.
Final EPRI Report.doc |
137 |
10/31/01 9:18 PM |

Table 4-2. Probability That The Equation, or any Term, Occurred Randomly
Number |
Parameter Evaluated |
Probability |
of |
|
|
Randomness |
|
1 |
Total Equation |
4.17x10⁻²⁸ |
|
2 |
Intercept |
5.23x10⁻²⁵ |
|
3 |
Sawdust Percentage |
3.13x10⁻⁶ |
|
4 |
Excess O2 Percent |
8.20x10⁻⁴ |
|
5 |
SOFA Dampers Percent |
2.58x10⁻²² |
|
Figure 4-12 compares the observed NOx emissions to those predicted by this equation. Note that there is some deviation from the trend predicted; the equation clearly lacks all explanatory terms. Note, also, that the equation explains the vast majority of the NOx reduction observed during the test program.
0.500
from |
0.450 |
|
EmissionsNOx(lb/MMBtu) |
||
Equation[16] |
||
|
0.400 |
|
|
0.350 |
|
Predicted |
0.300 |
|
0.250 |
||
|
||
|
0.200 |
|
|
0.200 |
y = 0.8681x + 0.0499 R2 = 0.873
0.250 |
0.300 |
0.350 |
0.400 |
0.450 |
0.500 |
0.550 |
Observed NOx Emissions (lb/MMBtu)
Figure 4-12. Comparison of Observed and Predicted NOx Emissions Based Upon Equation [16]
The NOx reduction observed was, therefore, consistent and substantial. To further understand the mechanisms of NOx reduction involved in cofiring at Albright Generating Station, fuel characterization experiments were conducted at Pennsylvania State University evaluating the pattern of nitrogen evolution from the sawdust and coal at Albright Generating Station (Johnson et. al., 2001a; Johnson et. al., 2001b). These experiments were patterned after work by Baxter et. al. (1996c) concerning the evolution of volatile nitrogen from coals. Both the sawdust and Albright coals were analyzed. The fuels were reacted in a drop tube reactor (DTR) at temperatures ranging from 400oC to 1700oC. The total
Final EPRI Report.doc |
138 |
10/31/01 9:18 PM |

volatile matter evolution was measured, along with the total nitrogen evolved as volatile matter and the total carbon evolved as volatile matter. Figures 4-13 and 4-14 present the results for the sawdust; Figure 4-15 presents the results for the coal burned at Albright. Note that Figures 4-13 and 4-15 present the data in terms of DTR temperature. Figure 14 normalizes the volatile evolution from the sawdust to the total volatile evolution from the coal as another means of analysis.
|
|
100.00 |
|
|
|
|
|
|
|
|
|
Volatil |
|
90.00 |
Nitrogen Evolved |
|
|
|
|
|
|
|
|
|
|
as Volatile Matter |
Total Volatile Matter |
|
|
|
|
|
|
||
|
80.00 |
|
|
|
|
|
|
|
|||
as |
|
|
|
Evolved |
|
|
|
|
|
|
|
|
|
|
|
|
|
|
|
|
|
||
|
|
|
|
|
|
|
|
|
|
|
|
Element Evolved |
|
70.00 |
|
|
|
|
|
|
|
|
|
Matter |
60.00 |
|
|
|
|
|
|
|
|
|
|
|
|
|
|
|
Carbon Evolved as Volatile Matter |
|
|
||||
50.00 |
|
|
|
|
|
|
|
|
|
||
40.00 |
|
|
|
|
|
|
|
|
|
||
30.00 |
|
|
|
|
|
|
|
|
|
||
of |
|
|
|
|
|
|
|
|
|
|
|
|
|
|
|
|
|
|
|
|
|
|
|
Percent |
|
20.00 |
|
|
|
|
|
|
|
|
|
|
10.00 |
|
|
|
|
|
|
|
|
|
|
|
|
|
|
|
|
|
|
|
|
|
|
|
|
0.00 |
|
|
|
|
|
|
|
|
|
|
|
0 |
200 |
400 |
600 |
800 |
1000 |
1200 |
1400 |
1600 |
1800 |
Temperature (C)
Figure 4-13. Nitrogen Volatile Evolution from Sawdust as a Function of Temperature
Percent Nitrogen or Carbon |
|
100.00 |
|
|
|
|
|
|
|
|
|
|
|
90.00 |
|
|
|
|
|
|
|
|
|
|
|
Evolved as Volatiles |
80.00 |
|
|
|
|
|
|
|
|
|
|
|
70.00 |
Nitrogen Volatiiles Formed |
|
|
|
|
|
|
|
||||
|
|
|
|
|
|
|
|
|
|
|||
60.00 |
|
|
|
|
|
|
|
|
|
|
||
50.00 |
|
|
|
|
|
|
|
|
|
|
||
40.00 |
|
|
|
|
|
|
|
|
|
|
||
30.00 |
|
|
|
|
|
Carbon Volatiles Formed |
|
|
||||
|
|
|
|
|
|
|
|
|
|
|||
20.00 |
|
|
|
|
|
|
|
|
|
|
||
10.00 |
|
|
|
|
|
|
|
|
|
|
||
0.00 |
|
|
|
|
|
|
|
|
|
|
||
|
|
|
|
|
|
|
|
|
|
|
|
|
|
|
0.0% |
10.0% |
20.0% |
30.0% |
40.0% |
50.0% |
60.0% |
70.0% |
80.0% |
90.0% |
100.0% |
Percent Volatile Matter Evolved
Figure 4-14. Nitrogen Volatile Evolution from Sawdust Normalized to Total Volatiles
Final EPRI Report.doc |
139 |
10/31/01 9:18 PM |

in |
|
70 |
|
|
|
|
|
|
|
|
|
|
|
|
|
|
|
|
|
|
|
|
|
of Element Evolving |
|
60 |
|
|
|
|
|
|
|
|
|
Volatile Matter |
50 |
|
|
|
|
|
|
|
|
|
|
|
Percent of Carbon Evolving as Volatile Matter |
|
|
|
|
|
|
||||
40 |
|
|
|
|
|
|
|
|
|
||
30 |
|
|
|
|
|
|
|
|
|
||
20 |
|
|
|
|
|
|
|
|
|
||
Percent |
|
10 |
|
|
|
Percent of Nitrogen Evolving as Volatile Matter |
|
|
|
||
|
|
|
|
|
|
|
|
|
|
||
|
0 |
|
|
|
|
|
|
|
|
|
|
|
|
|
|
|
|
|
|
|
|
|
|
|
|
0 |
200 |
400 |
600 |
800 |
1000 |
1200 |
1400 |
1600 |
1800 |
|
|
|
|
|
|
Temperature |
|
|
|
|
|
Figure 4-15. Nitrogen Volatile Evolution from Coal Burned at Albright Generating Station
Several factors become significant. the volatile evolution from sawdust is complete by 1000oC or 1800oF. Further, over 90 percent of the dry wood evolves as volatile matter. The volatile evolution from coal burned at Albright Generating Station does not reach completion until 1700oC or 3092oF. Further, only 52 percent of the dry coal matter evolves as volatile matter. The nitrogen volatiles evolve from the sawdust more rapidly than the carbon volatiles—or the total volatile matter. For the Albright coal, like virtually all bituminous coals, the nitrogen volatilization lags behind the carbon volatilization— and total volatile matter evolution—until the final stages of the pyrolysis process. Further, some 95 percent of the sawdust nitrogen evolves as volatile matter while only 62 percent of the coal nitrogen evolves as volatile matter.
The sawdust is injected into the center of the fireball in a transport air stream where the stoichiometric ratio is substantially below 1.0. The volatiles from the sawdust evolve rapidly, contributing to fuel staging in the fireball. The nitrogen volatiles also evolve rapidly and are readily converted to N2. This use of volatile flooding has been shown with the testing at the Allen Fossil Plant and the Seward Generating Station. It works synergistically with the management of excess O2 and the use of a SOFA system to maximize NOx reductions without compromising combustion/carbon conversion efficiency.
The influence of cofiring on mercury emissions can be inferred from available data in the literature. DeVito, Rosendale, and Conrad (1994) show mercury concentrations at 0.11mg/kg in the total coal from 10 Pittsburgh Seam mines. This is equivalent to 3.67 mg/106 Btu. This is consistent with research reported by Clarke, Sloss, and Grant (1992). Toxic Release Inventory data developed by Allegheny Energy from 1999 and 2000 show some variability in the mercury concentrations in coal burned at Albright; however it shows a consistent average of 0.18 mg/kg or 0.18 ppmw in dry coal. Measurements made by Foster Wheeler concerning cofiring at the Albright Generating Station place the concentration of mercury in wood waste at 0.003 – 0.009 mg/kg or ppmw in dry fuel. These data were
Final EPRI Report.doc |
140 |
10/31/01 9:18 PM |