

Table 5-2. Structural and Kinetic Data Representative of Fuels Burned at Michigan City Cofiring Tests
|
|
Fuel |
|
|
|
Wood Waste |
Black |
Caballo Rojo |
Shoshone |
|
(***) |
Thunder |
|
|
Aromaticity (Number of Aromatic Carbon |
0.08 |
0.57 |
0.64 |
0.61 |
Atoms/Total Number of Carbon Atoms) |
|
|
|
|
Average Number of Aromatic |
6 |
10 |
10 |
11 |
Carbons/Cluster |
|
|
|
|
Devolatilization Kinetics (*) |
|
|
|
|
Temperature Range (oC) |
600-1000 |
800-1700 |
1000-1700 |
800-1700 |
Pre-exponential Constant (A) (1/sec) |
5.74 |
59.1 |
89.3 |
36.2 |
Activation Energy (E) (kcal/mol) |
3.42(****) |
9.53 |
10.8 |
8.06 |
Char Oxidation Kinetics (**) |
|
|
|
|
Pre-exponential Constant (A) (1/sec) |
1.63x10⁵ |
7.61x10⁴ |
1.83x10⁴ |
3.24x10⁵ |
Activation Energy (E) (kcal/mol) |
25.7 |
27.4 |
26.2 |
29.0 |
(*) Determined by Drop Tube Reactor Measurements
(**) Determined by Thermogravimetric Analysis of Chars Generated at 1700oC or 3092oF
(***) Values are for Sawdust and Considered Representative of the Wood Waste Burned at Michigan City
(****) Determined for the temperature range 600 – 1000oC; Activation energy is 0.681 for the temperature range 400 – 600oC
Source: Johnson et. al., 2001b.
The data developed also indicated different nitrogen volatile evolution patterns as illustrated in Figures 5-3 through 5-5.
Final EPRI Report.doc |
151 |
10/31/01 9:18 PM |

|
90.00% |
|
|
|
|
|
|
|
|
|
|
80.00% |
|
|
|
|
|
|
|
|
|
|
70.00% |
|
|
|
|
|
Total Fuel |
|
|
|
|
|
|
|
|
|
|
|
|
|
|
Volatilized |
60.00% |
|
|
|
|
|
|
|
|
|
50.00% |
|
|
|
|
|
|
|
|
|
|
|
|
|
|
|
|
|
|
|
|
|
Percent |
40.00% |
|
|
|
|
Nitrogen |
|
|
Carbon |
|
|
|
|
|
|
|
|
|
|||
30.00% |
|
|
|
|
|
|
|
|
|
|
|
|
|
|
|
|
|
|
|
|
|
|
20.00% |
|
|
|
|
|
|
|
|
|
|
10.00% |
|
|
|
|
|
|
|
|
|
|
0.00% |
|
|
|
|
|
|
|
|
|
|
0 |
200 |
400 |
600 |
800 |
1000 |
1200 |
1400 |
1600 |
1800 |
Temperature (C)
Figure 5-3. Nitrogen and Total Fuel Volatile Evolution Patterns for Black Thunder Coal
Final EPRI Report.doc |
152 |
10/31/01 9:18 PM |

|
80.00% |
|
|
|
|
|
|
|
|
|
|
|
|
|
|
|
|
Total Fuel |
|
|
|
|
70.00% |
|
|
|
|
|
|
|
|
|
|
60.00% |
|
|
|
|
|
|
|
|
|
Volatilized |
50.00% |
|
|
|
|
|
|
|
Carbon |
|
|
|
|
|
|
|
|
|
|
||
40.00% |
|
|
|
|
|
|
|
|
|
|
Percent |
|
|
|
|
|
Nitrogen |
|
|
|
|
30.00% |
|
|
|
|
|
|
|
|
|
|
|
|
|
|
|
|
|
|
|
|
|
|
20.00% |
|
|
|
|
|
|
|
|
|
|
10.00% |
|
|
|
|
|
|
|
|
|
|
0.00% |
|
|
|
|
|
|
|
|
|
|
0 |
200 |
400 |
600 |
800 |
1000 |
1200 |
1400 |
1600 |
1800 |
Temperature (C)
Figure 5-4. Volatile Evolution Patterns for Caballo Rojo Coal
|
90.00% |
|
|
|
|
|
|
|
|
|
|
80.00% |
|
|
|
|
|
|
Total Fuel |
|
|
|
|
|
|
|
|
|
|
|
|
|
|
70.00% |
|
|
|
|
|
|
|
|
|
Evolution |
60.00% |
|
|
|
|
|
|
|
|
|
50.00% |
|
|
|
|
|
|
|
|
|
|
|
|
|
|
|
|
|
|
|
|
|
Volatile |
40.00% |
|
|
|
|
|
|
|
|
|
|
|
|
|
|
Nitrogen |
|
|
Carbon |
|
|
30.00% |
|
|
|
|
|
|
|
|
|
|
|
20.00% |
|
|
|
|
|
|
|
|
|
|
10.00% |
|
|
|
|
|
|
|
|
|
|
0.00% |
|
|
|
|
|
|
|
|
|
|
0 |
200 |
400 |
600 |
800 |
1000 |
1200 |
1400 |
1600 |
1800 |
Temperature (C)
Figure 5-5. Volatile Evolution Patterns for Shoshone Coal
Final EPRI Report.doc |
153 |
10/31/01 9:18 PM |
Note that the nitrogen volatile evolution lags behind the carbon volatile evolution, and the total volatile evolution, for all three coals—but that the lag shown is not as pronounced as that measured for eastern bituminous coal (see Figure 4-15). The lag is most pronounced for the Shoshone coal, and least pronounced for the Black Thunder coal. Cofiring at Michigan City, with western and PRB coals as the base fuel, is quite different from cofiring with eastern bituminous coals as the base fuel.
5.2.2. The Cofiring Tests
Because the Michigan City #12 boiler had been fired for some time on the conventional blend of 60 percent Black Thunder/40 percent Shoshone, it had been derated to 430 MWe based upon economizer exit temperatures. Consequently, tests were run at full load—nominally 425 MWe—and at minimum load of 300 MWe. Tests were performed over 3 to 4 hour periods. Variables, other than load, included cofiring vs. baseline testing, excess O2 percentages, and related operating parameters. Extensive data sets were taken in the control room, and at the inlet and outlet of the air heater, in order to evaluate the impact of 10 percent cofiring on boiler capacity, efficiency, operability, and emissions. Samples of all fuels were taken for proximate and ultimate analysis; samples of flyash were taken from the flue gas stream and from the precipitator hoppers to determine the influence of cofiring on unburned carbon. Deposition was evaluated by considering the impact of cofiring on temperatures at the exit of the air heater between sootblowing cycles. These efforts provided a complete data set for test analysis. The test conditions were generally consistent throughout the entire time of cofiring. However one critical parameter impacted the testing, and the interpretation of results. The test was conducted during a period of time when utilities serviced by the Union Pacific Railroad were having difficulties with coal shipments. The plant had only 8 days of coal on the ground when testing commenced. Consequently the baseline was performed using Caballo Rojo as the PRB coal. The cofiring testing, however, was conducted using Black Thunder as the PRB coal. Interpreting the results, and documenting the differences between the baseline and the cofiring tests, required calculation techniques documenting the influence of PRB coal type. The tests were conducted in September, 1997. They focused upon issues of capacity, efficiency, temperature impacts, and environmental impacts.
5.2.2.1. Capacity Impacts
Table 5-3 presents the overall conditions existing during the 3 baseline tests and the 6 cofiring tests. Note that there was no loss of load associated with cofiring; and steam flows with biofuel in the total fuel blend were within 30,000 lb/hr (1.5 percent) of steam flows during baseline testing.
The data in Table 5-3 suggest no impact on capacity. However, feeder speeds were also measured, as shown in Figure 5-6. Feeder speeds to the cyclones averaged about 8 percent higher when cofiring than when operating the unit only on coal. The difference in feeder speeds can be attributed both to the lower heat content of the wood waste relative to the coal, and the lower bulk density of the wood waste relative to the coal. The feeder speed data indicate that cofiring would result in a maximum plant capacity of ~430 MWe when cofiring regardless of the cleanliness of the boiler. This capacity limitation
Final EPRI Report.doc |
154 |
10/31/01 9:18 PM |
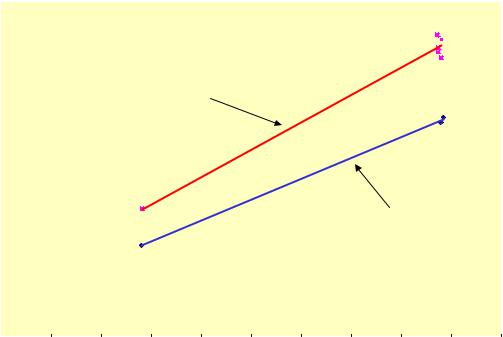
results from the fact that the boiler was originally designed for Illinois Basin coal and was converted to lower sulfur, lower Btu, lower efficiency PRB-western coal blends.
Table 5-3. Test Conditions at the Michigan City Cofiring Test Program
Parameter |
|
|
|
Cofiring Test |
|
|
|
||
|
1 |
2 |
3 |
4 |
5 |
6 |
7 |
8 |
9 |
Date |
9/23 |
9/24 |
9/24 |
9/24 |
9/25 |
9/25 |
9/25 |
9/26 |
9/26 |
Start Time |
1400 |
0400 |
0915 |
1700 |
0400 |
0900 |
1400 |
0715 |
1030 |
End Time |
1800 |
0700 |
1015 |
2000 |
0645 |
1200 |
1645 |
1015 |
1300 |
Load |
425.73 |
306.08 |
426.6 |
425.85 |
306.42 |
425.92 |
424.75 |
424.38 |
424.64 |
MWe |
|
|
|
|
|
|
|
|
|
Percent Cofire |
0 |
0 |
0 |
10 |
10 |
10 |
10 |
10 |
10 |
Main Steam |
2914 |
2015 |
2918 |
2878 |
2020 |
2880 |
2881 |
2865 |
2872 |
Flow kpph |
|
|
|
|
|
|
|
|
|
O2 Percent |
2.42 |
2.79 |
2.40 |
2.48 |
2.88 |
2.82 |
2.38 |
2.42 |
2.29 |
Feeder Speed (%)
100 |
|
|
|
|
|
|
|
|
|
|
|
|
|
|
95 |
|
|
|
|
|
|
|
|
|
|
|
|
|
|
90 |
|
|
|
|
|
|
|
|
|
|
|
|
|
|
|
|
Urban Wood/Coal Cofiring Feeder Speed Trendline |
|
|
|
|
|
|
|
|||||
|
|
|
|
|
|
|
|
|
|
|||||
85 |
|
|
|
|
|
|
|
|
|
|
|
|
|
|
|
|
|
y = 0.2048x + 6.3672 |
|
|
|
|
|
|
|
|
|
||
|
|
|
|
|
|
|
|
|
|
|
|
|
||
80 |
|
|
|
|
|
|
|
|
|
|
|
|
|
|
|
|
|
|
|
|
|
|
|
|
|
|
|
|
|
75 |
|
|
|
|
|
|
|
|
|
|
|
|
|
|
|
|
|
|
|
|
|
|
|
|
|
|
|
|
|
70 |
|
|
|
|
|
|
|
|
|
|
|
|
|
|
|
|
|
|
|
|
|
Coal Blend Feeder Speed Trendline |
|
|
|||||
|
|
|
|
|
|
|
|
|
|
|||||
65 |
|
|
|
|
|
|
|
|
|
|
|
|
|
|
|
|
|
|
|
|
|
|
y = 0.1574x + 15.415 |
|
|
||||
|
|
|
|
|
|
|
|
|
|
|
||||
60 |
|
|
|
|
|
|
|
|
|
|
|
|
|
|
|
|
|
|
|
|
|
|
|
|
|
|
|
|
|
55 |
|
|
|
|
|
|
|
|
|
|
|
|
|
|
|
|
|
|
|
|
|
|
|
|
|
|
|
|
|
50 |
|
|
|
|
|
|
|
|
|
|
|
|
|
|
|
|
|
|
|
|
|
|
|
|
|
|
|
|
|
250 |
270 |
290 |
310 |
330 |
350 |
370 |
390 |
410 |
430 |
450 |
||||
Load (MW)
Figure 5-6. Impact of Cofiring on Cyclone Feeder Speeds at Michigan City Cofiring Tests
Final EPRI Report.doc |
155 |
10/31/01 9:18 PM |
5.2.2.2. Efficiency Impacts
Efficiency impacts of cofiring are shown in Table 5-4. There is no apparent impact associated with cofiring, however, Caballo Rojo coal at 8424 Btu/lb was used in the baseline testing and Black Thunder coal was used during the cofiring tests. Additional calculations show that, if the PRB coal type is held constant, there may be an efficiency loss of ~0.3 - 0.5 percent when cofiring at 10 percent wood waste by mass (6.5 percent biomass on a heat input basis). It is significant, however, that cofiring did not cause an increase in unburned carbon in the flyash, cause an increase in excess O2 required, or cause an increase in air heater exit temperature.
The apparent increase in boiler efficiency associated with Test 2 and Test 5 is an artifact of low load testing. Under low load testing the air heater exit temperature declined dramatically, creating this phenomenon. The efficiency number is an economic number, limiting the economic value of biofuel. As PRB coal has demonstrated, low cost fuels having a modest negative impact on heat rate can still be economically desirable in coal-fired boilers.
Table 5-4. Efficiency Measurements During Cofiring Tests at Michigan City Generating Station
Parameter |
|
|
|
|
Test |
|
|
|
|
|
|
|
1 |
2 |
3 |
4 |
5 |
6 |
7 |
8 |
9 |
|
Date |
9/23 |
9/24 |
9/24 |
9/24 |
9/25 |
9/25 |
9/25 |
9/26 |
9/26 |
|
Start Time |
1400 |
0400 |
0915 |
1700 |
0400 |
0900 |
1400 |
0715 |
1030 |
|
End Time |
1800 |
0700 |
1015 |
2000 |
0645 |
1200 |
1645 |
1015 |
1300 |
Load (MWe) |
425.7 |
306.0 |
426.6 |
425.8 |
306.4 |
425.9 |
424.7 |
424.3 |
424.6 |
|
|
|
3 |
8 |
|
5 |
2 |
2 |
5 |
8 |
4 |
Percent Cofire |
0 |
0 |
0 |
10 |
10 |
10 |
10 |
10 |
10 |
|
Main Steam Flow |
2914 |
2015 |
2918 |
2878 |
2020 |
2880 |
2881 |
2865 |
2872 |
|
(kpph) |
|
|
|
|
|
|
|
|
|
|
O2 Percent |
2.42 |
2.79 |
2.24 |
2.48 |
2.88 |
2.82 |
2.38 |
2.42 |
2.29 |
|
AHTR Exit °F |
366 |
318 |
372 |
368 |
316 |
372 |
372 |
372 |
368 |
|
AHTR |
Inleakage |
5.25 |
8.90 |
7.40 |
7.20 |
5.30 |
7.40 |
6.50 |
8.80 |
9.50 |
(%) |
|
|
|
|
|
|
|
|
|
|
Unburned |
0.75 |
0.57 |
1.18 |
0.65 |
0.62 |
0.76 |
0.69 |
0.93 |
NA |
|
Carbon (%) |
|
|
|
|
|
|
|
|
|
|
Boiler |
Efficiency |
84.6 |
85.3 |
84.4 |
84.6 |
85.7 |
84.4 |
84.7 |
84.5 |
84.6 |
(%) |
|
|
|
|
|
|
|
|
|
|
Final EPRI Report.doc |
156 |
10/31/01 9:18 PM |

5.2.2.3. Temperature Impacts of Cofiring.
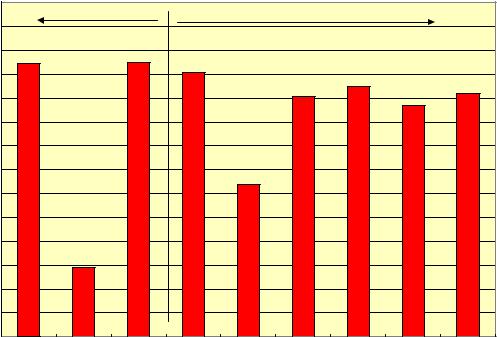
The economizer exit temperature and the air heater exit temperature were not impacted by cofiring. Similarly, the recirculated flue gas temperature was not impacted by cofiring. Figure 5-7 illustrates the impact of cofiring on calculated combustion/flame temperatures while Figure 5-8 illustrates the impact of cofiring on measured furnace exit gas temperature (FEGT). Note that there is an apparent slight rise in flame temperature potentially caused by the volatility of the biofuel and the switch in PRB coals. Note, also, that there is a decrease in measured FEGT when cofiring.
The phenomenon creating the drop in FEGT is typically that the highly volatile wood waste ignites rapidly in the exit of the scroll section of the cyclone barrel, helping to ignite the coal and thereby increasing the relative percentage of combustion occurring in the cyclone barrel. This decreases the combustion in the primary furnace, thereby reducing FEGT.
Estimated Flame Temperature (F)
3480
Baseline Tests |
Cofiring Tests |
3460
3440
3420
3400
3380
3360
3340
3320
1 |
2 |
3 |
4 |
5 |
6 |
7 |
8 |
9 |
|
|
|
|
Test Number |
|
|
|
|
Figure 5-7. Estimated Flame Temperatures During Cofiring at Michigan City Generating Station
Final EPRI Report.doc |
157 |
10/31/01 9:18 PM |
|
2500.0 |
|
Baseline |
|
|
|
|
|
|
|
2450.0 |
|
|
Cofiring |
|
|
|
|
|
|
|
|
|
|
|
|
|
|
|
(F) |
2400.0 |
|
|
|
|
|
|
|
|
2350.0 |
|
|
|
|
|
|
|
|
|
Temperature |
|
|
|
|
|
|
|
|
|
2300.0 |
|
|
|
|
|
|
|
|
|
2250.0 |
|
|
|
|
|
|
|
|
|
2200.0 |
|
|
|
|
|
|
|
|
|
|
|
|
|
|
|
|
|
|
|
Gas |
2150.0 |
|
|
|
|
|
|
|
|
2100.0 |
|
|
|
|
|
|
|
|
|
Exit |
|
|
|
|
|
|
|
|
|
2050.0 |
|
|
|
|
|
|
|
|
|
Furnace |
|
|
|
|
|
|
|
|
|
2000.0 |
|
|
|
|
|
|
|
|
|
1950.0 |
|
|
|
|
|
|
|
|
|
|
|
|
|
|
|
|
|
|
|
|
1900.0 |
|
|
|
|
|
|
|
|
|
1850.0 |
|
|
|
|
|
|
|
|
|
1800.0 |
|
|
|
|
|
|
|
|
|
1 |
2 |
3 |
4 |
5 |
6 |
7 |
8 |
9 |
Cofiring Test
Figure 5-8. Furnace Exit Gas Temperatures Measured During Cofiring Tests at Michigan City Generating Station.
5.2.2.4. Environmental Impacts of Cofiring at Michigan City Generating Station
Cofiring at Michigan City Generating Station reduced SO2, NOx, and opacity emissions as shown in Table 5-5. The primary environmental impacts of consequence are impacts on NOx formation and on fossil CO2 mitigation. Figures 5-9 and 5-10 illustrate the impact of cofiring on NOx emissions, with Figure 5-10 focusing on FEGT influences.
Table 5-5. Airborne Emissions From Cofiring at Michigan City Generating Station
Parameter |
|
|
|
|
Test |
|
|
|
|
|
1 |
2 |
3 |
4 |
5 |
6 |
7 |
8 |
9 |
Date |
9/23 |
9/24 |
9/24 |
9/24 |
9/25 |
9/25 |
9/25 |
9/26 |
9/26 |
Start Time |
1400 |
0400 |
0915 |
1700 |
0400 |
0900 |
1400 |
0715 |
1030 |
End Time |
1800 |
0700 |
1015 |
2000 |
0645 |
1200 |
1645 |
1015 |
1300 |
NOx (lb/106Btu) |
1.28 |
1.05 |
1.19 |
1.16 |
1.03 |
1.16 |
1.13 |
1.14 |
1.16 |
SO2 (lb/106Btu) |
0.87 |
0.86 |
0.87 |
0.84 |
0.86 |
0.85 |
0.86 |
0.81 |
0.81 |
Opacity (%) |
25.05 |
12.86 |
24.98 |
25.73 |
12.41 |
27.55 |
22.20 |
18.64 |
19.66 |
Final EPRI Report.doc |
158 |
10/31/01 9:18 PM |

|
1.3 |
Baseline Tests |
|
Cofiring Tests |
|
|
|
|
|
|
|
|
|
|
|
|
|||
|
1.25 |
|
|
|
|
|
|
|
|
Btu |
|
|
|
|
|
|
|
|
|
(lb/million |
1.2 |
|
|
|
|
|
|
|
|
|
|
|
|
|
|
|
|
|
|
Emissions |
1.15 |
|
|
|
|
|
|
|
|
|
Minimum Load |
|
|
Minimum Load |
|
|
|
|
|
|
|
|
|
|
|
|
|
||
1.1 |
|
|
|
|
|
|
|
|
|
NOX |
|
|
|
|
|
|
|
|
|
|
|
|
|
|
|
|
|
|
|
|
1.05 |
|
|
|
|
|
|
|
|
|
1 |
|
|
|
|
|
|
|
|
|
1 |
2 |
3 |
4 |
5 |
6 |
7 |
8 |
9 |
Test Number
Figure 5-9. Impact of Cofiring on NOx Emissions at Michigan City Generating Station
|
1.3 |
|
|
|
|
|
|
|
|
|
|
|
1.25 |
|
|
|
|
|
|
|
|
|
|
Btu) |
1.2 |
|
Coal Baseline Trendline |
|
|
|
|
|
|
||
|
|
|
|
|
|
|
|
||||
|
|
|
|
|
|
|
|
|
|
|
|
(lb/million |
1.15 |
|
|
|
|
|
|
|
|
|
|
1.1 |
|
|
|
|
|
|
|
|
|
|
|
1.05 |
|
|
|
|
|
|
|
|
|
|
|
Emissions |
|
|
|
|
|
|
|
|
|
|
|
1 |
|
|
|
|
|
|
|
|
|
|
|
|
|
|
|
|
|
|
|
Cofiring Trendline |
|
||
0.95 |
|
|
|
|
|
|
|
|
|
|
|
NOX |
|
|
|
|
|
|
|
|
|
|
|
0.9 |
|
|
|
|
|
|
|
|
|
|
|
|
|
|
|
|
|
|
|
|
|
|
|
|
0.85 |
|
|
|
|
|
|
|
|
|
|
|
0.8 |
|
|
|
|
|
|
|
|
|
|
|
1900.0 |
1950.0 |
2000.0 |
2050.0 |
2100.0 |
2150.0 |
2200.0 |
2250.0 |
2300.0 |
2350.0 |
2400.0 |
Furnace Exit Gas Temperature (F)
Figure 5-10. Impact of Cofiring on FEGT, and the Consequence for NOx Emissions
Final EPRI Report.doc |
159 |
10/31/01 9:18 PM |
There was an apparent 9.5 percent decrease in NOx emissions caused by a 6.5 percent cofiring (heat input basis). This decrease was consistent with numerous other test experiences as presented previously. The impact of cofiring on NOx emissions can be directly attributed to fuel volatility, and its impact on the combustion process as shown in equation [17].
NOx = 1.764(FN) + 0.041(O2) + 0.0006(FEGT) -2.21 |
[17] |
Where NOx is measured in lb NOx (as NO2)/106 Btu, FN is fuel nitrogen in lb/106 Btu, O2 is the percentage of oxygen in the gaseous combustion products measured at the economizer exit, and FEGT is furnace exit gas temperature, measured in oF. The r2 for this equation is 0.979. The probability of random occurrence for each variable is as follows: intercept, .0023; FN, .0007; O2, .2832; and FEGT,
.0001. Only the O2 term is weak. The wood waste reduced the fuel nitrogen content and, because of its volatility, reduced the FEGT. It is significant to note, however, that the reduction in FEGT did not cause any reduction in main steam or reheat steam temperature.
The tests at Michigan City demonstrated the potential of cofiring as an environmental tool, while also documenting some of the operational benefits and concerns. The potential shown from these tests led to a triburn demonstration at the Bailly Generating Station of NIPSCO.
5.3.THE TRIBURN DEMONSTRATION AT BAILLY GENERATING STATION
The Bailly Generating Station triburn project has been reported extensively in the literature (Hus and Tillman, 2000; Tillman and Hus, 2000; Tillman, 1999a; Tillman, 1999b; Tillman, 1999c). In this demonstration, NIPSCO sought to obtain the benefits of biomass cofiring while overcoming the efficiency penalty that has been common to most biomass cofiring programs.
To pursue this opportunity, NIPSCO worked within the framework of the EPRI-USDOE Cooperative Agreement and developed a long term demonstration firing biomass and petroleum coke with coal at its Bailly Generating Station boiler #7, a 160 MWe (net) cyclone boiler. The NIPSCO demonstration program—the triburn program—involved designing and constructing a fuel preparation and blending facility. It then involved extensive testing of firing clean urban wood waste—biomass—with coal, firing petroleum coke with coal, and firing various blends of urban wood waste and petroleum coke with coal. Results of the extensive testing program have shown that the triburn blends of biomass and petroleum coke with coal have accomplished the following: 1) increased boiler efficiency, 2) reduced fuel costs; and 3) reduced emissions of oxides of nitrogen (NOx), mercury, and fossil carbon dioxide (CO2). At the same time, the triburn program has not increased other emissions.
5.3.1. Overview of the Program
Bailly Generating Station Boiler #7 is a 160 MWe (net) cyclone boiler generating about 1.2x10⁶ lb/hr of 2400 psig/1000oF/1000oF steam. It is typically fired with a blend of 70 percent Illinois Basin coal/30 percent Shoshone coal. It is equipped with a Pure Air scrubber for SO2 management. This boiler was
Final EPRI Report.doc |
160 |
10/31/01 9:18 PM |