

3.3.2. Characteristics of the Switchgrass
The University of Wisconsin considered switchgrass from Chariton Valley, IA and switchgrass grown in Wisconsin. The Wisconsin grass, obtained on a research basis from CRP lands, was ultimately used for the bulk of the testing. The ultimate analysis of the switchgrass is shown in Table 3-13. Note that it is significantly drier than sawdust, and also contains substantially more nitrogen and ash or inorganic material than the typical woody biomass used in cofiring.
Figure 3-24. Boiler #8 at Blount St. Station, Used for Switchgrass Cofiring (Source: Aerts and Ragland, 1997)
Final EPRI Report.doc |
121 |
10/31/01 9:18 PM |

Figure 3-25. The Opportunity Fuel Handling System at Blount St. Station Used for Switchgrass Cofiring
(Source: Aerts and Ragland, 1997)
Table 3-13. Typical Proximate and Ultimate Analysis for Switchgrass
Parameter |
|
|
Switchgrass |
|
|
|
As-Received Basis |
|
Dry Basis |
Proximate Analysis (wt %) |
|
|
|
|
Fixed Carbon |
|
9.5 |
|
10.68 |
Volatile Matter |
|
74.69 |
|
83.97 |
Ash (Inorganic Matter) |
|
4.76 |
|
5.35 |
Moisture |
|
11.05 |
|
0.00 |
Ultimate Analysis (wt %) |
|
|
|
|
Carbon |
|
42.31 |
|
47.57 |
Hydrogen |
|
5.12 |
|
5.76 |
Oxygen |
|
35.97 |
|
40.44 |
Nitrogen |
|
0.71 |
|
0.80 |
Sulfur |
|
0.16 |
|
0.18 |
Chlorine |
|
0.03 |
|
0.03 |
Ash (Inorganic Matter) |
|
4.65 |
|
5.22 |
Moisture |
|
11.05 |
|
0.00 |
Higher Heating Value (Btu/lb) |
|
7067 |
|
7945 |
Source: Aerts and Ragland, 1997. |
|
|
|
|
The ash analysis is particularly interesting, as shown in Tables 3-14 and 3-15. Note that the base/acid ratio determined from the data in Table 3-14 is 0.45. This is significantly higher than the B/A ratio for typical bituminous coals. The relatively high concentration of potassium in the switchgrass ash is the dominant contributor to the increased B/A ratio; it further suggests the potential for slagging and fouling
Final EPRI Report.doc |
122 |
10/31/01 9:18 PM |
problems (see Baxter et. al., 1996b). Note, also, that the ash fusion temperatures reported in Table 3- 15 are substantially lower than those typically associated with bituminous coals.
Table 3-14. Ash Elemental Analysis of Switchgrass Inorganic Matter
Element, in Oxide Form |
Wt Percent (dry basis) in Ash |
SiO2 |
61.31 |
Al2O3 |
0.72 |
TiO2 |
0.05 |
Fe2O3 |
0.48 |
CaO |
9.62 |
MgO |
5.53 |
Na2O |
0.38 |
K2O |
11.91 |
SO3 |
2.34 |
P2O5 |
7.07 |
Mn3O4 and Other |
0.59 |
Base/Acid Ratio |
0.45 |
Source: Aerts and Ragland, 1997.
Table 3-15. Ash fusion temperatures for Switchgrass(°F)
|
Switchgrass Ash |
|
|
Reducing |
Oxidizing |
Initial Deformation |
1905 |
1995 |
Softening |
2175 |
2230 |
Hemispheric |
2235 |
2275 |
Fluid |
2365 |
2380 |
Source: Aerts and Ragland, 1997
3.3.3. Test Program and Results
The test program was conducted over several time periods. Baseline tests were conducted from June 21 – 26, 1996 and July 9 – 16, 1996. Cofiring tests were conducted April 30 – May 15, 1996, May 30 – June 27, 1996, October 1 – 5, 1996, March 7, 1997, and April 24 – 30, 1997. The maximum cofiring percentages achieved were 15.3 percent on a mass basis or 10.2 percent on a heat input basis. These test conditions are shown in Table 3-16.
Final EPRI Report.doc |
123 |
10/31/01 9:18 PM |
Table 3-16. Test summary - co-fire conditions.
|
Load |
Duration |
Cofiring Percentage |
Excess |
|
Date |
(MW) |
(hr) |
Mass (%) |
Btu (%) |
O2 (%) |
5-30-96 |
34.5 |
2.5 |
14.1 |
9.8 |
na |
6-27-96 |
48.5 |
3.0 |
7.1 |
4.8 |
na |
10-1-96 |
39.9 |
3.5 |
15.3 |
10.2 |
6.4 |
10-2-96 |
46.4 |
4.0 |
11.6 |
7.9 |
2.8 |
10-3-96 |
43.8 |
5.5 |
9.2 |
6.0 |
3.1 |
10-4-96 |
47.3 |
4.5 |
7.8 |
5.1 |
3.0 |
10-7-96 |
40.1 |
4.0 |
10.3 |
6.6 |
2.6 |
3-7-97 |
48.0 |
2.0 |
na |
na |
na |
4-24-97 |
48.3 |
9.0 |
10.4 |
6.4 |
2.8 |
4-25-97 |
49.6 |
8.0 |
10.6 |
6.6 |
2.6 |
4-28-97 |
49.1 |
8.0 |
10.5 |
6.2 |
2.5 |
4-29-97 |
49.2 |
8.0 |
10.4 |
6.5 |
2.6 |
4-30-97 |
49.0 |
8.5 |
10.4 |
6.5 |
2.1 |
na - data not available
Source: Aerts and Ragland, 1997
Data were obtained from these tests measuring the impact of cofiring on boiler capacity, efficiency, emissions, and slagging and fouling.
Capacity Impacts. Cofiring did not impact the capacity of the boiler. Because cofiring added a fuel stream without impacting the coal delivery system, the only area where capacity could be impacted was ID fan capacity. This was not compromised.
Efficiency Impacts. The cofiring tests increased auxiliary loads by 236 kW, or about 9 percent of the total house load for the boiler. This decreased net efficiency by about 0.5 percent. The boiler thermal efficiency decreased by an average of 1.1 percent during the cofiring tests. This decrease in efficiency resulted from increased air heater exit temperatures (the opportunity fuel is delivered by ambient air) and consequently increased dry gas losses. Because ambient air delivered the biomass to the boiler, less combustion air was passed through the air heater. This resulted in less heat being transferred from the flue gas to the incoming combustion air—decreasing the thermal efficiency of the boiler. The decrease in efficiency was also caused by increased hydrogen in the fuel. While there was some increase in LOI in the flyash in some—but not all—tests, there were also tests where LOI decreased as a consequence of cofiring.
Slagging and Fouling Impacts. The tests conducted were short term in nature. At the same time, however, observations were made visually. These were supported by measuring the rate of temperature increase at various points (e.g., economizer gas outlet). NETL engineers inserted a water cooled deposition probe in the superheater section during the testing as well. There was no evidence that slagging and fouling would be an operational problem as a consequence of these tests.
Final EPRI Report.doc |
124 |
10/31/01 9:18 PM |
Airborne Emissions Impacts. The impacts on airborne emissions were generally quite favorable as shown in Table 3-17. For all tests—baseline and cofiring tests—CO emissions were <50 ppmv. Opacity decreased by a factor of 2, from an average of 21.6 percent during the baseline tests at 40 MWe to an average of 10.5 percent during cofiring tests at 40 MWe. At 49 MWe of capacity the opacity was 28.6 percent when firing coal during baseline tests, and 11.1 percent when cofiring switchgrass and coal. The opacity results may be a result of precipitator power requirements, however (see Table 3-17). Precipitator power consumption was significantly higher during cofiring than during baseline testing. Interestingly, although a 6 percent reduction in SO2 emissions was expected, no definitive trend of SO2 reductions was achieved. NOx emissions, however, were reduced by an average of 31 percent!
The NOx reductions are dramatic indeed. Aerts and Ragland attribute these results largely to the volatility of the switchgrass as is shown in Figure 3-26.
The Blount St. Station test also demonstrated that, while total CO2 emissions increase during cofiring when compared to baseline operations, fossil fuel-based CO2 emissions do decrease as a consequence of cofiring.
The net result of the switchgrass test by the University of Wisconsin is the extension of previous cofiring results from woody biomass to switchgrass. These results further demonstrate the ability to use separate injection cofiring in wall-fired PC boilers to achieve significant environmental gains without compromising boiler capacity and with only minor impacts on boiler efficiency.
Table 3-17. Average measured flue gas emissions at 3% excess oxygen.
Test |
Load |
Co-fire |
Measured |
Measured |
Measured |
Precip. |
Precipitator |
Condition |
(MW) |
Mass(%) |
SO2 lb/106 Btu |
NOx lb/106 Btu |
Opacity (%) |
(kV2) |
Power (kW) |
Coal-only |
40.2 |
0.0 |
2.417 |
0.511 |
17.9 |
1849 |
10.34 |
Coal-only |
40.7 |
0.0 |
2.188 |
0.509 |
25.3 |
1980 |
4.87 |
Coal-only |
48.8 |
0.0 |
2.487 |
0.574 |
26.8 |
1936 |
5.22 |
Coal-only |
49.2 |
0.0 |
2.233 |
0.544 |
30.5 |
1980 |
4.92 |
Co-fire |
39.9 |
15.3 |
3.040 |
0.471 |
8.7 |
1806 |
14.41 |
Co-fire |
40.1 |
10.3 |
2.291 |
0.371 |
12.2 |
1980 |
9.21 |
Co-fire |
43.8 |
9.2 |
2.340 |
0.411 |
15.3 |
1980 |
7.03 |
Co-fire |
46.4 |
11.6 |
2.300 |
0.422 |
14.1 |
1892 |
9.97 |
Co-fire |
47.3 |
7.8 |
2.431 |
0.462 |
15.5 |
1936 |
6.55 |
Co-fire |
48.3 |
10.4 |
2.375 |
0.496 |
11.7 |
1849 |
10.75 |
Co-fire |
49.0 |
10.4 |
1.843 |
0.364 |
11.0 |
1681 |
17.22 |
Co-fire |
49.1 |
10.5 |
2.286 |
0.432 |
15.1 |
1849 |
8.19 |
Co-fire |
49.2 |
10.4 |
1.995 |
0.364 |
9.9 |
1681 |
17.98 |
Co-fire |
49.6 |
9.9 |
2.303 |
0.411 |
8.0 |
1936 |
14.88 |
Source: Aerts and Ragland, 1997. |
|
|
|
|
|||
Final EPRI Report.doc |
|
|
125 |
|
|
10/31/01 9:18 PM |
|

0.30 |
|
|
|
|
|
|
|
|
|
|
|
|
|
|
|
|
|
|
|
|
|
|
|
0.25 |
|
|
|
|
|
|
|
|
|
|
|
|
|
|
|
|
|
|
|
|
|
|
|
0.20 |
|
|
|
|
|
|
|
|
|
|
|
|
|
|
|
|
|
|
|
|
|
|
|
|
|
|
|
|
|
|
|
|
|
|
|
|
|
|
|
|
|
|
|
|
|
|
|
|
|
|
|
coal |
|||||||
|
|
|
|
||||||||
0.15 |
|
|
|
|
|||||||
|
|
|
|
||||||||
|
|
|
|
co-fire |
|||||||
|
|
|
|
||||||||
|
|
|
|
|
|||||||
0.10 |
|
|
|
|
|
|
|
|
|
|
|
0.50 |
1.00 |
1.50 |
2.00 |
|
Fuel Volatile / Fixed Carbon Ratio |
|
|
Figure 3-26. NOx Emissions in g/MJ at Blount St. Station as a Function of Volatile/Fixed Carbon Ratio of the Combined Fuel Feed
Source: Aerts and Ragland, 1997.
3.4.CONCLUSIONS REGARDING COFIRING IN WALL FIRED PULVERIZED COAL BOILERS
The EPRI-USDOE Cooperative Agreement proved highly useful in promoting commercialization of biomass cofiring in wall-fired PC boilers. It was used to commercialize low percentage cofiring at the Colbert Fossil Plant of TVA, and to demonstrate its usefulness in cofiring at higher percentages using direct injection technologies. Cofiring did cause modest declines in boiler efficiency in the Seward and Blount St. Station tests. However it was instrumental in reducing airborne emissions including NOx. The testing demonstrated that the volatile yield of biomass can be instrumental in modifying the combustion process in wall fired PC boilers to the advantage of operations.
Final EPRI Report.doc |
126 |
10/31/01 9:18 PM |
4.0.COOPERATIVE AGREEMENT SUPPORT FOR COFIRING IN TANGENTIALLY-FIRED PULVERIZED COAL BOILERS
4.1.INTRODUCTION
The process of combustion in T-fired PC boilers is fundamentally different from the process of combustion in wall-fired PC boilers. While wall-fired boilers employ discrete burners with distinct flames and combustion zones, T-fired boilers employ a single fireball in the center of the furnace. T- fired boilers have been conceptually viewed as operations where the furnace is the burner, and the burner has multiple fuel and air injection points. Typically T-fired boilers have lower furnace heat release rates (Btu/ft3-hr of furnace volume) than wall-fired boilers. Typically, also, T-fired boilers have lower NOx emissions than wall-fired boilers.
The fact that T-fired boilers have a single fireball, as opposed to discrete flames from individual burners, has made them an appealing technology for cofiring. They have been considered to be highly flexible in the application of cofiring. Consequently EPRI supported the initial tests at the Kingston Fossil Plant of TVA. Through the Cooperative Agreement, EPRI and USDOE supported cofiring demonstrations at Greenidge Station of New York State Electric and Gas (NYSEG – now AES), the Albright Generating Station of Allegheny Energy Supply Company, LLC (Allegheny), and Plant Gadsden, a Southern Company. In the Greenidge and Gadsden tests and demonstrations, EPRI and the Cooperative Agreement had a minor supporting role. In the Albright Generating Station demonstration of Allegheny, EPRI funded the test program.
4.2.DEMONSTRATING BIOMASS COFIRING AT GREENIDGE STATION
The Greenidge Station project is described by Benjamin (1995) and Benjamin (1996). Beginning in 1994, NYSEG began investigations into cofiring biomass at their Greenidge Station in Dresden, NY. This program ultimately resulted in the development of a commercial demonstration of biomass cofiring. The project originally obtained funding from New York State Research and Development Authority (Benjamin, 1995). Subsequently it obtained significant corporate funding. EPRI provided supporting funds as a secondary participant. This project is summarized by Battista and Hughes (2000).
Greenidge Station, located on the shores of Lake Seneca, houses three boilers: Units #6, #7, and #8. Unit #6, chosen for cofiring, is a 750,000 lb/hr T-fired boiler connected to a 108 MWe turbinegenerator (Battista and Hughes, 2000). The plant is located in reasonably close proximity to forests and wood products industries in New York, and to numerous farms capable of growing willow or hybrid poplar as energy crops. It has good truck access and rail access.
This unit was equipped with a separate injection cofiring system capable of supporting 30 percent cofiring on a mass input basis. Much of the equipment came from Rochester, NY—from the former refuse-derived fuel (RDF) plant installed at that location. Initially NYSEG evaluated installing either a
Final EPRI Report.doc |
127 |
10/31/01 9:18 PM |
separate pneumatic injection of ¼” x 0” material to be burned in suspension, or a system for pneumatically injecting 2” x 0” wood chips, with the latter system requiring a dump grate as well as a fuel transport system. NYSEG chose to install the first option capable of delivering 7.5 ton/hr of finely divided woody biomass to the boiler.
The unit receives dry wood waste and fires this material 16 hours/day. The wood waste is received and ground to a ¼” x 0” particle size in two hammermills. Every pound of biomass goes through the hammermills, rather than screens. Following grinding, the wood particles are blown through two separate transport lines to the boiler. Typically the unit cofires at 15 percent (heat input basis), and fired over 30,000 ton of dry wood waste in 1999. This wood waste typically has 10 – 40 percent moisture and 4,500 – 8,000 Btu/lb. The target material contains little moisture and 7,800 Btu/lb.
Cofiring at Greenidge Station is an economic proposition. Typically the unit experiences an efficiency decrease of 0.8 percent. Particulate emissions and carbon monoxide emissions from the unit have not increased as a consequence of cofiring. SO2 emissions decreased by about 15 percent, consistent with the firing of a low sulfur fuel.
Initial indications were that there would be a modest NOx reduction (Benjamin, 1996), although the early tests were not conclusive. Operating data continues to show some NOx reduction, although that reduction is not considered significant (Battista and Hughes, 2000).
The Greenidge program, then, shows that cofiring can be performed in a cost-effective manner, depending upon the relative costs of wood and coal, and depending upon the performance of the unit when cofiring.
4.3.COFIRING AT THE ALBRIGHT GENERATING STATION OF ALLEGHENY ENERGY SUPPLY CO., LLC.
Allegheny Energy Supply Company, LLC initiated a cofiring demonstration at its 140 MWe (net) tangentially-fired Albright Generating Station boiler #3 in 2000. Funding for construction of the facility was supplied by USDOE-EERE and USDOE-NETL. Funding for the testing portion of the demonstration was supplied by EPRI through the Cooperative Agreement. This program has been described in several recent papers and presentations (see Payette and Tillman, 2001; Tillman and Payette, 2001; Tillman, Payette, and Battista, 2000).
The objective of the biomass cofiring system at the Albright Generating Station was emissions reduction—particularly NOx emissions reduction. It provided a means for evaluating cofiring as an approach to the “3P Strategy” – addressing simultaneously the emissions of NOx, SO2, and mercury. Because Albright Unit #3 is equipped with a 3-level separated overfire air (SOFA) system, particular attention has been given to the ability to integrate sawdust cofiring into the staged combustion strategy for NOx control. The initial investigations of this demonstration were quite favorable; sawdust could be obtained in a cost-competitive manner for this demonstration.
Final EPRI Report.doc |
128 |
10/31/01 9:18 PM |
4.3.1. Design of the Albright Generating Station Cofiring System
The cofiring system was designed around the following principles:
∙Screening of all sawdust to a particle size of ¼” x 0”
∙Separate pneumatic lines, and separate blowers, for each injection point
∙Maximum attention to safety issues, including check valves on injection lines and high velocity transport of the sawdust to the boiler
The equipment originally installed at the Seward Generating Station was relocated to Albright and upgraded (see Figure 4-1). Sawdust is received in the walking floor unloader (see Figure 4-2). It is then transported to the screen. The trommel screen installed at Seward was replaced with a disc screen to minimize dust generation (see Figure 4-3). Screened material is then transported to the silo for storage. It is reclaimed from the silo, metered using the weigh belt feeder (Figure 4-4), and injected into the pneumatic transport lines through rotary airlocks. The sawdust, blown to the boiler, is injected into the boiler through two specially designed biomass injectors (see Figure 4-5) that are installed in opposite corners of the furnace. There are four rows of coal injectors in Albright Unit #3; the sawdust injectors are installed between the B and C levels. The entire system is controlled in the control room (see Figure 4-6). The operator can set the desired cofiring level consistent with operating conditions at the time.
Final EPRI Report.doc |
129 |
10/31/01 9:18 PM |
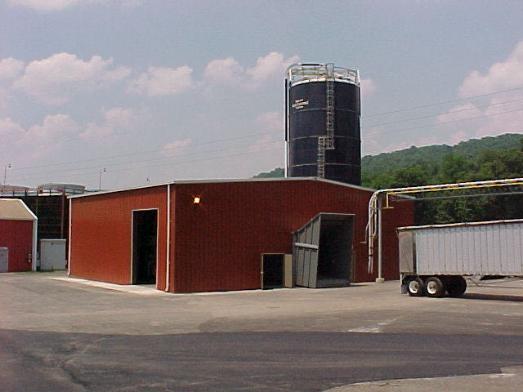
Figure 4-1. Overview of the Cofiring Installation at Albright Generating Station
Final EPRI Report.doc |
130 |
10/31/01 9:18 PM |