

|
86.2 |
|
|
|
|
|
|
|
|
|
|
|
86 |
|
|
|
|
|
|
|
|
|
|
|
85.8 |
|
|
|
|
|
|
|
|
|
|
Percent |
85.6 |
|
|
|
|
|
|
|
|
|
|
85.4 |
|
|
|
|
|
|
|
|
|
|
|
Efficiency, |
|
|
|
|
|
|
|
|
|
|
|
85.2 |
y = -0.0001x3 - 0.0018x2 - 0.0014x + 86.015 |
|
|
|
|
|
|||||
|
|
|
|
|
|
||||||
85 |
|
|
R2 = 0.76 |
|
|
|
|
|
|
|
|
Boiler |
84.8 |
|
|
|
|
|
|
|
|
|
|
|
|
|
|
|
|
|
|
|
|
|
|
|
84.6 |
|
|
|
|
|
|
|
|
|
|
|
84.4 |
|
|
|
|
|
|
|
|
|
|
|
84.2 |
|
|
|
|
|
|
|
|
|
|
|
0 |
2 |
4 |
6 |
8 |
10 |
12 |
14 |
16 |
18 |
20 |
Percent Cofiring, Mass Basis
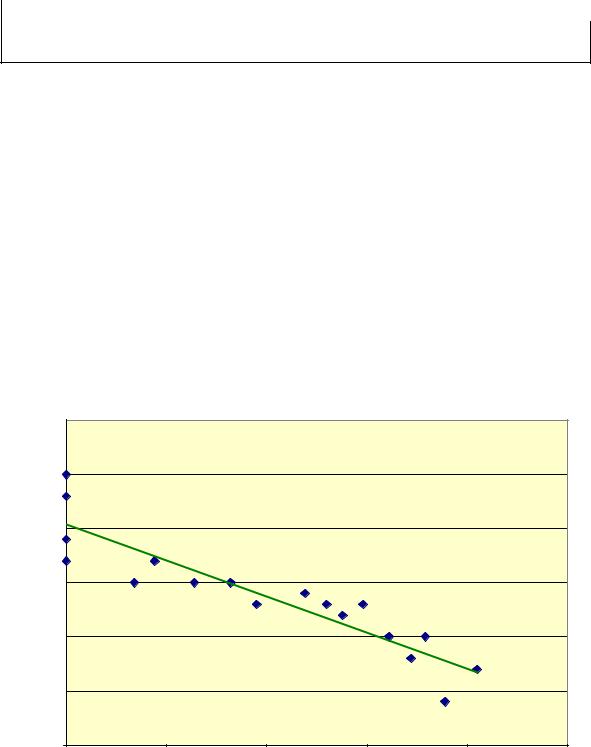
Figure 3-8. Boiler Efficiency Measured During the Seward Parametric Tests
The efficiency results, with a coefficient of determination, r2 = 0.76, document the fact that numerous other variables besides cofiring level were impacting boiler performance. These variables included (not exhaustive) biomass moisture content, coal moisture content, boiler load and the operating conditions required to satisfy load, and other similar considerations. Unburned carbon in the flyash was a consideration in the lost efficiencies when cofiring at or above 16 percent (mass basis).
A parallel efficiency graph can be shown measuring cofiring on a heat input or Btu basis, as is shown in Figure 3-9. Note that the coefficient of determination declines to 0.70, based upon variability in the Btu content of the biomass and the moisture content of the biomass or sawdust.
Final EPRI Report.doc |
101 |
10/31/01 9:18 PM |

|
86.2 |
|
|
|
|
|
|
|
|
86 |
|
|
|
|
|
|
|
(% |
85.8 |
|
|
|
|
|
|
|
|
|
|
|
|
|
|
|
|
Efficiency |
85.6 |
|
|
|
|
|
|
|
85.4 |
|
|
|
|
|
|
|
|
|
|
|
|
|
|
|
|
|
Boiler |
85.2 |
|
|
|
|
|
|
|
|
|
|
|
|
|
|
|
|
Calculated |
85 |
|
|
|
|
|
|
|
84.8 |
|
y = -0.0085x2 - 0.059x + 86.047 |
|
|
|
|||
|
|
|
|
|
||||
84.6 |
|
R |
2 |
= 0.70 |
|
|
|
|
|
|
|
|
|
||||
|
|
|
|
|
|
|||
|
84.4 |
|
|
|
|
|
|
|
|
84.2 |
|
|
|
|
|
|
|
|
0 |
2 |
4 |
|
6 |
8 |
10 |
12 |
Cofiring Percent (Heat Input or Btu Basis)
Figure 3-9. Boiler Efficiency at the Seward Tests as Influenced by Cofiring Level (Btu Basis)
The issue of efficiency is accompanied by the consideration of cofiring impacts on flame temperature. Using Gibbs Free Energy calculations, flame temperatures were calculated during the December 1996 tests as shown in Table 3-6. The Gordon-McBride code, CET-89 (Gordon and McBride, 1976), was used to perform these calculations. There is very little flame temperature impact from cofiring.
Table 3-6. Calculated Flame Temperatures During December 1996 Seward Tests
Test No. |
Percent Coal* |
Percent Wood* |
Excess O2 % |
Adiabatic |
Est. Actual |
||
|
mass |
heat |
mass |
heat |
(plant data) |
Flame Temp |
Flame Temp |
|
|
|
|
|
|
(oF) |
(oF) |
1 |
100 |
96.9 |
0 |
0 |
4.49 |
3440.9 |
2660.8 |
2 |
90.3 |
93.3 |
9.7 |
3.7 |
4.32 |
3329.3 |
2571.5 |
3 |
82.3 |
90.1 |
17.7 |
7.2 |
3.90 |
3466.1 |
2681.0 |
4 |
90.9 |
94.2 |
9.1 |
2.9 |
4.46 |
3424.7 |
2678.9 |
5 |
83.3 |
91.7 |
16.7 |
5.7 |
4.02 |
3552.5 |
2750.1 |
6 |
79.3 |
88.7 |
20.7 |
8.7 |
4.49 |
3431.9 |
2653.6 |
7 |
85.2 |
91.1 |
14.8 |
5.9 |
5.16 |
3356.3 |
2593.1 |
8 |
79.5 |
89.9 |
20.5 |
7.2 |
4.64 |
3323.9 |
2567.2 |
9a |
100 |
96.5 |
0 |
0 |
6.95 |
3248.0 |
2506.7 |
9b |
81.1 |
90.4 |
18.9 |
6.5 |
4.95 |
3206.9 |
2473.6 |
10 |
100 |
96.6 |
0 |
0 |
5.93 |
3323.9 |
2567.2 |
Final EPRI Report.doc |
102 |
10/31/01 9:18 PM |

∙The difference between the total heat input, and the heat input from the coal and the wood, is the heat input from the combustion air exiting the FD fan.
Resulting from all of the efficiency calculations is the following equation (r2 = .89):
η = 87.6 – 0.14(EO2) – 0.16(UBC) – 0.11(W) |
[11] |
Where EO2 is percent excess O2 measured on a wet basis, UBC is percent unburned carbon in the flyash, and W is percent wood in the fuel mix on a heat input or Btu basis. The probabilities of the equation, or any component, being random are as follows: total equation, 0.000125; intercept, 4.24x10⁻²⁴; EO2, 0.77; UBC, 0.0027; and W, 0.00072. The excess O2 did not show as statistically significant simply because of the narrow range of observed values in the tests. Given these probabilities, the equation is considered to be robust, and the impact of cofiring is to reduce boiler efficiency by about 1 percent for every 10 percent on a heat input basis—or 1 percent for every 20 percent on a mass input basis. However the interrelationships between variables, particularly at high levels of cofiring (e.g., higher UBC or LOI values when cofiring >16 percent on a mass basis) creates the curves shown in Figures 3-8 and 3-9.
The emissions impacts of cofiring during the parametric tests at the Seward Generating Station included impacts on opacity, SO2 emissions, CO emissions, and NOx emissions. These are in addition to the benefits of reducing fossil CO2 emissions by substituting sawdust for coal and reducing sawdust disposal.
Opacity was largely not impacted by cofiring at Seward Generating Station. SO2 emissions were reduced in proportion to the heat input of biomass into the boiler, adjusted for efficiency impacts. These results were consistent with previous parametric testing.
Carbon monoxide emissions were measured during the December 1996 tests, as shown in Table 3-7.
Table 3-7. Carbon Monoxide Emissions from Cofiring Tests at Seward Generating Station
Test |
Percent Coal* |
Percent |
Excess O2 |
CO |
|||
No. |
|
|
Wood* |
% |
|
|
|
|
Mass |
Heat |
Mass |
Heat |
(Plant) |
ppmv |
|
1 |
100 |
96.9 |
0 |
0 |
4.49 |
11.5 |
|
2 |
90.3 |
93.3 |
9.7 |
3.7 |
4.32 |
10.5 |
|
3 |
82.3 |
90.1 |
17.7 |
7.2 |
3.90 |
13.0 |
|
4 |
90.9 |
94.2 |
9.1 |
2.9 |
4.46 |
12.5 |
|
5 |
83.3 |
91.7 |
16.7 |
5.7 |
4.02 |
16.0 |
|
6 |
79.3 |
88.7 |
20.7 |
8.7 |
4.49 |
12.0 |
|
7 |
85.2 |
91.1 |
14.8 |
5.9 |
5.16 |
13.0 |
|
8 |
79.5 |
89.9 |
20.5 |
7.2 |
4.64 |
17.5 |
|
9a |
100 |
96.5 |
0 |
0 |
6.95 |
12.0 |
|
9b |
81.1 |
90.4 |
18.9 |
6.5 |
4.95 |
18.0 |
|
Final EPRI Report.doc |
103 |
10/31/01 9:18 PM |
10 |
100 |
96.6 |
0 |
0 |
5.93 |
8.5 |
∙The difference between the total heat input, and the heat input from the coal and the wood, is the heat input from the combustion air exiting the FD fan.
Note that there was no impact of cofiring on CO emissions. This is consistent with the LOI results shown previously. There were slightly elevated CO emissions only when cofiring was practiced at levels >16 percent (mass basis). Even then, CO emissions were <20 ppmv. Cofiring did not impact fuel burnout in any significant way.
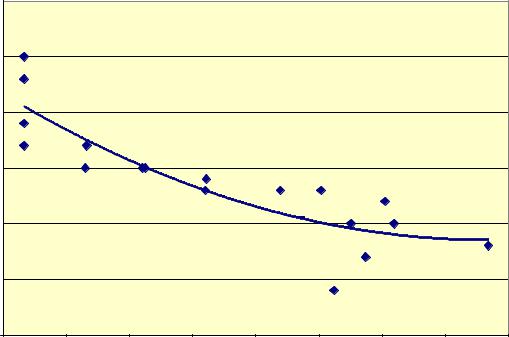
NOx emissions decreased as a function of cofiring, as is shown in Figures 3-10 and 3-11. Note that the boiler was not equipped with low-NOx burners, and the consequent baseline emissions were quite high. The decreases experienced were on the order of the NOx reductions measured previously at the Allen Fossil Plant.
It is useful to evaluate the mechanisms associated with NOx emissions in wall-fired PC boilers to determine their similarities and differences from the mechanisms operating in T-fired PC boilers and cyclone boilers. Again the tools used for analysis were statistical calculations. Comparisons were made to reduced fuel nitrogen content as well.
|
1 |
|
|
|
|
|
|
0.95 |
|
|
|
|
|
(lb/MMBtu) |
0.9 |
|
|
|
|
|
|
|
|
|
|
|
|
Emissions |
0.85 |
|
|
|
|
|
0.8 |
|
|
|
|
|
|
NOx |
|
|
|
|
|
|
|
y = -0.0066x + 0.9039 |
|
|
|
|
|
|
R2 = 0.83 |
|
|
|
|
|
|
|
|
|
|
|
|
|
0.75 |
|
|
|
|
|
|
0.7 |
|
|
|
|
|
|
0 |
5 |
10 |
15 |
20 |
25 |
Percent Cofiring (Mass Basis)
Final EPRI Report.doc |
104 |
10/31/01 9:18 PM |
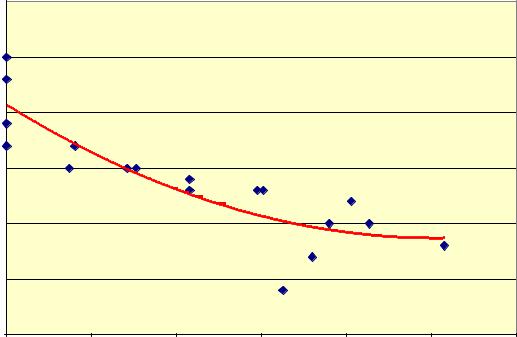
Figure 3-10. NOx Emissions Measured at the Seward Parametric Tests as a Function of Cofiring (mass basis)
|
1 |
|
(lb/MMBtu) |
0.95 |
|
0.9 |
||
Emissions |
||
0.85 |
||
|
||
NOx |
0.8 |
|
|
||
|
0.75 |
|
|
0.7 |
0
y = 0.0012x2 - 0.0237x + 0.907 R2 = 0.76
2 |
4 |
6 |
8 |
10 |
12 |
Percent Cofiring (Heat Input or Btu basis)
Figure 3-11. NOx Emissions Measured at the Seward Parametric Tests as a Function of Cofiring (heat input or Btu basis)
The initial mechanism examined was reduction in fuel nitrogen of the total fuel. This resulted in the following regression equation:
NOx = 0.5834FN + 0.2556 |
[12] |
Where NOx is measured in lb/106 Btu, and FN is fuel nitrogen in lb/106 Btu. However the r2 for this equation is only 0.235. The probability of the outcome being random is only 0.041, indicating that fuel nitrogen impacts the emissions, however it is not the dominant actor. When fuel nitrogen is combined with traditional parameters—firing rate, excess O2, and fuel volatility, the resulting regression equation is as follows:
NOx = 1.36 + 0.000265(FR) + 0.0161(EO2) – 0.38(FN) – 0.741(V/FC) |
[13] |
Where NOx is measured in lb/106 Btu, FR is firing rate (106 Btu/hr), EO2 is percent excess O2 on a wet basis, FN is fuel nitrogen measured in lb/106 Btu, and V/FC is the volatile/fixed carbon ratio from the proximate analysis. The r2 for this equation is 0.75. The probability that the equation is a random
Final EPRI Report.doc |
105 |
10/31/01 9:18 PM |
occurrence is 0.000721. The probabilities of the individual components are interesting, however, as shown below:
∙Probability that the intercept occurs as a random event: 0.0008
∙Probability that FR occurs as a random event: 0.65
∙Probability that EO2 occurs as a random event: 0.35
∙Probability that FN occurs as a random event: 0.30
∙Probability that V/FC occurs as a random event: 0.0009
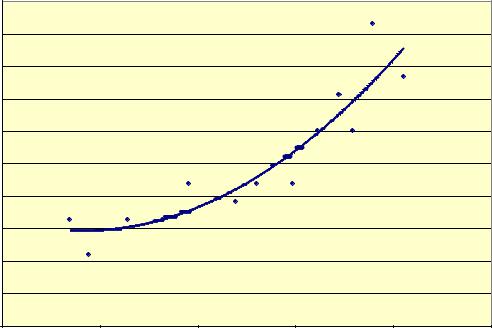
The equation, taken as a whole, is robust. Of the variables, however, only the volatility of the fuel is highly significant. The influence of the volatility of the fuel is a function of mass percentage, rather than heat input percentage. It is shown in Figure 3-12.
NOx Emissions (lb/MMBtu)
1
0.95
y = 2.469x2 - 2.7161x + 1.5325 R2 = 0.76
0.9
0.85
0.8
0.75
0.7 |
|
|
|
|
|
|
|
|
0.320 |
0.350 |
0.380 |
0.410 |
0.440 |
0.470 |
0.500 |
0.530 |
0.560 |
Volatile/Fixed Carbon Ratio
Figure 3-12. NOx Emissions as a Function of Volatile/Fixed Carbon Ratio During the Parametric Tests at Seward Generating Station
Based upon the analyses made during the parametric testing at Seward Generating Station, significant NOx reductions occurred as a consequence of cofiring, as is summarized in Figure 3-13. These reductions resulted largely from flooding the coal flames with volatiles, creating a strong reducing environment at the base of the flame. Previously it was shown that sawdust releases its volatiles rapidly—and its nitrogen volatiles even more rapidly—causing them to be released in a fuel-rich environment (see Figure 2-7). This contrasts with the pattern of nitrogen volatile release from eastern
Final EPRI Report.doc |
106 |
10/31/01 9:18 PM |
bituminous coal (see Baxter et. al., 1996c). Further, it is important to note the kinetics of sawdust devolatilization and char oxidation relative to eastern bituminous coal devolatilization and char oxidation. Arrhenius equation parameters for devolatilization and char oxidation are shown in Table 3-8.
Percent NOx Reduction
20.00%
18.00%
16.00%
14.00%
12.00%
10.00%
8.00%
6.00%
4.00%
2.00%
0.00%
0
y = 0.0004x2 - 0.0034x + 0.0657 R2 = 0.8507
5 |
10 |
15 |
20 |
25 |
Percent Cofiring, Mass Basis
Figure 3-13. Percentage NOx Reductions Measured During Parametric Testing at Seward Generating Station.
Table 3-8. Kinetic Parameters for Sawdust and Pittsburgh Seam Bituminous Coal
Fuel |
Reaction |
Pre-exponential |
Activation Energy E |
|
|
Constant A (1/sec) |
(kcal/mol) |
Sawdust |
Low Temperature |
1.17 |
0.681 |
|
Devolatilization (400 – |
|
|
|
600 oC) |
|
|
Sawdust |
Higher Temperature |
5.74 |
3.42 |
|
Devolatilization (600 – |
|
|
|
1000 oC) |
|
|
Pittsburgh Seam Coal |
Devolatilization (1000 – |
66.2 |
10.3 |
|
1700 oC) |
|
|
Sawdust |
Char Oxidation |
1.63 E +5 |
25.7 |
|
|
|
|
Pittsburgh Seam Coal |
Char Oxidation |
3.27 E +9 |
40.4 |
Source: Johnson et. al., 2001.
Final EPRI Report.doc |
107 |
10/31/01 9:18 PM |
The ability of sawdust to devolatilizes rapidly, and at low temperatures, has the potential to create ignition of the entire fuel mass in a fuel rich environment. This process can result in staging of combustion within the flame, thereby reducing NOx emissions. Because the fuel nitrogen is also released early, and in the fuel rich environment, it converts to N2 as there is insufficient oxygen available to oxidize this nitrogen to NO.
The parametric tests at Seward Generating Station of GPU Genco were considered highly successful. They documented the potential for increasing the cofiring percentage by separate injection into wall fired PC boilers. They documented potential beneficial impacts when cofiring with wet coal, and additional emissions benefits. They also documented the fact that efficiency impacts would be modest, and could be managed. The success of this test program led to the decision on the part of GPU and the EPRIUSDOE Cooperative Agreement to pursue a demonstration at that site.
3.3.2. The Seward Generating Station Demonstration
Based upon the success of the parametric testing, Seward Generating Station proceeded with the development of a cofiring demonstration facility utilizing separate injection of the sawdust into the #12 boiler. The design of the facility was based upon maximum use of the parametric test equipment. Further, the design was based upon the following principles:
∙Providing a separate pressurized line, with positive air and fuel flow control, to each injection point in the boiler
∙Preparing the fuel by screening, rather than grinding, with only oversized material being ground to <¼” x 0” particle sizes
∙Complete integration of the controls into the power plant Bailly control system
The test program was designed to conform with, and amplify, the parametric tests. Again the emphasis was on capacity, efficiency, and emissions.
3.3.2.1. Design of the Seward Generating Station Demonstration System
The design of the Seward facility called for equipment to receive sawdust in walking floor vans, and to unload that sawdust in a manner that would minimize exposure to weather. The sawdust, therefore, would be unloaded into a walking floor unloader (see Figure 3-14). Once unloaded the sawdust would be immediately transported by means of a incline screw conveyor to a trommel screen (see Figure 3- 15) for processing. The sawdust, screened to <¼” particle size, would then be pneumatically transported into a Harvistore Silo shown in Figure 3-14.
Final EPRI Report.doc |
108 |
10/31/01 9:18 PM |
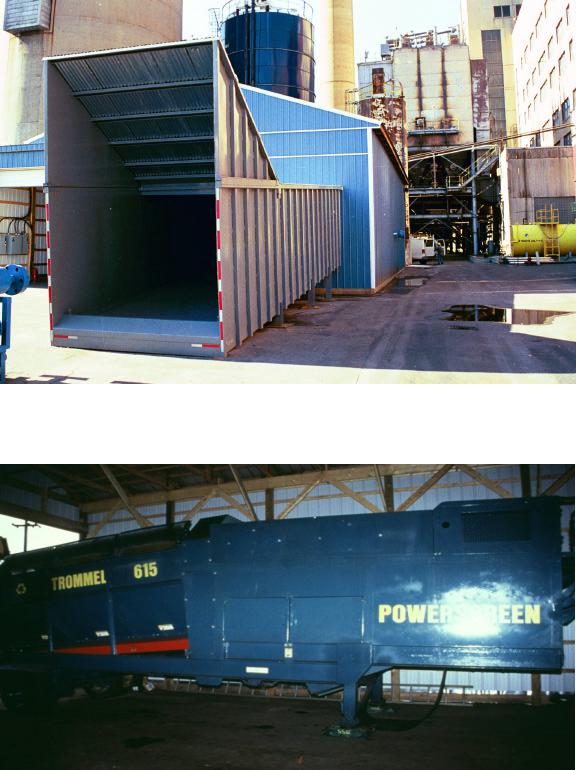
Figure 3-14. The Seward Demonstration Facility Walking Floor Sawdust Unloader
Figure 3-15. Installation of the Trommel Screen for Sawdust Preparation at Seward Generating Station
Final EPRI Report.doc |
109 |
10/31/01 9:18 PM |

Sawdust was to be reclaimed from the silo using a Laidig unloader, and would be transported to a surge hopper with a paddle conveyor, then from the surge hopper across a weigh belt feeder, and then deposited into a live bottom bin where metering screws would transport the sawdust to rotary air locks. The rotary air locks would discharge the sawdust into pneumatic transport lines. Each transport line would be supplied by an individual blower. Each burner of the boiler would be fed by a separate pneumatic transport line in order to control the flow of sawdust to each combustion system.
The sawdust, once transported, would be injected down the centerpipe of the selected burners. While the parametric test program involved firing the sawdust into each burner in the top row of burners, difficulties with the flame scanners resulted in a change during the demonstration. The sawdust was blown down the centerpipe of the two center burners—feeding sawdust to one burner in each row (see Figure 3-16). Once the sawdust entered the centerpipe, it was transported to the burner front. There the sawdust was diffused into the coal flame using the same diffusers and techniques employed during the parametric tests (see Figures 3-5 and 3-6 as previously shown). The transport velocity of the sawdust to the burner is 5,000 ft/min in order to overcome the flame speed of wood waste. The angle on the diffuser is set at 130o compared to a burner basket angle of 120o. This creates a “flame within a flame” for sound combustion of the sawdust as previously discussed.
Figure 3-16. Flexible Pipe Connections for the Sawdust at the Seward Burner Front
The facility was constructed during the last quarter of 1998 and the first quarter of 1999. At that time GPU Genco expressed significant interest in expanding the project to Boiler #15, a 147 MWe tangentially-fired unit. Foster Wheeler designed special inserts for pneumatic injection of sawdust
Final EPRI Report.doc |
110 |
10/31/01 9:18 PM |
