

- •About
- •Chapter 1: Getting started with C++
- •Section 1.1: Hello World
- •Section 1.2: Comments
- •Section 1.3: The standard C++ compilation process
- •Section 1.4: Function
- •Section 1.5: Visibility of function prototypes and declarations
- •Section 1.6: Preprocessor
- •Chapter 2: Literals
- •Section 2.1: this
- •Section 2.2: Integer literal
- •Section 2.3: true
- •Section 2.4: false
- •Section 2.5: nullptr
- •Chapter 3: operator precedence
- •Section 3.1: Logical && and || operators: short-circuit
- •Section 3.2: Unary Operators
- •Section 3.3: Arithmetic operators
- •Section 3.4: Logical AND and OR operators
- •Chapter 4: Floating Point Arithmetic
- •Section 4.1: Floating Point Numbers are Weird
- •Chapter 5: Bit Operators
- •Section 5.1: | - bitwise OR
- •Section 5.2: ^ - bitwise XOR (exclusive OR)
- •Section 5.3: & - bitwise AND
- •Section 5.4: << - left shift
- •Section 5.5: >> - right shift
- •Chapter 6: Bit Manipulation
- •Section 6.1: Remove rightmost set bit
- •Section 6.2: Set all bits
- •Section 6.3: Toggling a bit
- •Section 6.4: Checking a bit
- •Section 6.5: Counting bits set
- •Section 6.6: Check if an integer is a power of 2
- •Section 6.7: Setting a bit
- •Section 6.8: Clearing a bit
- •Section 6.9: Changing the nth bit to x
- •Section 6.10: Bit Manipulation Application: Small to Capital Letter
- •Chapter 7: Bit fields
- •Section 7.1: Declaration and Usage
- •Chapter 8: Arrays
- •Section 8.1: Array initialization
- •Section 8.2: A fixed size raw array matrix (that is, a 2D raw array)
- •Section 8.3: Dynamically sized raw array
- •Section 8.4: Array size: type safe at compile time
- •Section 8.5: Expanding dynamic size array by using std::vector
- •Section 8.6: A dynamic size matrix using std::vector for storage
- •Chapter 9: Iterators
- •Section 9.1: Overview
- •Section 9.2: Vector Iterator
- •Section 9.3: Map Iterator
- •Section 9.4: Reverse Iterators
- •Section 9.5: Stream Iterators
- •Section 9.6: C Iterators (Pointers)
- •Section 9.7: Write your own generator-backed iterator
- •Chapter 10: Basic input/output in c++
- •Section 10.1: user input and standard output
- •Chapter 11: Loops
- •Section 11.1: Range-Based For
- •Section 11.2: For loop
- •Section 11.3: While loop
- •Section 11.4: Do-while loop
- •Section 11.5: Loop Control statements : Break and Continue
- •Section 11.6: Declaration of variables in conditions
- •Section 11.7: Range-for over a sub-range
- •Chapter 12: File I/O
- •Section 12.1: Writing to a file
- •Section 12.2: Opening a file
- •Section 12.3: Reading from a file
- •Section 12.4: Opening modes
- •Section 12.5: Reading an ASCII file into a std::string
- •Section 12.6: Writing files with non-standard locale settings
- •Section 12.7: Checking end of file inside a loop condition, bad practice?
- •Section 12.8: Flushing a stream
- •Section 12.9: Reading a file into a container
- •Section 12.10: Copying a file
- •Section 12.11: Closing a file
- •Section 12.12: Reading a `struct` from a formatted text file
- •Chapter 13: C++ Streams
- •Section 13.1: String streams
- •Section 13.2: Printing collections with iostream
- •Chapter 14: Stream manipulators
- •Section 14.1: Stream manipulators
- •Section 14.2: Output stream manipulators
- •Section 14.3: Input stream manipulators
- •Chapter 15: Flow Control
- •Section 15.1: case
- •Section 15.2: switch
- •Section 15.3: catch
- •Section 15.4: throw
- •Section 15.5: default
- •Section 15.6: try
- •Section 15.7: if
- •Section 15.8: else
- •Section 15.9: Conditional Structures: if, if..else
- •Section 15.10: goto
- •Section 15.11: Jump statements : break, continue, goto, exit
- •Section 15.12: return
- •Chapter 16: Metaprogramming
- •Section 16.1: Calculating Factorials
- •Section 16.2: Iterating over a parameter pack
- •Section 16.3: Iterating with std::integer_sequence
- •Section 16.4: Tag Dispatching
- •Section 16.5: Detect Whether Expression is Valid
- •Section 16.6: If-then-else
- •Section 16.7: Manual distinction of types when given any type T
- •Section 16.8: Calculating power with C++11 (and higher)
- •Section 16.9: Generic Min/Max with variable argument count
- •Chapter 17: const keyword
- •Section 17.2: Const member functions
- •Section 17.3: Const local variables
- •Section 17.4: Const pointers
- •Chapter 18: mutable keyword
- •Section 18.1: mutable lambdas
- •Section 18.2: non-static class member modifier
- •Chapter 19: Friend keyword
- •Section 19.1: Friend function
- •Section 19.2: Friend method
- •Section 19.3: Friend class
- •Chapter 20: Type Keywords
- •Section 20.1: class
- •Section 20.2: enum
- •Section 20.3: struct
- •Section 20.4: union
- •Chapter 21: Basic Type Keywords
- •Section 21.1: char
- •Section 21.2: char16_t
- •Section 21.3: char32_t
- •Section 21.4: int
- •Section 21.5: void
- •Section 21.6: wchar_t
- •Section 21.7: float
- •Section 21.8: double
- •Section 21.9: long
- •Section 21.10: short
- •Section 21.11: bool
- •Chapter 22: Variable Declaration Keywords
- •Section 22.1: decltype
- •Section 22.2: const
- •Section 22.3: volatile
- •Section 22.4: signed
- •Section 22.5: unsigned
- •Chapter 23: Keywords
- •Section 23.1: asm
- •Section 23.3: typename
- •Section 23.4: explicit
- •Section 23.5: sizeof
- •Section 23.6: noexcept
- •Chapter 24: Returning several values from a function
- •Section 24.1: Using std::tuple
- •Section 24.2: Structured Bindings
- •Section 24.3: Using struct
- •Section 24.4: Using Output Parameters
- •Section 24.5: Using a Function Object Consumer
- •Section 24.6: Using std::pair
- •Section 24.7: Using std::array
- •Section 24.8: Using Output Iterator
- •Section 24.9: Using std::vector
- •Chapter 25: Polymorphism
- •Section 25.1: Define polymorphic classes
- •Section 25.2: Safe downcasting
- •Section 25.3: Polymorphism & Destructors
- •Chapter 26: References
- •Section 26.1: Defining a reference
- •Section 27.1: Definitions
- •Section 27.2: Deep copying and move support
- •Chapter 28: C++ function "call by value" vs. "call by reference"
- •Section 28.1: Call by value
- •Chapter 29: Copying vs Assignment
- •Section 29.1: Assignment Operator
- •Section 29.2: Copy Constructor
- •Section 29.3: Copy Constructor Vs Assignment Constructor
- •Chapter 30: Pointers
- •Section 30.1: Pointer Operations
- •Section 30.2: Pointer basics
- •Section 30.3: Pointer Arithmetic
- •Chapter 31: Pointers to members
- •Section 31.1: Pointers to static member functions
- •Section 31.2: Pointers to member functions
- •Section 31.3: Pointers to member variables
- •Section 31.4: Pointers to static member variables
- •Chapter 32: The This Pointer
- •Section 32.1: this Pointer
- •Section 32.2: Using the this Pointer to Access Member Data
- •Section 32.4: this Pointer CV-Qualifiers
- •Section 32.5: this Pointer Ref-Qualifiers
- •Chapter 33: Smart Pointers
- •Section 33.1: Unique ownership (std::unique_ptr)
- •Section 33.2: Sharing ownership (std::shared_ptr)
- •Section 33.4: Using custom deleters to create a wrapper to a C interface
- •Section 33.5: Unique ownership without move semantics (auto_ptr)
- •Section 33.6: Casting std::shared_ptr pointers
- •Section 33.7: Writing a smart pointer: value_ptr
- •Section 33.8: Getting a shared_ptr referring to this
- •Chapter 34: Classes/Structures
- •Section 34.1: Class basics
- •Section 34.2: Final classes and structs
- •Section 34.3: Access specifiers
- •Section 34.4: Inheritance
- •Section 34.5: Friendship
- •Section 34.6: Virtual Inheritance
- •Section 34.7: Private inheritance: restricting base class interface
- •Section 34.8: Accessing class members
- •Section 34.9: Member Types and Aliases
- •Section 34.10: Nested Classes/Structures
- •Section 34.11: Unnamed struct/class
- •Section 34.12: Static class members
- •Section 34.13: Multiple Inheritance
- •Section 34.14: Non-static member functions
- •Chapter 35: Function Overloading
- •Section 35.1: What is Function Overloading?
- •Section 35.2: Return Type in Function Overloading
- •Section 35.3: Member Function cv-qualifier Overloading
- •Chapter 36: Operator Overloading
- •Section 36.1: Arithmetic operators
- •Section 36.2: Array subscript operator
- •Section 36.3: Conversion operators
- •Section 36.4: Complex Numbers Revisited
- •Section 36.5: Named operators
- •Section 36.6: Unary operators
- •Section 36.7: Comparison operators
- •Section 36.8: Assignment operator
- •Section 36.9: Function call operator
- •Section 36.10: Bitwise NOT operator
- •Section 36.11: Bit shift operators for I/O
- •Chapter 37: Function Template Overloading
- •Section 37.1: What is a valid function template overloading?
- •Chapter 38: Virtual Member Functions
- •Section 38.1: Final virtual functions
- •Section 38.2: Using override with virtual in C++11 and later
- •Section 38.3: Virtual vs non-virtual member functions
- •Section 38.4: Behaviour of virtual functions in constructors and destructors
- •Section 38.5: Pure virtual functions
- •Chapter 39: Inline functions
- •Section 39.1: Non-member inline function definition
- •Section 39.2: Member inline functions
- •Section 39.3: What is function inlining?
- •Section 39.4: Non-member inline function declaration
- •Chapter 40: Special Member Functions
- •Section 40.1: Default Constructor
- •Section 40.2: Destructor
- •Section 40.3: Copy and swap
- •Section 40.4: Implicit Move and Copy
- •Chapter 41: Non-Static Member Functions
- •Section 41.1: Non-static Member Functions
- •Section 41.2: Encapsulation
- •Section 41.3: Name Hiding & Importing
- •Section 41.4: Virtual Member Functions
- •Section 41.5: Const Correctness
- •Chapter 42: Constant class member functions
- •Section 42.1: constant member function
- •Chapter 43: C++ Containers
- •Section 43.1: C++ Containers Flowchart
- •Chapter 44: Namespaces
- •Section 44.1: What are namespaces?
- •Section 44.2: Argument Dependent Lookup
- •Section 44.3: Extending namespaces
- •Section 44.4: Using directive
- •Section 44.5: Making namespaces
- •Section 44.6: Unnamed/anonymous namespaces
- •Section 44.7: Compact nested namespaces
- •Section 44.8: Namespace alias
- •Section 44.9: Inline namespace
- •Section 44.10: Aliasing a long namespace
- •Section 44.11: Alias Declaration scope
- •Chapter 45: Header Files
- •Section 45.1: Basic Example
- •Section 45.2: Templates in Header Files
- •Chapter 46: Using declaration
- •Section 46.1: Importing names individually from a namespace
- •Section 46.2: Redeclaring members from a base class to avoid name hiding
- •Section 46.3: Inheriting constructors
- •Chapter 47: std::string
- •Section 47.1: Tokenize
- •Section 47.2: Conversion to (const) char*
- •Section 47.3: Using the std::string_view class
- •Section 47.4: Conversion to std::wstring
- •Section 47.5: Lexicographical comparison
- •Section 47.6: Trimming characters at start/end
- •Section 47.7: String replacement
- •Section 47.8: Converting to std::string
- •Section 47.9: Splitting
- •Section 47.10: Accessing a character
- •Section 47.11: Checking if a string is a prefix of another
- •Section 47.12: Looping through each character
- •Section 47.13: Conversion to integers/floating point types
- •Section 47.14: Concatenation
- •Section 47.15: Converting between character encodings
- •Section 47.16: Finding character(s) in a string
- •Chapter 48: std::array
- •Section 48.1: Initializing an std::array
- •Section 48.2: Element access
- •Section 48.3: Iterating through the Array
- •Section 48.4: Checking size of the Array
- •Section 48.5: Changing all array elements at once
- •Chapter 49: std::vector
- •Section 49.1: Accessing Elements
- •Section 49.2: Initializing a std::vector
- •Section 49.3: Deleting Elements
- •Section 49.4: Iterating Over std::vector
- •Section 49.5: vector<bool>: The Exception To So Many, So Many Rules
- •Section 49.6: Inserting Elements
- •Section 49.7: Using std::vector as a C array
- •Section 49.8: Finding an Element in std::vector
- •Section 49.9: Concatenating Vectors
- •Section 49.10: Matrices Using Vectors
- •Section 49.11: Using a Sorted Vector for Fast Element Lookup
- •Section 49.12: Reducing the Capacity of a Vector
- •Section 49.13: Vector size and capacity
- •Section 49.14: Iterator/Pointer Invalidation
- •Section 49.15: Find max and min Element and Respective Index in a Vector
- •Section 49.16: Converting an array to std::vector
- •Section 49.17: Functions Returning Large Vectors
- •Chapter 50: std::map
- •Section 50.1: Accessing elements
- •Section 50.2: Inserting elements
- •Section 50.3: Searching in std::map or in std::multimap
- •Section 50.4: Initializing a std::map or std::multimap
- •Section 50.5: Checking number of elements
- •Section 50.6: Types of Maps
- •Section 50.7: Deleting elements
- •Section 50.8: Iterating over std::map or std::multimap
- •Section 50.9: Creating std::map with user-defined types as key
- •Chapter 51: std::optional
- •Section 51.1: Using optionals to represent the absence of a value
- •Section 51.2: optional as return value
- •Section 51.3: value_or
- •Section 51.4: Introduction
- •Section 51.5: Using optionals to represent the failure of a function
- •Chapter 52: std::function: To wrap any element that is callable
- •Section 52.1: Simple usage
- •Section 52.2: std::function used with std::bind
- •Section 52.4: Storing function arguments in std::tuple
- •Section 52.5: std::function with lambda and std::bind
- •Section 52.6: `function` overhead
- •Chapter 53: std::forward_list
- •Section 53.1: Example
- •Section 53.2: Methods
- •Chapter 54: std::pair
- •Section 54.1: Compare operators
- •Section 54.2: Creating a Pair and accessing the elements
- •Chapter 55: std::atomics
- •Section 55.1: atomic types
- •Chapter 56: std::variant
- •Section 56.1: Create pseudo-method pointers
- •Section 56.2: Basic std::variant use
- •Section 56.3: Constructing a `std::variant`
- •Chapter 57: std::iomanip
- •Section 57.1: std::setprecision
- •Section 57.2: std::setfill
- •Section 57.3: std::setiosflags
- •Section 57.4: std::setw
- •Chapter 58: std::any
- •Section 58.1: Basic usage
- •Chapter 59: std::set and std::multiset
- •Section 59.1: Changing the default sort of a set
- •Section 59.2: Deleting values from a set
- •Section 59.3: Inserting values in a set
- •Section 59.4: Inserting values in a multiset
- •Section 59.5: Searching values in set and multiset
- •Chapter 60: std::integer_sequence
- •Section 60.1: Turn a std::tuple<T...> into function parameters
- •Section 60.2: Create a parameter pack consisting of integers
- •Section 60.3: Turn a sequence of indices into copies of an element
- •Chapter 61: Using std::unordered_map
- •Section 61.1: Declaration and Usage
- •Section 61.2: Some Basic Functions
- •Chapter 62: Standard Library Algorithms
- •Section 62.1: std::next_permutation
- •Section 62.2: std::for_each
- •Section 62.3: std::accumulate
- •Section 62.4: std::find
- •Section 62.5: std::min_element
- •Section 62.6: std::find_if
- •Section 62.7: Using std::nth_element To Find The Median (Or Other Quantiles)
- •Section 62.8: std::count
- •Section 62.9: std::count_if
- •Chapter 63: The ISO C++ Standard
- •Section 63.1: Current Working Drafts
- •Section 63.2: C++17
- •Section 63.3: C++11
- •Section 63.4: C++14
- •Section 63.5: C++98
- •Section 63.6: C++03
- •Section 63.7: C++20
- •Chapter 64: Inline variables
- •Section 64.1: Defining a static data member in the class definition
- •Chapter 65: Random number generation
- •Section 65.1: True random value generator
- •Section 65.2: Generating a pseudo-random number
- •Section 65.3: Using the generator for multiple distributions
- •Chapter 66: Date and time using <chrono> header
- •Section 66.1: Measuring time using <chrono>
- •Section 66.2: Find number of days between two dates
- •Chapter 67: Sorting
- •Section 67.1: Sorting and sequence containers
- •Section 67.2: sorting with std::map (ascending and descending)
- •Section 67.3: Sorting sequence containers by overloaded less operator
- •Section 67.4: Sorting sequence containers using compare function
- •Section 67.5: Sorting sequence containers using lambda expressions (C++11)
- •Section 67.6: Sorting built-in arrays
- •Section 67.7: Sorting sequence containers with specifed ordering
- •Chapter 68: Enumeration
- •Section 68.1: Iteration over an enum
- •Section 68.2: Scoped enums
- •Section 68.3: Enum forward declaration in C++11
- •Section 68.4: Basic Enumeration Declaration
- •Section 68.5: Enumeration in switch statements
- •Chapter 69: Iteration
- •Section 69.1: break
- •Section 69.2: continue
- •Section 69.3: do
- •Section 69.4: while
- •Section 69.5: range-based for loop
- •Section 69.6: for
- •Chapter 70: Regular expressions
- •Section 70.1: Basic regex_match and regex_search Examples
- •Section 70.2: regex_iterator Example
- •Section 70.3: Anchors
- •Section 70.4: regex_replace Example
- •Section 70.5: regex_token_iterator Example
- •Section 70.6: Quantifiers
- •Section 70.7: Splitting a string
- •Chapter 71: Implementation-defined behavior
- •Section 71.1: Size of integral types
- •Section 71.2: Char might be unsigned or signed
- •Section 71.3: Ranges of numeric types
- •Section 71.4: Value representation of floating point types
- •Section 71.5: Overflow when converting from integer to signed integer
- •Section 71.6: Underlying type (and hence size) of an enum
- •Section 71.7: Numeric value of a pointer
- •Section 71.8: Number of bits in a byte
- •Chapter 72: Exceptions
- •Section 72.1: Catching exceptions
- •Section 72.2: Rethrow (propagate) exception
- •Section 72.3: Best practice: throw by value, catch by const reference
- •Section 72.4: Custom exception
- •Section 72.5: std::uncaught_exceptions
- •Section 72.6: Function Try Block for regular function
- •Section 72.7: Nested exception
- •Section 72.8: Function Try Blocks In constructor
- •Section 72.9: Function Try Blocks In destructor
- •Chapter 73: Lambdas
- •Section 73.1: What is a lambda expression?
- •Section 73.2: Specifying the return type
- •Section 73.3: Capture by value
- •Section 73.4: Recursive lambdas
- •Section 73.5: Default capture
- •Section 73.6: Class lambdas and capture of this
- •Section 73.7: Capture by reference
- •Section 73.8: Generic lambdas
- •Section 73.9: Using lambdas for inline parameter pack unpacking
- •Section 73.10: Generalized capture
- •Section 73.11: Conversion to function pointer
- •Section 73.12: Porting lambda functions to C++03 using functors
- •Chapter 74: Value Categories
- •Section 74.1: Value Category Meanings
- •Section 74.2: rvalue
- •Section 74.3: xvalue
- •Section 74.4: prvalue
- •Section 74.5: lvalue
- •Section 74.6: glvalue
- •Chapter 75: Preprocessor
- •Section 75.1: Include Guards
- •Section 75.2: Conditional logic and cross-platform handling
- •Section 75.3: X-macros
- •Section 75.4: Macros
- •Section 75.5: Predefined macros
- •Section 75.6: Preprocessor Operators
- •Section 75.7: #pragma once
- •Section 75.8: Preprocessor error messages
- •Chapter 76: Data Structures in C++
- •Section 76.1: Linked List implementation in C++
- •Chapter 77: Templates
- •Section 77.1: Basic Class Template
- •Section 77.2: Function Templates
- •Section 77.3: Variadic template data structures
- •Section 77.4: Argument forwarding
- •Section 77.5: Partial template specialization
- •Section 77.6: Template Specialization
- •Section 77.7: Alias template
- •Section 77.8: Explicit instantiation
- •Section 77.9: Non-type template parameter
- •Section 77.10: Declaring non-type template arguments with auto
- •Section 77.11: Template template parameters
- •Section 77.12: Default template parameter value
- •Chapter 78: Expression templates
- •Section 78.1: A basic example illustrating expression templates
- •Section 79.1: The Curiously Recurring Template Pattern (CRTP)
- •Section 79.2: CRTP to avoid code duplication
- •Chapter 80: Threading
- •Section 80.1: Creating a std::thread
- •Section 80.2: Passing a reference to a thread
- •Section 80.3: Using std::async instead of std::thread
- •Section 80.4: Basic Synchronization
- •Section 80.5: Create a simple thread pool
- •Section 80.6: Ensuring a thread is always joined
- •Section 80.7: Operations on the current thread
- •Section 80.8: Using Condition Variables
- •Section 80.9: Thread operations
- •Section 80.10: Thread-local storage
- •Section 80.11: Reassigning thread objects
- •Chapter 81: Thread synchronization structures
- •Section 81.1: std::condition_variable_any, std::cv_status
- •Section 81.2: std::shared_lock
- •Section 81.3: std::call_once, std::once_flag
- •Section 82.1: Rule of Zero
- •Section 82.2: Rule of Five
- •Section 82.3: Rule of Three
- •Section 82.4: Self-assignment Protection
- •Section 83.1: Locking
- •Section 83.2: ScopeSuccess (c++17)
- •Section 83.3: ScopeFail (c++17)
- •Section 83.4: Finally/ScopeExit
- •Chapter 84: RTTI: Run-Time Type Information
- •Section 84.1: dynamic_cast
- •Section 84.2: The typeid keyword
- •Section 84.3: Name of a type
- •Section 84.4: When to use which cast in c++
- •Chapter 85: Mutexes
- •Section 85.1: Mutex Types
- •Section 85.2: std::lock
- •Section 85.3: std::unique_lock, std::shared_lock, std::lock_guard
- •Section 85.4: Strategies for lock classes: std::try_to_lock, std::adopt_lock, std::defer_lock
- •Section 85.5: std::mutex
- •Section 85.6: std::scoped_lock (C++ 17)
- •Chapter 86: Recursive Mutex
- •Section 86.1: std::recursive_mutex
- •Chapter 87: Semaphore
- •Section 87.1: Semaphore C++ 11
- •Section 87.2: Semaphore class in action
- •Chapter 88: Futures and Promises
- •Section 88.1: Async operation classes
- •Section 88.2: std::future and std::promise
- •Section 88.3: Deferred async example
- •Section 88.4: std::packaged_task and std::future
- •Section 88.5: std::future_error and std::future_errc
- •Section 88.6: std::future and std::async
- •Chapter 89: Atomic Types
- •Section 89.1: Multi-threaded Access
- •Chapter 90: Type Erasure
- •Section 90.1: A move-only `std::function`
- •Section 90.2: Erasing down to a Regular type with manual vtable
- •Section 90.3: Basic mechanism
- •Section 90.5: Type erasing type erasure with std::any
- •Chapter 91: Explicit type conversions
- •Section 91.1: C-style casting
- •Section 91.2: Casting away constness
- •Section 91.3: Base to derived conversion
- •Section 91.4: Conversion between pointer and integer
- •Section 91.5: Conversion by explicit constructor or explicit conversion function
- •Section 91.6: Implicit conversion
- •Section 91.7: Enum conversions
- •Section 91.8: Derived to base conversion for pointers to members
- •Section 91.9: void* to T*
- •Section 91.10: Type punning conversion
- •Chapter 92: Unnamed types
- •Section 92.1: Unnamed classes
- •Section 92.2: As a type alias
- •Section 92.3: Anonymous members
- •Section 92.4: Anonymous Union
- •Chapter 93: Type Traits
- •Section 93.1: Type Properties
- •Section 93.2: Standard type traits
- •Section 93.3: Type relations with std::is_same<T, T>
- •Section 93.4: Fundamental type traits
- •Chapter 94: Return Type Covariance
- •Section 94.1: Covariant result version of the base example, static type checking
- •Section 94.2: Covariant smart pointer result (automated cleanup)
- •Chapter 95: Layout of object types
- •Section 95.1: Class types
- •Section 95.2: Arithmetic types
- •Section 95.3: Arrays
- •Chapter 96: Type Inference
- •Section 96.1: Data Type: Auto
- •Section 96.2: Lambda auto
- •Section 96.3: Loops and auto
- •Chapter 97: Typedef and type aliases
- •Section 97.1: Basic typedef syntax
- •Section 97.2: More complex uses of typedef
- •Section 97.3: Declaring multiple types with typedef
- •Section 97.4: Alias declaration with "using"
- •Chapter 98: type deduction
- •Section 98.1: Template parameter deduction for constructors
- •Section 98.2: Auto Type Deduction
- •Section 98.3: Template Type Deduction
- •Chapter 99: Trailing return type
- •Section 99.1: Avoid qualifying a nested type name
- •Section 99.2: Lambda expressions
- •Chapter 100: Alignment
- •Section 100.1: Controlling alignment
- •Section 100.2: Querying the alignment of a type
- •Chapter 101: Perfect Forwarding
- •Section 101.1: Factory functions
- •Chapter 102: decltype
- •Section 102.1: Basic Example
- •Section 102.2: Another example
- •Chapter 103: SFINAE (Substitution Failure Is Not An Error)
- •Section 103.1: What is SFINAE
- •Section 103.2: void_t
- •Section 103.3: enable_if
- •Section 103.4: is_detected
- •Section 103.5: Overload resolution with a large number of options
- •Section 103.6: trailing decltype in function templates
- •Section 103.7: enable_if_all / enable_if_any
- •Chapter 104: Undefined Behavior
- •Section 104.1: Reading or writing through a null pointer
- •Section 104.2: Using an uninitialized local variable
- •Section 104.3: Accessing an out-of-bounds index
- •Section 104.4: Deleting a derived object via a pointer to a base class that doesn't have a virtual destructor
- •Section 104.5: Extending the `std` or `posix` Namespace
- •Section 104.6: Invalid pointer arithmetic
- •Section 104.8: Accessing a dangling reference
- •Section 104.9: Integer division by zero
- •Section 104.10: Shifting by an invalid number of positions
- •Section 104.11: Incorrect pairing of memory allocation and deallocation
- •Section 104.12: Signed Integer Overflow
- •Section 104.13: Multiple non-identical definitions (the One Definition Rule)
- •Section 104.14: Modifying a const object
- •Section 104.15: Returning from a [[noreturn]] function
- •Section 104.16: Infinite template recursion
- •Section 104.17: Overflow during conversion to or from floating point type
- •Section 104.18: Modifying a string literal
- •Section 104.19: Accessing an object as the wrong type
- •Section 104.20: Invalid derived-to-base conversion for pointers to members
- •Section 104.21: Destroying an object that has already been destroyed
- •Section 104.22: Access to nonexistent member through pointer to member
- •Section 104.23: Invalid base-to-derived static cast
- •Section 104.24: Floating point overflow
- •Section 104.26: Function call through mismatched function pointer type
- •Chapter 105: Overload resolution
- •Section 105.1: Categorization of argument to parameter cost
- •Section 105.2: Arithmetic promotions and conversions
- •Section 105.3: Overloading on Forwarding Reference
- •Section 105.4: Exact match
- •Section 105.5: Overloading on constness and volatility
- •Section 105.6: Name lookup and access checking
- •Section 105.7: Overloading within a class hierarchy
- •Section 105.8: Steps of Overload Resolution
- •Chapter 106: Move Semantics
- •Section 106.1: Move semantics
- •Section 106.2: Using std::move to reduce complexity from O(n²) to O(n)
- •Section 106.3: Move constructor
- •Section 106.4: Re-use a moved object
- •Section 106.5: Move assignment
- •Section 106.6: Using move semantics on containers
- •Chapter 107: Pimpl Idiom
- •Section 107.1: Basic Pimpl idiom
- •Chapter 108: auto
- •Section 108.1: Basic auto sample
- •Section 108.2: Generic lambda (C++14)
- •Section 108.3: auto and proxy objects
- •Section 108.4: auto and Expression Templates
- •Section 108.5: auto, const, and references
- •Section 108.6: Trailing return type
- •Chapter 109: Copy Elision
- •Section 109.1: Purpose of copy elision
- •Section 109.2: Guaranteed copy elision
- •Section 109.3: Parameter elision
- •Section 109.4: Return value elision
- •Section 109.5: Named return value elision
- •Section 109.6: Copy initialization elision
- •Chapter 110: Fold Expressions
- •Section 110.1: Unary Folds
- •Section 110.2: Binary Folds
- •Section 110.3: Folding over a comma
- •Chapter 111: Unions
- •Section 111.1: Undefined Behavior
- •Section 111.2: Basic Union Features
- •Section 111.3: Typical Use
- •Chapter 112: Design pattern implementation in C++
- •Section 112.1: Adapter Pattern
- •Section 112.2: Observer pattern
- •Section 112.3: Factory Pattern
- •Section 112.4: Builder Pattern with Fluent API
- •Chapter 113: Singleton Design Pattern
- •Section 113.1: Lazy Initialization
- •Section 113.2: Static deinitialization-safe singleton
- •Section 113.3: Thread-safe Singeton
- •Section 113.4: Subclasses
- •Chapter 114: User-Defined Literals
- •Section 114.1: Self-made user-defined literal for binary
- •Section 114.2: Standard user-defined literals for duration
- •Section 114.3: User-defined literals with long double values
- •Section 114.4: Standard user-defined literals for strings
- •Section 114.5: Standard user-defined literals for complex
- •Chapter 115: Memory management
- •Section 115.1: Free Storage (Heap, Dynamic Allocation ...)
- •Section 115.2: Placement new
- •Section 115.3: Stack
- •Chapter 116: C++11 Memory Model
- •Section 116.1: Need for Memory Model
- •Section 116.2: Fence example
- •Chapter 117: Scopes
- •Section 117.1: Global variables
- •Section 117.2: Simple block scope
- •Chapter 118: static_assert
- •Section 118.1: static_assert
- •Chapter 119: constexpr
- •Section 119.1: constexpr variables
- •Section 119.2: Static if statement
- •Section 119.3: constexpr functions
- •Chapter 120: One Definition Rule (ODR)
- •Section 120.1: ODR violation via overload resolution
- •Section 120.2: Multiply defined function
- •Section 120.3: Inline functions
- •Chapter 121: Unspecified behavior
- •Section 121.1: Value of an out-of-range enum
- •Section 121.2: Evaluation order of function arguments
- •Section 121.3: Result of some reinterpret_cast conversions
- •Section 121.4: Space occupied by a reference
- •Section 121.5: Moved-from state of most standard library classes
- •Section 121.6: Result of some pointer comparisons
- •Section 121.7: Static cast from bogus void* value
- •Section 121.8: Order of initialization of globals across TU
- •Chapter 122: Argument Dependent Name Lookup
- •Section 122.1: What functions are found
- •Chapter 123: Attributes
- •Section 123.1: [[fallthrough]]
- •Section 123.2: [[nodiscard]]
- •Section 123.3: [[deprecated]] and [[deprecated("reason")]]
- •Section 123.4: [[maybe_unused]]
- •Section 123.5: [[noreturn]]
- •Chapter 124: Recursion in C++
- •Section 124.1: Using tail recursion and Fibonnaci-style recursion to solve the Fibonnaci sequence
- •Section 124.2: Recursion with memoization
- •Chapter 125: Arithmitic Metaprogramming
- •Section 125.1: Calculating power in O(log n)
- •Chapter 126: Callable Objects
- •Section 126.1: Function Pointers
- •Section 126.2: Classes with operator() (Functors)
- •Chapter 127: Client server examples
- •Section 127.1: Hello TCP Client
- •Section 127.2: Hello TCP Server
- •Chapter 128: Const Correctness
- •Section 128.1: The Basics
- •Section 128.2: Const Correct Class Design
- •Section 128.3: Const Correct Function Parameters
- •Section 128.4: Const Correctness as Documentation
- •Chapter 129: Parameter packs
- •Section 129.1: A template with a parameter pack
- •Section 129.2: Expansion of a parameter pack
- •Chapter 130: Build Systems
- •Section 130.1: Generating Build Environment with CMake
- •Section 130.2: Compiling with GNU make
- •Section 130.3: Building with SCons
- •Section 130.4: Autotools (GNU)
- •Section 130.5: Ninja
- •Section 130.6: NMAKE (Microsoft Program Maintenance Utility)
- •Chapter 131: Concurrency With OpenMP
- •Section 131.1: OpenMP: Parallel Sections
- •Section 131.2: OpenMP: Parallel Sections
- •Section 131.3: OpenMP: Parallel For Loop
- •Section 131.4: OpenMP: Parallel Gathering / Reduction
- •Chapter 132: Resource Management
- •Section 132.1: Resource Acquisition Is Initialization
- •Section 132.2: Mutexes & Thread Safety
- •Chapter 133: Storage class specifiers
- •Section 133.1: extern
- •Section 133.2: register
- •Section 133.3: static
- •Section 133.4: auto
- •Section 133.5: mutable
- •Chapter 134: Linkage specifications
- •Section 134.1: Signal handler for Unix-like operating system
- •Section 134.2: Making a C library header compatible with C++
- •Chapter 135: Digit separators
- •Section 135.1: Digit Separator
- •Chapter 136: C incompatibilities
- •Section 136.1: Reserved Keywords
- •Section 136.2: Weakly typed pointers
- •Section 136.3: goto or switch
- •Chapter 137: Side by Side Comparisons of classic C++ examples solved via C++ vs C++11 vs C++14 vs C++17
- •Section 137.1: Looping through a container
- •Chapter 138: Compiling and Building
- •Section 138.1: Compiling with GCC
- •Section 138.2: Compiling with Visual Studio (Graphical Interface) - Hello World
- •Section 138.3: Online Compilers
- •Section 138.4: Compiling with Visual C++ (Command Line)
- •Section 138.5: Compiling with Clang
- •Section 138.6: The C++ compilation process
- •Section 138.7: Compiling with Code::Blocks (Graphical interface)
- •Chapter 139: Common compile/linker errors (GCC)
- •Section 139.1: undefined reference to `***'
- •Section 139.2: error: '***' was not declared in this scope
- •Section 139.3: fatal error: ***: No such file or directory
- •Chapter 140: More undefined behaviors in C++
- •Section 140.1: Referring to non-static members in initializer lists
- •Chapter 141: Unit Testing in C++
- •Section 141.1: Google Test
- •Section 141.2: Catch
- •Section 142.1: Static analysis
- •Section 142.2: Segfault analysis with GDB
- •Section 142.3: Clean code
- •Chapter 143: Optimization in C++
- •Section 143.1: Introduction to performance
- •Section 143.2: Empty Base Class Optimization
- •Section 143.3: Optimizing by executing less code
- •Section 143.5: Small Object Optimization
- •Chapter 144: Optimization
- •Section 144.1: Inline Expansion/Inlining
- •Section 144.2: Empty base optimization
- •Chapter 145: Profiling
- •Section 145.1: Profiling with gcc and gprof
- •Section 145.2: Generating callgraph diagrams with gperf2dot
- •Section 145.3: Profiling CPU Usage with gcc and Google Perf Tools
- •Chapter 146: Refactoring Techniques
- •Section 146.1: Goto Cleanup
- •Credits
- •You may also like

Chapter 145: Profiling
Section 145.1: Profiling with gcc and gprof
The GNU gprof profiler, gprof, allows you to profile your code. To use it, you need to perform the following steps:
1.Build the application with settings for generating profiling information
2.Generate profiling information by running the built application
3.View the generated profiling information with gprof
In order to build the application with settings for generating profiling information, we add the -pg flag. So, for example, we could use
$ gcc -pg *.cpp -o app
or
$ gcc -O2 -pg *.cpp -o app
and so forth.
Once the application, say app, is built, execute it as usual:
$ ./app
This should produce a file called gmon.out.
To see the profiling results, now run
$ gprof app gmon.out
(note that we provide both the application as well as the generated output).
Of course, you can also pipe or redirect:
$ gprof app gmon.out | less
and so forth.
The result of the last command should be a table, whose rows are the functions, and whose columns indicate the number of calls, total time spent, self time spent (that is, time spent in the function excluding calls to children).
Section 145.2: Generating callgraph diagrams with gperf2dot
For more complex applications, flat execution profiles may be di cult to follow. This is why many profiling tools also generate some form of annotated callgraph information.
gperf2dot converts text output from many profilers (Linux perf, callgrind, oprofile etc.) into a callgraph diagram. You can use it by running your profiler (example for gprof):
# compile with profiling flags g++ *.cpp -pg
GoalKicker.com – C++ Notes for Professionals |
678 |
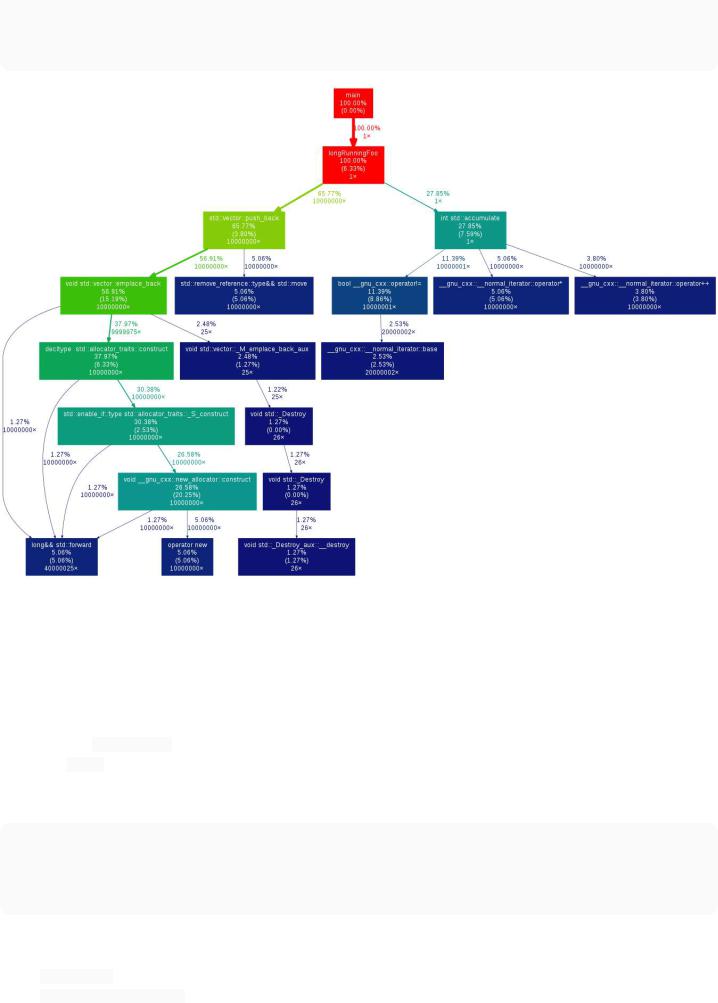
#run to generate profiling data
./main
#translate profiling data to text, create image gprof ./main | gprof2dot -s | dot -Tpng -o output.png
Section 145.3: Profiling CPU Usage with gcc and Google Perf Tools
Google Perf Tools also provides a CPU profiler, with a slightly friendlier interface. To use it:
1.Install Google Perf Tools
2.Compile your code as usual
3.Add the libprofiler profiler library to your library load path at runtime
4.Use pprof to generate a flat execution profile, or a callgraph diagram
For example:
# compile code
g++ -O3 -std=c++11 main.cpp -o main
# run with profiler
LD_PRELOAD=/usr/local/lib/libprofiler.so CPUPROFILE=main.prof CPUPROFILE_FREQUENCY=100000 ./main
where:
 CPUPROFILE indicates the output file for profiling data
 CPUPROFILE_FREQUENCY indicates the profiler sampling frequency;
GoalKicker.com – C++ Notes for Professionals |
679 |

Use pprof to post-process the profiling data.
You can generate a flat call profile as text:
$ pprof --text ./main main.prof
PROFILE: interrupts/evictions/bytes = 67/15/2016 pprof --text --lines ./main main.prof
Using local file ./main. |
|
|
|||
Using local file main.prof. |
|
||||
Total: 67 |
samples |
|
|
|
|
22 |
32.8% |
32.8% |
67 100.0% longRunningFoo ??:0 |
||
20 |
29.9% |
62.7% |
20 |
29.9% __memmove_ssse3_back |
|
/build/eglibc-3GlaMS/eglibc-2.19/string/../sysdeps/x86_64/multiarch/memcpy-ssse3-back.S:1627 |
|||||
4 |
6.0% |
68.7% |
4 |
6.0% |
__memmove_ssse3_back |
/build/eglibc-3GlaMS/eglibc-2.19/string/../sysdeps/x86_64/multiarch/memcpy-ssse3-back.S:1619 |
|||||
3 |
4.5% |
73.1% |
3 |
4.5% |
__random_r /build/eglibc-3GlaMS/eglibc-2.19/stdlib/random_r.c:388 |
3 |
4.5% |
77.6% |
3 |
4.5% |
__random_r /build/eglibc-3GlaMS/eglibc-2.19/stdlib/random_r.c:401 |
2 |
3.0% |
80.6% |
2 |
3.0% |
__munmap |
/build/eglibc-3GlaMS/eglibc-2.19/misc/../sysdeps/unix/syscall-template.S:81 |
|||||
2 |
3.0% |
83.6% |
12 |
17.9% |
__random /build/eglibc-3GlaMS/eglibc-2.19/stdlib/random.c:298 |
2 |
3.0% |
86.6% |
2 |
3.0% |
__random_r /build/eglibc-3GlaMS/eglibc-2.19/stdlib/random_r.c:385 |
2 |
3.0% |
89.6% |
2 |
3.0% |
rand /build/eglibc-3GlaMS/eglibc-2.19/stdlib/rand.c:26 |
1 |
1.5% |
91.0% |
1 |
1.5% |
__memmove_ssse3_back |
/build/eglibc-3GlaMS/eglibc-2.19/string/../sysdeps/x86_64/multiarch/memcpy-ssse3-back.S:1617 |
|||||
1 |
1.5% |
92.5% |
1 |
1.5% |
__memmove_ssse3_back |
/build/eglibc-3GlaMS/eglibc-2.19/string/../sysdeps/x86_64/multiarch/memcpy-ssse3-back.S:1623 |
|||||
1 |
1.5% |
94.0% |
1 |
1.5% |
__random /build/eglibc-3GlaMS/eglibc-2.19/stdlib/random.c:293 |
1 |
1.5% |
95.5% |
1 |
1.5% |
__random /build/eglibc-3GlaMS/eglibc-2.19/stdlib/random.c:296 |
1 |
1.5% |
97.0% |
1 |
1.5% |
__random_r /build/eglibc-3GlaMS/eglibc-2.19/stdlib/random_r.c:371 |
1 |
1.5% |
98.5% |
1 |
1.5% |
__random_r /build/eglibc-3GlaMS/eglibc-2.19/stdlib/random_r.c:381 |
1 |
1.5% |
100.0% |
1 |
1.5% |
rand /build/eglibc-3GlaMS/eglibc-2.19/stdlib/rand.c:28 |
00.0% 100.0% 67 100.0% __libc_start_main /build/eglibc-3GlaMS/eglibc-2.19/csu/libc- start.c:287
00.0% 100.0% 67 100.0% _start ??:0
00.0% 100.0% 67 100.0% main ??:0
0 |
0.0% 100.0% |
14 20.9% rand /build/eglibc-3GlaMS/eglibc-2.19/stdlib/rand.c:27 |
00.0% 100.0% 27 40.3% std::vector::_M_emplace_back_aux ??:0
... or you can generate an annotated callgraph in a pdf with:
pprof --pdf ./main main.prof > out.pdf
GoalKicker.com – C++ Notes for Professionals |
680 |