

4.5 · X-Ray Fluorescence
. Table 4.3 Self-absorption of carbon K-shell X-rays as a
function of beam energy
E0 |
f(χ) |
2 keV |
0.974 |
|
|
5 |
0.867 |
10 |
0.615 |
20 |
0.237 |
30 |
0.103 |
s = d cscψ \ |
(4.15) |
Normalizing by the intensity generated in each layer, the
ϕ(ρz) histogram gives the probability, with a value between 0 and 1, that a photon generated in that layer and emitted into the solid angle of the EDS detector will escape and reach the detector, as shown in . Fig. 4.16b for each histogram bin of the silicon ϕ(ρz) distribution. The escape probability of X-rays integrated over the complete ϕ(ρz) histogram gives the parameter designated “f(χ),” which is the overall escape probability, between 0 and 1, for an X-ray generated anywhere in the ϕ(ρz) distribution.
. Figure 4.21b shows a sequence of calculations of the C K ϕ(ρz) distribution and subsequent absorption as a function of incident beam energy. As the incident beam energy increases, the depth of electron penetration increases so that carbon characteristic X-rays are produced deeper in the target. For pure carbon with E0 = 5 keV, the cumulative value of f(χ) = 0.867; that is, 86.7 % of all carbon X-rays that are generated escape, while 13.3 % are absorbed. As the C X-rays are produced deeper with increasing beam energy, the total X-ray absorption increases so that the value of f(χ) for C K decreases sharply with increasing beam energy, as shown in
. Fig. 4.21b and in . Table 4.3.
Thus, with E0 = 2 keV, 97.4 % of the carbon X-rays escape the specimen, while at E0 = 30 keV, nearly 90 % of the carbon X-rays generated in pure carbon are absorbed before they can exit the specimen.
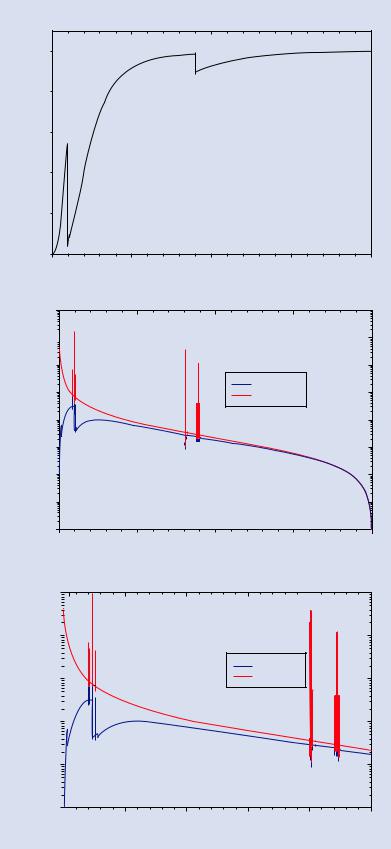
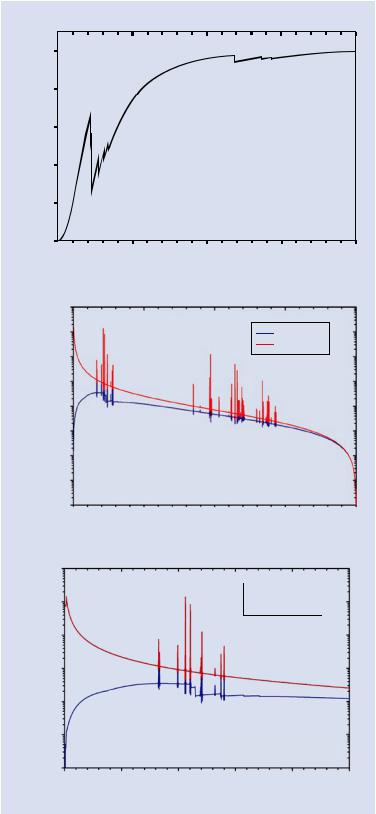
When the parameter f(χ) is plotted at every photon energy from the threshold of 100 eV up to the Duane–Hunt limit of the incident beam energy E0, X-ray absorption is seen to sharply modify the X-ray spectrum that is emitted from the target, as illustrated for carbon (. Fig. 4.22), copper (. Fig. 4.23), and gold (. Fig. 4.24). The high relative intensity of the X-ray continuum at low photon energies compared to higher photon energies in the generated spectrum is greatly diminished in the emitted spectrum because of the higher absorption suffered by low energy photons. Discontinuities
59 |
|
4 |
|
|
|
in f(χ) are seen at the critical ionization energy of the K-shell in carbon, the K- and L-shells in copper, and the M- and L-shells in gold, corresponding to the sharp increase in μ/ρ just above the critical ionization energy. Because the X-ray continuum is generated at all photon energies, the continuum is affected by every ionization edge represented by the atomic species present, resulting in abrupt steps in the background. An abrupt decrease in X-ray continuum intensity is observed just above the absorption edge energy due to the increase in the mass absorption coefficient. The characteristic peaks in these spectra are also diminished by absorption, but because a characteristic X-ray is always lower in energy than the ionization edge energy from which it originated, the mass absorption coefficient for characteristic X-rays is lower than that for photons with energies just above the shell ionization energies. Thus an element is relatively transparent to its own characteristic X-rays because of the decrease in X-ray absorption below the ionization edge energy.
4.5\ X-Ray Fluorescence
As a consequence of photoelectric absorption shown in
. Fig. 4.17, the atom will subsequently undergo de-excitation following the same paths as is the case for electron ionization in . Fig. 4.1. Thus, the primary X-ray spectrum of characteristic and continuum X-rays generated by the beam electron inelastic scattering events gives rise to a secondary X-ray spectrum of characteristic X-rays generated as a result of target atoms absorbing those characteristic and continuum X-rays and emitting lower energy characteristic X-rays. Because continuum X-rays are produced up to E0, the Duane–Hunt limit, all atomic shells present with Ec < E0 will be involved in generating secondary X-rays, which is referred to as “secondary X-ray fluorescence” by the X-ray microanalysis community. Generally, at any characteristic photon energy the contribution of secondary fluorescence is only a few percent or less of the intensity produced by the direct electron ionization events. However, there is a substantial difference in the spatial distribution of the primary and secondary X-rays. The primary X-rays must be produced within the interaction volume of the beam electrons, which generally has limiting dimensions of a few micrometers at most. The secondary X-rays can be produced over a much larger volume because the range of X-rays in a material is typically an order-of-magnitude (or more) greater than the range of an electron beam with E0 from 5 to 30 keV. This effect is shown in . Fig. 4.25 for an alloy of Ni-10 % Fe for the secondary fluorescence of Fe K-shell X-rays (EK = 7.07 keV) by the electron-excited Ni K-L2,3 X-rays (7.47 keV). The hemispherical volume that contains 99 % of the secondary Fe K-L2,3 X-rays has a radius of 30 μm.

4
60\ Chapter 4 · X-Rays
. Fig. 4.22 a Absorption parameter f(χ) as a function of photon energy for carbon and an incident beam energy of E0 = 20 keV. Note the abrupt decrease for photons
just above the ionization energy of carbon at 0.284 keV.
b Expansion of the region from 0 to 5 keV. Note the abrupt decrease for photons just above the ionization energy
of carbon at 0.284 keV. c Comparison of the generated (black) and emitted (red) X-ray spectra for carbon with an incident beam energy of E0 = 20 keV
a
|
1.0 |
|
0.8 |
) |
0.6 |
f(χ |
|
|
0.4 |
|
0.2 |
|
0.0 |
0
b
|
1.0 |
|
|
0.8 |
|
) |
0.6 |
|
f(χ |
|
|
|
0.4 |
|
|
0.2 |
|
|
0.0 |
|
|
0 |
|
c 1e+8 |
||
|
1e+7 |
|
|
1e+6 |
|
Intensity |
1e+5 |
|
1e+4 |
||
|
||
|
1e+3 |
|
1e+2
1e+1
1e+0 
0
Absorption parameter f(χ) for C, E0 = 20 keV
5 |
10 |
15 |
20 |
|
Photon energy (keV) |
|
|
Absorption parameter f(χ) for C, E0 = 20 keV
1 2 3 4 5 Photon energy (keV)
Generated and emitted X-ray spectra for carbon
E0 = 20 keV
Generated
Emitted
5 |
10 |
15 |
20 |
|
X-ray photon energy (keV) |
|
|
4.5 · X-Ray Fluorescence
. Fig. 4.23 a Absorption parameter f(χ) as a function of photon energy for copper and an incident beam energy of E0 = 20 keV. Note the abrupt decrease just above the ionization energies of the three L-shells near 0.930 keV and the K-shell ionization energy at 8.98 keV. b Comparison of the generated (red) and emitted (blue) X-ray spectra for copper with an incident beam energy of E0 = 20 keV. c Comparison of the generated and emitted X-ray spectra for copper with an incident beam energy of E0 = 20 keV; expanded to show the region of the Cu L-shell and Cu K-shell ionization energies
a
|
1.0 |
|
0.8 |
) |
0.6 |
f(χ |
|
|
0.4 |
|
0.2 |
|
0.0 0 |
b1e+8
1e+7 
intensity |
1e+6 |
|
1e+5 |
||
|
||
X-ray |
1e+4 |
|
1e+3 |
||
|
||
|
1e+2 |
|
|
1e+1 |
|
|
1e+0 |
|
0 |
|
|
c |
1e+7 |
|
|
|
|||
intensityray-X |
1e+6 |
|
|
1e+4 |
|
|
|
|
1e+5 |
|
|
|
1e+3 |
|
|
|
1e+2 |
|
|
|
0 |
||
61 |
|
4 |
|
|
|
Absorption parameter f(χ) for copper, E0 = 20 keV
5 10 15 20 Photon energy (keV)
Copper, E0 = 20 keV
Emitted
Generated
5 10 15 20 Photon energy (keV)
Copper, E0 = 20 keV
Emitted
Generated
2 |
4 |
6 |
8 |
10 |
Photon energy (keV)
62\ Chapter 4 · X-Rays
|
. Fig. 4.24 a Absorption parameter f(χ) as a function of |
|
photon energy for gold and an incident beam energy of |
|
E0 = 20 keV. Note the abrupt decrease in f(χ) for photons |
|
just above the ionization energies of the gold M-shell and |
|
gold L-shell. b Comparison of the generated (red) and |
|
emitted (blue) X-ray spectra for gold with an incident beam |
|
energy of E0 = 20 keV. c Comparison of the generated (red) |
|
and emitted (blue) X-ray spectra for gold with an incident |
|
beam energy of E0 = 20 keV; expansion of the region around |
|
|
4 |
the gold M-shell ionization edges |
|
|
|
|
a |
Absorption parameter f(c) for gold, E0 = 20 keV |
|
1.0 |
|
0.8 |
) |
0.6 |
f(c |
|
|
0.4 |
0.2
0.0 |
|
|
|
|
0 |
5 |
10 |
15 |
20 |
|
|
Photon energy (keV) |
|
|
b |
|
1e+8 |
|
Gold, E0 = 20 keV |
|
|
|
|||
|
|
|
|
|
|
|
|
|
|
|
|
|
1e+7 |
|
|
|
|
|
|
Emitted |
|
|
|
|
|
|
|
|
|
|
||
|
|
1e+6 |
|
|
|
|
|
|
Generated |
|
|
|
|
|
|
|
|
|
|
||
|
|
|
|
|
|
|
|
|
|
|
|
intensityray |
1e+5 |
|
|
|
|
|
|
|
|
|
1e+4 |
|
|
|
|
|
|
|
|
|
|
|
|
|
|
|
|
|
|
|
|
|
X- |
1e+3 |
|
|
|
|
|
|
|
|
|
|
|
|
|
|
|
|
|
|
|
|
|
1e+2 |
|
|
|
|
|
|
|
|
|
|
1e+1 |
|
|
|
|
|
|
|
|
|
|
1e+0 |
|
|
|
|
|
|
|
|
|
|
0 |
5 |
|
10 |
|
|
15 |
20 |
|
|
|
|
|
Photon energy (keV) |
|
|
|
|||
c |
|
|
|
Gold, E0 = 20 keV |
|
|
|
|||
1e+8 |
|
|
|
|
|
|
|
|
||
|
1e+7 |
|
|
|
|
|
Emitted |
|
||
|
|
|
|
|
|
|
||||
|
|
|
|
|
|
Generated |
|
|||
intensity |
1e+6 |
|
|
|
|
|
|
|||
|
|
|
|
|
|
|
|
|||
1e+5 |
|
|
|
|
|
|
|
|
||
X-ray |
1e+4 |
|
|
|
|
|
|
|
|
|
|
|
|
|
|
|
|
|
|
||
|
1e+3 |
|
|
|
|
|
|
|
|
|
|
1e+2 0 |
1 |
2 |
3 |
|
|
4 |
5 |
||
|
|
|
|
Photon energy (keV) |
|
|
|
|||