

3513
.pdfIssue № 3 (39), 2018 |
ISSN 2542-0526 |
|
Fig. 3. Schematic view of a) Cross section, b) full and c) cut of tire |
|
|||
|
|
Mix proportions of mortar based composite |
Table 1 |
||
|
|
|
|||
|
|
|
|
Standard sand (g) |
|
Mix NO |
Mix code |
Cement (g) |
Water (g) |
RSF (weight %) |
|
|
|
|
|
1350 |
|
1 |
M-RSF 0.0 |
450 |
225 |
0.0 |
|
|
|
|
|
1350 |
|
2 |
M-RSF 1.0 |
450 |
225 |
1.0 |
|
|
|
|
|
1350 |
|
3 |
M-RSF 1.5 |
450 |
225 |
1.5 |
|
|
|
|
|
1350 |
|
4 |
M-RSF 2.0 |
450 |
225 |
2.0 |
|
|
|
|
|
1350 |
|
5 |
M-RSF 2.5 |
450 |
225 |
2.5 |
|
|
|
|
|
|
|
|
1800 |
|
|
|
|
|
(MPa) |
1600 |
|
|
|
|
|
1400 |
|
|
|
|
Original |
|
1200 |
|
|
|
|
||
|
|
|
|
Burned |
||
Stress |
1000 |
|
|
|
|
|
|
|
|
|
|
||
800 |
|
|
|
|
|
|
Tensile |
600 |
|
|
|
|
|
400 |
|
|
|
|
|
|
200 |
|
|
|
|
|
|
|
|
|
|
|
|
|
|
0 |
|
|
|
|
|
|
0 |
0,05 |
0,1 |
0,15 |
0,2 |
0,25 |
Strain (mm/mm)
Fig. 4. Tensile stress-strain curves of RSF, before and after combustion
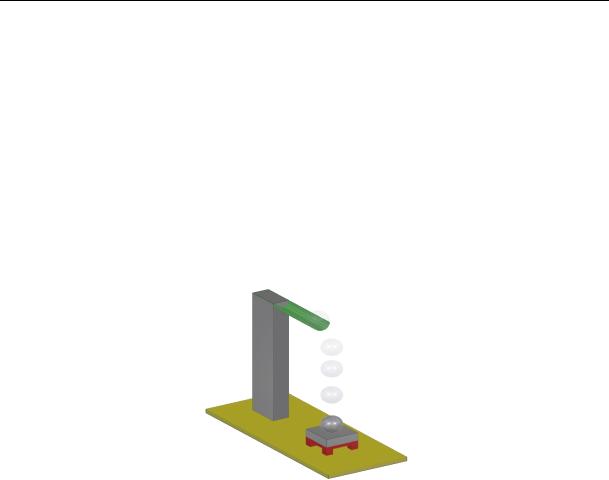
2.3.2. Impact test: Impact situations can be reserved into two classes, high and low velocity impact [30]. According to ACI Committee 544 drop weight impact test is the most appropriate test to measure the impact strength of a cementitious materials plate [31]. J. Yahaghi et al. examined Based on the drop weight impact test method Concrete slabs in 40 mm, 30 mm, and 20 mm thickness. And they using a self-fabricated tool dropped from 36 cm height 0.380 kg steel ball for slabs with thicknesses of 20 mm and 30 mm and 1.25 kg steel ball for slabs with thickness of 40 mm [30]. This study was done low-velocity drop weight impact test with a self-fabricated tool. Fig. 5. Specimens of 100 mm × 100 mm and 40 mm thickness were pro-
71
Russian Journal of Building Construction and Architecture
duced for the impact test and was carried by dropping of steel ball weighing 0.755 kg and diameter 57 mm out at a drop height of 570 mm for specimens. In this study the values of ultimate energy absorption will be obtained from the Eq. (2) [30]:
|
|
|
., |
(1) |
(2) |
||||
|
|
|
|
|
In this formulas, = energy for each pulse (Joules), = mass of the steel ball, (gravity) = = 9.81 / , h = fall height of the steel ball, = Ultimate energy absorption, = No. of impact at ultimate failure.
Fig. 5. Schematic view of drop weight impact test
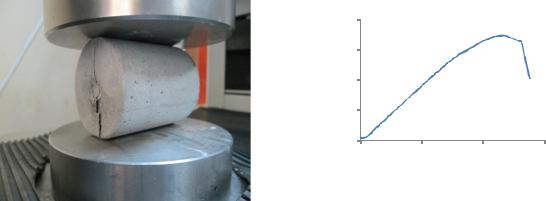
3. Finite element modeling (FEM). In recent years, FEM method is used to examine the materials and elements of construction with different geometry and dimensions for different purposes, extensively [32––35]. In this study, cement mortars with contain RSF in different amounts were modeled by the finite element (FE) method for impact laboratory test methods. We do not used any mechanical devices for impact laboratory test method by imitating J. Yahaghi et al, that's why FE modeling was performed for this test method only to compare with the results of laboratory test. FE models were carried with the ABAQUS-Standard program [36]. In FEM this study, the mortar material (matrix element) was assumed homogeneous. The mortar part was defined as 3d solid, and the RSF part was defined as wire. The mechanical and physical properties of the materials were defined according to the material properties of the experimental part and the results obtained. A split-cylinder test was performed for mortar (matrix) material for use in the FEM in this study. This test was applied using a cylinder specimen of 45 mm diameter and 75 mm length as shown in Fig. 6-a. The Eq. (3) was used to calculate the splitting tensile strength, f(st) (MPa), and the results are given as the strain-strain curves in Fig. 6-b.
72
Issue № 3 (39), 2018 |
ISSN 2542-0526 |
|
|
, |
(3) |
π |
where P is the applied load, D is the diameter of the specimen, and L is the length of the specimen. As shown the tensile strength found by this method, 3.46 MPa is lower than the flexural strength, 5.21 MPa. In the ABAQUS program, the values of the splitting tensile strengthstrain curve were used to represent the tensile behavior of the mortar material.
SplittingTensile Strength (MPa)
4
3
2
1
0
0 |
0,005 |
0,01 |
0,015 |
Strain (mm/mm)
a) |
b) |
Fig. 6. Applying split-cylinder test (a) and strength-strain result (b)
To represent inelastic behavior of mortar (matrix) in the ABAQUS program, compressive and tensile strengths values of mortar were used in the concrete damage plasticity (CDP) settings in the property section [37]. The CDP model is proposed by Lubliner et al for semi-brittle materials such as concrete [38]. There are five additional parameters that need to be defined in the CDP in the ABAQUS model: dilation angle (in degrees), eccentricity (the flow potential eccentricity), fb0/fc0 (the ratio of initial equibiaxial compressive yield stress to initial uniaxial compressive yield stress), K (the the ratio of the second stress invariant on the tensile meridian to that on the compressive meridian), and viscosity parameter. Default values are accepted since the values of these parameters are not very effective in the results, i.e. respectively 33 , 0.1 , 1.16 , 0.66 and 0.0 [33, 39].
In addition, the values obtained from the uniaxial tensile test to determine the tensile strength of the RSF (reinforcement member) were used. Fig. 4.
In this study, a rigid ball with the steel ball geometry used in the experimental method was simulated as without distance on the surface of slab specimens, and only with the condition that movable in the vertical direction. The process was continued using the Dynamic Explicit method in the Step section of the ABAQUS program. In models, the ball was hit on the sur-
73

Russian Journal of Building Construction and Architecture
face, by defining a load with N.m mass with the velocity calculated in Eq. (5) at RP (contact point between of ball and slab surface). Fig. 7. In this N.m expression, m is the weight of the ball used in the experimental method (0.755 Kg), which is constant for all models, and N is the average number of free drops for ultimate failure the slabs in the experimental method. As shown in the table 2, 7.33, 26.67, 52, 62.67 and 74.33 were reported for specimens with contain 0, 1.0, 1.5, 2.0 and 2.5 % RSF, respectively. The modeling process was continued until return direct of the 'velocity and the motion' of ball to obtain the final energy value adsorbed.
|
1 |
2. |
, |
(4) |
|
|
(5) |
||
In these free-fall equations, h is the drop |
height |
of the ball in the experimental method |
||
(0.57 m), g, gravity, t is time when the ball touches the surface (0.34089 s), and V is the ball's surface contact velocity (–3.3441 m/s). The mesh size was chosen as 2 mm by making mesh in different sizes to select the appropriate. The boundary and loading conditions are designed by imitating the experimental behavior of tests. Loading conditions and typical mesh of 3D FE models for impact tests are given in Fig. 7.
|
|
a) |
|
b) |
|
|
Fig. 7. Loading conditions (a) and typical mesh (b) of models |
|
|||
|
|
|
|
|
Table 2 |
The numbers of impacts required for specimens with RSF contain in different amount to fail |
|||||
|
|
|
|
|
|
Specimen code |
|
Impact number |
|
Averages of impact |
|
|
|
|
|
numbers |
|
|
group 1 |
group 2 |
|
group 3 |
|
|
|
|
|
8 |
|
M-RSF 0.0 |
7 |
7 |
|
7.33 |
|
|
|
|
|
27 |
|
M-RSF 1.0 |
26 |
27 |
|
26.67 |
|
|
|
|
|
53 |
|
M-RSF 1.5 |
51 |
52 |
|
52 |
|
|
|
|
|
64 |
|
M-RSF 2.0 |
62 |
62 |
|
62.67 |
|
|
|
|
|
75 |
|
M-RSF 2.5 |
74 |
74 |
|
74.33 |
|
|
|
|
|
|
|
74
Issue № 3 (39), 2018 |
ISSN 2542-0526 |
4. Results and discussion 4.1. Mechanical properties
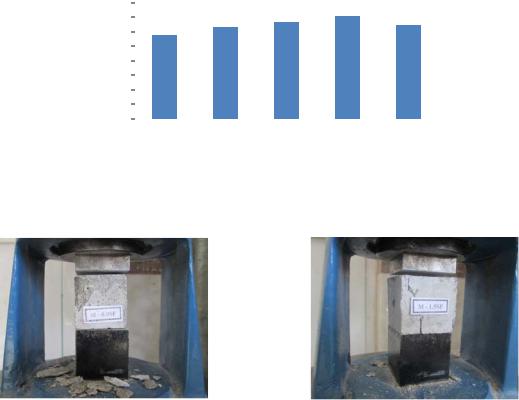
4.1.1. Compressive strength: The average compressive strength results of cube specimens with contain five different ratios RSF subjected to 28 days curing are given in Fig. 8. According to the results, the highest compressive strength value belongs to 2.0 % RSF reinforced specimens. Although the RSF content ratio of M-SF 2.5 specimens is much than that of M- SF 1.5 and M-SF 2.0 specimens, the average compressive strength values of M-SF 2.5 specimens are lower than them. The reason for this are the large size voids formed between the RSFs during concentration due to the increase in RSF amount in the mortar mixture. According to a study by H. Zhao et al., porosity in cement mortars is not the only one affecting the strength of the compressive, but large size pores can affect the compressive strength [40].
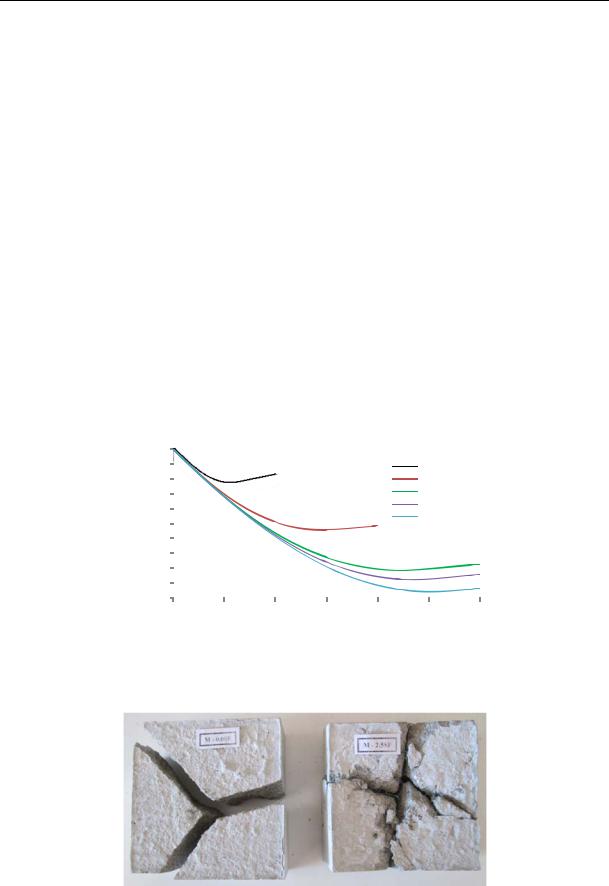
During the compaction test, as shown in Fig. 9, the unreinforced mortar specimen failed explosively at the end of the final loading, whereas the 1.5 % RSF reinforced specimen was failed after the final loading compressive test with the formation of vertical cracks. This can be related to a good adherence and connection between the mortar and the RSF.
Compressive Strength (MPa)
80 |
|
62,74 |
66,62 |
70,50 |
64,55 |
|
|||||
70 |
57,16 |
|
|||
|
|
||||
60 |
|
|
|
|
|
|
|
|
|
|
|
50 |
|
|
|
|
|
40 |
|
|
|
|
|
30 |
|
|
|
|
|
20 |
|
|
|
|
|
10 |
|
|
|
|
|
0 |
|
|
|
|
|
|
|
|
|
|
M-0.0RSF M-1.0RSF M-1.5RSF M-2.0RSF M-2.5RSF
Specimen Code
Fig. 8. Comparison of the compression strength results of specimen with containing RSF in different amount
a) b)
Fig. 9. Compressive test of cube specimens; unreinforced (a) and with contain 1.5 % RSF (b)
75
Russian Journal of Building Construction and Architecture
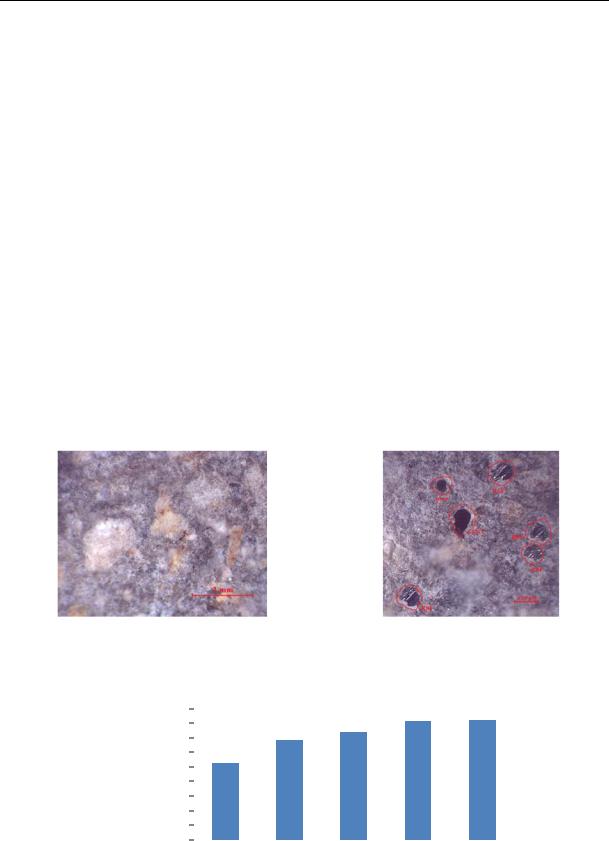
4.1.2. Flexural strength: Stereoscopic views of the cross-sectional surfaces of the unreinforced and 2.0% reinforced specimens produced for flexural testing are given in Fig. 10. Good adherence between RSF’s and mortar is showed in cross sections with homogeneous distribution between standard sand and cement. However, micro-pores are less visible on unreinforced samples, while the size and amount of micropores on reinforced specimens increased especially on 2.0 % reinforced specimens. According to the ASTM D790-02 [41], the average flexural strength values for all specimens were calculated using Eq. (6) and summarized in Fig. 11.
|
|
|
(6) |
|
where σF, P, L, W, and h are flexural strength, maximum, |
||||
applied load, free span, width and |
||||
specimens thickness, respectively. As shown in Fig. 11, the flexural strength results of all the RSF reinforced mortar specimens were obtained very high compared with mortar specimen without RSF. Also, the highest maximum flexural strength value between the flexural test results was reported by the 2.0 and 2.5 % RSF reinforced specimens.
Fig. 10. Stereoscopic views of the cross-sectional surfaces of the unreinforced and 2.0% reinforced specimens
Flexural Strength (MPa)
9 |
|
8,09 |
8,19 |
|
|||
8 |
6,83 |
7,34 |
|
7 |
|
|
|
|
|
|
|
6 |
5,21 |
|
|
5 |
|
|
|
4 |
|
|
|
3 |
|
|
|
2 |
|
|
|
1 |
|
|
|
0 |
|
|
|
|
|
|
M-0.0RSF M-1.0RSF M-1.5RSF M-2.0RSF M-2.5RSF
Specimen Code
Fig. 11. Comparison of the flexural strength results of specimen with containing RSF in different amount
76

Issue № 3 (39), 2018 |
ISSN 2542-0526 |
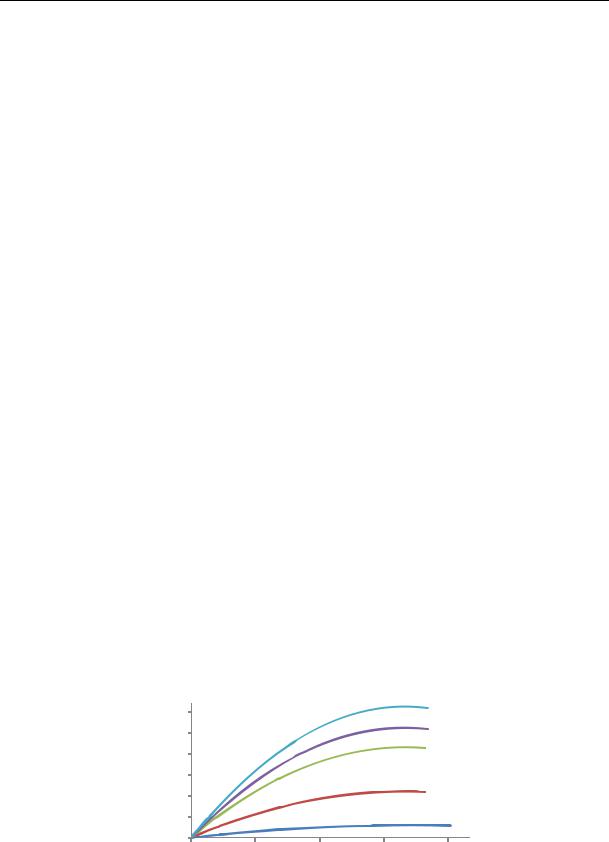
In Fig. 12, the load-displacement curves of the RSF reinforced specimens are compared with the curve of the unreinforced specimen. As shown in the curves, both the maximum load and elongation values of all reinforced specimens were significantly increased compared to the unreinforced specimen. Indentations are showed at the curves of the reinforced specimens, unlike the non-reinforced specimen, these indentations are related with the tensile force carrying of the fibers during loading.
|
3,5 |
|
|
|
|
|
|
3 |
|
|
|
|
|
(KN) |
2,5 |
|
|
|
|
|
2 |
|
|
|
M-0.0RSF |
|
|
|
|
|
|
M-1.0RSF |
|
|
Load |
1,5 |
|
|
|
|
|
|
|
|
M-1.5RSF |
|
||
|
|
|
|
M-2.0RSF |
|
|
|
1 |
|
|
|
|
|
|
|
|
|
M-2.5RSF |
|
|
|
|
|
|
|
|
|
|
0,5 |
|
|
|
|
|
|
0 |
|
|
|
|
|
|
0 |
1 |
2 |
3 |
4 |
5 |
Displacement (mm)
Fig. 12. Load-displacement curves of mortar specimens with contain RSF in different amounts
As practiced by many authors [16, 42], in flexural strength tests, the total area under the load-deflection curve represents the load capacity of the specimens; this also can be interpreted as the amount of energy absorbed during the load application, this adsorbed energy is called toughness. In this study too, the total area under the load-displacement curves in Fig. 12 is calculated and is given in Fig. 13.
Energy (J)
7 |
Area under the curve (Toughness) |
|
5,91 |
||
6 |
||
|
||
5 |
4,30 |
|
4 |
3,45 |
|
3 |
|
|
2 |
0,93 |
|
1 |
||
0,33 |
0
M-0.0RSF M-1.0RSF M-1.5RSF M-2.0RSF M-2.5RSF
Specimen Code
Fig. 13. Toughness values of mortar specimens with contain RSF in different amounts
77
Russian Journal of Building Construction and Architecture
As shown in figure, while there was no significant difference between the 1.0 % RSF reinforced specimens and unreinforced specimens, the area under curves of specimens with 1.5 %, 2.0 % and 2.5 % RSF increased by 10, 13 and 18 times, respectively, compared to the unreinforced sample. This result can show that the load capacity in the bending test is directly related to the amount of fiber. As a result, similarly to the related studies [16, 42––44], the flexural strength values of specimens with 2.0––2.5 % steel fiber were obtained more appropriately than the other specimens.
4.2. Impact properties (experimental and FEM): The ultimate energy values obtained up to the ultimate failure of the RSF reinforced mortar specimen slabs at 40 mm thickness were increased with the increase of the RSF volume fraction. For example, while 30.96 joules of energy were needed to failure the slabs without RSF, an average of 313.80 joules of energy were consumed for the ultimate failure of the specimens with 2.5 % RSF contain. With the increase of the RSF volume, a more effective composite material is obtained against stresses due to the formation of more bridges in the matrix, and also energy absorption was increased with the increase of failure duration [30].
Also, the FE method results have been reported with a negligible difference compared to the experimental results. The ultimate energy values of the FEMs depending on the velocity are given in Fig. 14 from the starting of the impact load (in contact with the surface) to ineffectual. Where, the ineffectual expression is used to 'reset of the velocity or change of the direction and separate of the impact load from the surface'. As shown in figure, the ultimate energy values were increased as the RSF volume increases in all FEMs. These FEM values are good results for controlling the results obtained with the self-fabricated method. The ultimate energy values obtained by both experimental and FE method were given in Fig. 15 for comparison. As shown in figure, the maximum absorbed energy value in both methods is related to the specimen with contain 2.5 % RSF.
Energy Absorption |
(Joules) |
Ultimate |
|
300 M-0.0RSF
 M-1.0RSF
250 M-1.5RSF
 M-2.0RSF
200  M-2.5RSF
150
100
50
0 |
|
|
|
|
-3,34 |
-2,34 |
-1,34 |
-0,34 |
0,66 |
Velocity (m/s)
Fig. 14. Change of energy values depending on velocity
78

Issue № 3 (39), 2018 |
ISSN 2542-0526 |
Energy Absorption |
(Joules) |
Ultimate |
|
350 |
Experimental |
313,80 |
312,16 |
|
300 |
||||
264,58 261,67 |
|
|||
250 |
|
219,53 215,02 |
|
|
200 |
|
|
|
|
150 |
112,59109,57 |
|
|
|
100 |
|
|
|
|
50 |
30,96 29,18 |
|
|
0
M-0.0RSF M-1.0RSF M-1.5RSF M-2.0RSF M-2.5RSF
Specimen Code
Fig. 15. Comparison of the ultimate energy absorption results of slabs with containing RSF in different amount
There is a linear relationship between the ultimate energy values of the specimens with contain RSF in different volumes, this case given in Fig. 16 as linear correlation curve. Where, obtained coefficient of determination for ultimate energy results, Eq. (7), is above the minimum value (0.70) [30, 45], So, the Eq. (8) can be used to estimate the absorbed ultimate energy values of cement mortars with contain 0––2.5 % RSF. Where, there is no significant difference between the experimental and FE results, so the only equation for both methods is considered sufficient.
u |
|
Energy Absorption, E |
(Joules) |
Ultimate |
|
350 |
|
|
Experimental results |
|
|
|
|
|
||
|
|
|
|
|
|
|
||||
|
|
|
|
|
|
|
|
|||
300 |
|
• FEM results |
|
|
|
|
|
|||
|
|
|
|
|
|
|||||
|
|
|
|
|
|
|
|
|
|
|
250 |
|
̶̶̶̶̶Predicted results |
|
|
|
|
|
|||
|
|
|
|
|
|
|||||
|
|
Eu = 118.24RSF + 22.751 |
|
|
|
|
|
|||
200 |
|
|
R² = 0.9755 |
|
|
|
|
|
||
|
|
|
|
|
|
|
||||
|
|
|
|
|
|
|
||||
|
|
|
|
|
|
|
|
|
|
|
150 |
|
|
|
|
|
|
|
|
|
|
100 |
|
|
|
|
|
|
|
|
|
|
|
|
|
|
|
|
|
|
|
|
|
|
|
|
|
|
|
|
|
|
|
|
50 |
|
|
|
|
|
|
|
|
|
|
|
|
|
|
|
|
|
|
|
|
|
0
0 |
0,5 |
1 |
1,5 |
2 |
2,5 |
RSF(%)
Fig. 16. Linear equation between ultimate energy values and RSF content |
|
R² = 0.9755, |
(7) |
Eu = 118.24RSF + 22.751. |
(8) |
In Fig. 17, emerging displacement curves after the applied of the impact load depending on time were given. The displacement values obtained are values including crushed too. Also, this case was confirmed from the front surfaces of the experimental samples in the Fig. 18 given as an example. As shown in Fig. 17, both the displacement and the time values were
79
Russian Journal of Building Construction and Architecture
increased by the increase of the RSF content. In particular, the failure times and displacement values of slabs with contain 1.5, 2.0 and 2.5 % RSF were increased considerably compared to the unreinforced slab. For example, the simulation views representing the three different steps of the curves in Fig. 17 for unreinforced slab and 2.5 % RSF containing slab are given in Fig. 19 as cross section. These three stages are: a) the beginning moment of impact load from point of contact between rigid ball and slab surface, (t = 0), b) time to leave the surface of the ball, (t = tmax displacement, V = 0) and c) end time of simulation, (t = tend). According to the view of the unreinforced slab cross section, very low displacement was caused to the formation of cracks. Whereas, the slab with contain 2.5 % RSF were showed a significant displacement to fail. The reason for this is related to bridges forming of RSFs. Where, the RSFs are responsible for distributing the stresses from the impact load within the matrix, which this causes to an increase in the failure period of the matrix. This can also be determined from the deflection of the RSFs in Fig. 20. This figure also is expresses the good bond between the reinforcement element (RSFs) and the matrix (mortar), in FEMs.
Displacement (mm)
0 |
|
|
|
|
|
|
|
|
|
|
|
|
|
|
|
|
|
-1 |
|
|
|
|
|
M-0.0RSF |
|
|
-2 |
|
|
|
|
|
M-1.0RSF |
|
|
-3 |
|
|
|
|
|
M-1.5RSF |
|
|
-4 |
|
|
|
|
|
M-2.0RSF |
|
|
|
|
|
|
|
M-2.5RSF |
|
|
|
-5 |
|
|
|
|
|
|
|
|
|
|
|
|
|
|
|
|
|
-6 |
|
|
|
|
|
|
|
|
-7 |
|
|
|
|
|
|
|
|
-8 |
|
|
|
|
|
|
|
|
-9 |
|
|
|
|
|
|
|
|
-10 |
|
|
|
|
|
|
|
|
|
|
|
|
|
|
|
|
|
0 |
1 |
2 |
3 |
4 |
5 |
6 |
||
Time (ms)
Fig. 17. Displacement curves after the applied of the impact load depending on time
Fig. 18. The front surfaces of the specimens after failure; left: unreinforced, right: 2.5 % reinforced
80