

3513
.pdfIssue № 3 (39), 2018 |
ISSN 2542-0526 |
As the transporting capacity of weighed particles depends not only on the water flow rate but also on the filling, the transporting capacity of a flow accompanied by a gradual stepwise increase in the fillings for different heights of artificial obstacles in the Reynolds number range corresponding with a turbulent mode for open reservoirs will be studied in further experiments. There are plans to carry out experiments for determining an optimal configuration of obstacles and their step, i.e. character of a relief that contributes to wave formation.
From the engineering standpoint, the experiments and their results are in agreement with a number of theoretical and practical assumptions of foreign scholars dealing with transfer of weighed substances with a liquid flow and its modelling in horizontal areas of pipes [8] as well as changes in reservoirs and flows that cause wave formation and an increase in rate pulsation areas [9, 11].
Conclusions. 1. For the first time liquid flow modes have been investigated and the character of the turbulization of a miniflow in an open tray with the transportation of weighed substances on a water retentive protective coating has been described.
2.The methods that we have developed including the algorithm of the interaction of the structure of the investigated pipes with the liquid flow motion as well as design and test of new structures of hydraulic stands, the use of an automated software for calculating the geometric, hydraulic and water retentive indices allows researchers to perform a quick evaluation of almost any type of potential protective coatings of pipelines that are maintained by means of trenchless methods or being renovated.
3.The structures of small-sized stands for studying the water-repelling properties and transporting capacity of a flow are competitive with large-sized hydraulic setups as they contribute to lower construction costs as well as more time-efficient natural experiments.
References
1.Zotkin S. P., Sadovskii B. S., Zotkina I. A. K voprosu o sopryazhenii prikladnykh programm s Microsoft Word [On the question of pairing applications with Microsoft Word]. Voprosy prikladnoi matematiki i vychislitel'noi mekhaniki, 2014, no. 17, pp. 260––263.
2.Orlov V. A., Dezhina I. S., Orlov E. V., Averkeev I. A. Ispytatel'nyi stend po opredeleniyu stepeni gidrofobnosti materialov dlya izgotovleniya trub i remonta truboprovodov [Test stand to determine the degree of hydrophobicity of materials for the manufacture of pipes and repair of pipelines]. Patent RF, no. 157695, 2015.
3.Orlov V. A., Dezhina I. S., Pelipenko A. A., Orlov E. V. Ispytatel'nyi stend po issledovaniyu turbulentnosti i transportiruyushchei sposobnosti potoka zhidkosti opticheskimi sredstvami v otkrytykh lotkakh pri razlichnom rel'efe ikh vnutrennei poverkhnosti [Test stand for the study of turbulence and the transporting ability of the fluid flow by optical means in open trays with different relief of their internal surface]. Patent RF, no. 176330, 2017.
41

Russian Journal of Building Construction and Architecture
4.Orlov V. A., Zotkin S. P., Dezhina I. S., Pelipenko A. A. Programma rascheta stepeni gidrofobnosti i gidravlicheskikh parametrov trub i zashchitnykh pokrytii [The program for calculating the degree of hydrophobicity and hydraulic parameters of pipes and protective coatings]. Patent RF, no. 2017612281, 2017.
5.Orlov V. A., Primin O. G., Shcherbakov V. I. Prochnostnye kharakteristiki dvukhsloinykh konstruktsii truboprovod – polimernyi rukav [Strength characteristics of two-layer structures of pipelines connected to polymeric sleeve]. Vestnik MGSU, 2012, no. 2, pp. 15––19.
6.Otstavnov A. A., Khantaev I. S., Orlov E. V. K vyboru trub dlya bestransheinogo ustroistva truboprovodov vodosnabzheniya i vodootvedeniya [To the choice of pipes for trenchless device of water supply and water disposal pipelines]. Plasticheskie massy, 2007, no. 3, pp. 40––43.
7.Ariaratnam S. T., Sihabuddin S. Comparison of Emitted Emissions between Trenchless Pipe Replacement and Open Cut Utility Construction. Journal of Green Building, 2009, vol. 4, iss. 2, pp. 126––140.
8.Arolla S. K., Desjardins O. Transport modeling of sedimenting particles in a turbulent pipe flow using Euler-
Lagrange large eddy simulation. International Journal of Multiphase Flow, 2015, vol. 75, pp. 1––11. doi: 10.1016/j.ijmultiphaseflow.2015.04.010.
9.Charru F. Selection of the ripple length on a granular bed sheared by a liquid flow. Physics of Fluids, 2006, no. 18, pp. 1––9.
10.Choi С., Ulmanella U., Kim J., Kim C. Effect slip and friction reduction in nanograted superhydrophobic microchannels. Physics of Fluids, 2006, no. 18, pp. 87––105.
11.Coleman S., Nikora V. I. Bed and flow dynamics leading to sediment-wave initiation. J. Water Resources Research, 2009, vol. 45, iss. 4, pp. 1––12.
12.Dorrer C., Ruhe J. Condensation and Wetting Transitions on Microstructured Ultrahydrophobic Surfaces. J. Langmuir, 2007, vol. 23, pp. 3820––3824.
13.Grossmann S., Lohse D. Curvature effects on the velocity profile in turbulent pipe flow. The European Physical Journal E., 2017, vol. 40, no. 16, pp. 1––10. doi: https://doi.org/10.1140/epje/i2017-11504-x
14.Janssen A. Importance of lateral structural repair of lateral lines simultaneously with main line CIPP rehabilitation. 31 NO-DIG International Conference and Exhibition. Sao Paulo, Brasil, 2012, vol. 012287, pp. 1––10.
15.Kidanemariam A. G., Uhlmann M. Direct numerical simulation of pattern formation in subaqueous sediment. J. Fluid Mechanics, 2014, no. 750, pp. 1––3.
16.Kuliczkowski A. Rury kanalizacyjne. Kielce, Wydawnictwo Politechniki Swietokrzyskiej, 2004. 507 p.
17.Le G. N., Daerr A., Limat L. Shape and motion of drops sliding down an inclined Plane. J. Fluid Mech. 2005, vol. 541, pp. 293––315.
18.Oner D., McCarthy T. J. Ultrahydrophobic surfaces: effects of topography length scales on wettability. Langmuir, 2000, vol. 16 (20), pp. 7777––7782.
19.Rabmer K. U. No-dig technologies –– innovative solution for efficient and fast pipe rehabilitation. 29 NODIG International Conference and Exhibition. Berlin, 2011, paper 2C-1, pp. 1––10.
20.Rameil M. Handbook of pipe bursting practice. Germany, Vulkan verlag Gmbh, 2007. 310 p.
21.Wei G., Xu R., Huang B. Analysis of stability failure for pipeline during long distance pipejacking. Chinese Journal of Rock Mechanics and Engineering, 2005, vol. 24, no. 8, pp. 1427––1432.
22.Yang Z. L., Laux H., Ladam Y. e. a. Dynamic simulation of sand transport in a pipeline. 5th North American Conference on Multiphase Technology. Canada, BHR Group Ltd, 2006, pp. 200––204.
42

Issue № 3 (39), 2018 |
ISSN 2542-0526 |
BUILDING MATERIALS AND PRODUCTS
UDC 666.94.002.35
O. B. Kukina1, S. S. Glazkov2, D. E. Barabash3
ORGANO-MINERAL MODIFIER OF CLAY SOILS
STRENGTHENED BY CEMENT
Voronezh State Technical University
Russia, Voronezh, tel.: (473)2717-617, e-mail: lgkkn@rambler.ru
1PhD in Engineering, Assoc. Prof. of the Dept. of Chemistry and Chemical Technology of Materials, 2D. Sc. in Engineering, Prof. of the Dept. of Chemistry and Chemical Technology of Materials Russian Air Force Military Educational and Scientific Center
«Air Force Academy Named after Professor N. Ye. Zhukovsky and Yu. A. Gagarin» Russia, Voronezh, tel.: +7-908-146-94-66, e-mail: barabash60170@yandex.ru
3D. Sc. in Engineering, Prof., Head of the 31-st Chair of Research and Design of Airfields
Statement of the problem. The problem of deacceleration of cement stone setting in reinforced clay soils by means of a suggested complex organomineral modifier is presented.
Results. An organo-mineral additive for cement stone modification is synthesized. The dynamics of the structure formation of the additive particles in the process of synthesis is determined. The influence of the modifier on the strength of cement stone and soil cement is studied. The rational composition of the modified soil cement the strength of which exceeds the strength of the traditional soil cement by 1.5 times is specified.
Conclusion. The effectiveness of the use of a cement stone synthesized modifier as a soil stabilizer and deaccelerator of the cement laying rate of setting in the process of clay soils strengthening is proved. The prospects of the use of the designed modifier are presented, the most rational areas of its use, namely for soil bases structure and highway rural road pavement, are determined.
Keywords: organo-mineral modifier, clay soils, reinforcement of soils.
Introduction. Strengthening of clayous soils using modern modifiers has been very important following stipulated by the Address of the President of the Russian Federation to the Federal Assembly on December 12, 2012 on the double rate in the funds on construction and reconstruction of highways in 2013––2022 compared to the last decade. Soil modifiers are widely
© Kukina O. B., Glazkov S. S., Barabash D. E., 2018
43

Russian Journal of Building Construction and Architecture
used in construction and reconstruction of highways and runways of different types: logistic sites and shopping centers, port and customs terminals, parking lots and forst/park pathways, hydroinsulation of (toxic) waste dump sites [3, 5, 7, 13, 17, 19].
The use of organic and organic and mineral stabilizers in soil strengthening is impossible without analyzing structural and functional features of modifiers and cement soils [11, 20]. Reactive funсtional oligomers certainly have a leading position in structure formation of strengthened soils [11] as well as processing of secondary raw materials [4, 12, 15]. It is essential that compatibility of a binder and filler at the contact area is evaluated in terms of thermal dynamics [9—12]. It is known that biopolymers is used to strengthen soils [9, 11, 21—22].
The most common soils that need stabilizing are clay and loam. In order to stabilize them, in Russia various compounds are used, e.g., organic (Permazime, USA), Dorzon (Ukraine), ECOROAD (USA), lime (Roadbond (South Africa), SuperMix (Russia), acid (RoadPaker Plus (Canada), RPP-235 (Germany), CBR+ (South Africa), polymer emulsions (LBS (USA), M10+50 (USА), LDC+12 (USА), Nanostab (Germany), Dorstab (Russia), ECOLUX (Russia) [13, 16]. The objective of strengthening clay soils and alkalis is to improve their operational characteristics, i.e. to enhance their resistance to cracks and water, wear and tear [6, 8, 14]. A supplement be competitive compared to other ones already in use in road industry.
Considering all of the above, we have synthesized an organic and mineral modifier based on water polyvinylacetate dispersion containing both mineral and organic binders.
1. An organic and mineral modifier of cement soil was synthesized using the following components:
––polyvinylacetate dispersion (PVA) D7D 51/15 v, homopolymeric rough disperse according to the GOST (ГОСТ) 18992-80 with the mass concentration of a solid residual of 50—55 %;
––a liquid natrium glass according to the GOST (ГОСТ) 13078-81 with the mass concentration of silicon oxide of 27—30 %;
––carboxymethylcellulose.
The chemical properties of PVA are determined by complex ether groups and graft chains joined with the main chain with complex ether bonds. PVA is soaped with water solutions of acids and alkalis and undergo alcoholysis under the effect of catalytic amounts of acids and alcohols of alkali metals in waterless media with the formation of polyvinyl alcohol. The equation of the reaction is given in Fig. 1 [18].
Along with the main reactions there are side reactions of saponification of small amounts of nonpolymerized vinyl acetate and acetic-acid ether as shown in Fig. 2 [18].
44
Issue № 3 (39), 2018 |
ISSN 2542-0526 |
CH2 |
|
CH |
|
|
|
|
|
|
n ROH |
|
щелочьAlkakiилиorкислотаacid |
|
|
|
|
|
CH2 |
|
|
CH |
|
|
|
|
|
|
n ROCOCH3 |
||
|
|
|
|
|
|
|
|
|
|
|
|
|
|
|
|
|
|
|
|
||||||||||
|
|
|
|
|
|
|
|
|
|
|
|
|
|
|
|
|
|
|
|
|
|
||||||||
|
|
|
OCOCH3 |
|
|
|
CH |
|
|
|
|
|
|
|
|
|
|
|
|
|
|
|
|
|
|||||
|
|
|
|
|
|
|
|
|
|
|
OH |
|
|
|
n |
||||||||||||||
|
|
|
|
|
|
|
n |
|
|
|
|
|
|
|
|
|
|
|
|
||||||||||
|
|
|
|
|
|
|
|
|
|
|
|
|
|
|
|
|
|
||||||||||||
|
|
|
|
|
|
|
|
|
|
Fig. 1. Alcoholysis reaction of PVA |
|
|
|
|
|
|
|
||||||||||||
|
CH2=CHOCOCH3+ROH |
щелочь или кислота |
CH3CHO +ROCOCH3 |
||||||||||||||||||||||||||
|
Alkaki or acid |
||||||||||||||||||||||||||||
Fig. 2. Saponification of vinyl acetate
The carboxymethylcellulose is a poly-1.3-glycol. This structure is predominant, but there is always some small amount of additives by means of α-carbon atomб which results in up to 2 % of hydroxyl groups in the carboxymethylcellulose being located in the same way as in 1.2-glycol. The formula of the carboxymethylcellulose is given in Fig. 3 [18].
CH2 CH CH CH2
OH OH
Fig. 3. Formula of the carboxymethylcellulose
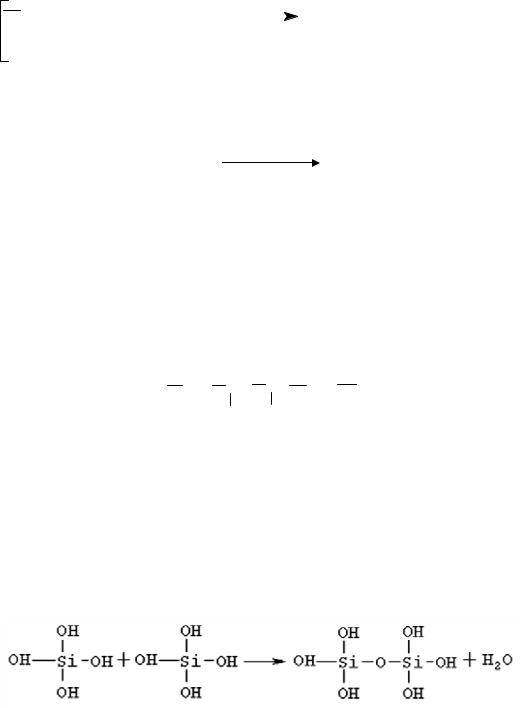
The liauid natrium glass (alkaline solution of sodium silicates Na2O (SiO2) n) during hydrolysis forms a silicic acid gel that is a construction glue, i.e. a binding component.
The silicic acid gel is formed according to the scheme shown in Fig. 4 [2, 13].
Fig. 4. Formation of the silicic acid gel
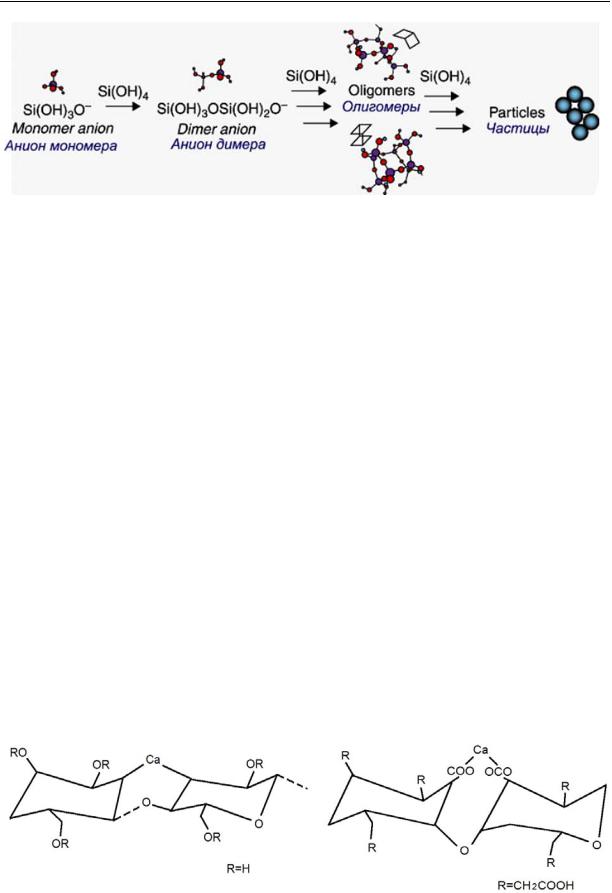
All the components of Portland cement clinker of the compound and phase interact with water and show hydration activity. As a result, there are hydrated cations-coagulants Са2+, Mg2+, Al3+ , Fe3+, etc. in the solution. They are absorbed by the surface of silica colloidal particles between the particles transforming them into aggregates. An approximate scheme of aggregation is shown in Fig. 5 [1, 2].
45
Russian Journal of Building Construction and Architecture
Fig. 5. Aggregation of silica colloidal particles
In the liquid glass there are hydrated ions-silicates and hydrosilicates that form a solidification system СаSiO3 with free hydrated ions of Cа2+ of the cement water solution. A reduced ionic equation of the system is shown in Fig. 6 [15].
Ca2+ + SiO32− → CaSiO3↓
Fig. 6. Formation of water insoluble calcium silicate
We believe that polymerization of carboxymethylcellulose can also be accompanied with the formation of bridges through the calcium ions resulting in the structures exemplified in Fig. 7. According to the above theoretical concepts, a preliminary analysis of the original data was performed and the experiment was planned.
The synthesis was carried out with 1 litre of an organic and mineral additive. In a beaker per 1 litre 200 g of 46 % dispersion of PVA with рН = 7 was weighed. As it was heated up to 60—70 °С and constantly stirred, 500 ml of water was added followed by 25 ml of liquid natrium glass. рН was measured as 12. Mixing as the temperature was maintained took place over 7 days till complete homogenization. рН was found to drop to 9. Then 50 % solution of СаСl2 (40 ml) was gradually introduced with рН being controlled.
Fig. 7. Polymerization of carboxymethylcellulose
46
Issue № 3 (39), 2018 |
ISSN 2542-0526 |
As рН dropped to 7, 100 g of 14 % of carboxymethylcellulose as a dispersion stabilizer was added. As a result we obtained 450 ml of organic and mineral modifier (24 % solution).
2. Study of the influence of synthesized organic and mineral modifier on the properties of cement soils. In order to make samples of non-modified and modified cement soils, Portland cement (PC) by the Stariy Oskol Cement Plant (CEM I according to the GOST (ГОСТ) 31108-2003), clayous soil and synthesized complex additive (CA) were used.
The samples were of a cylindrical form sized 3 × 3 сm according to the recipes presented in Table 1 and 2.
|
Composition of cement samples |
|
Таble 1 |
|||
|
|
|
||||
|
|
|
|
|
|
|
System |
Mass |
Loading during |
Mass |
Mass |
Mass |
|
concentration, % |
formation, МPа |
of cement, g |
of CA, g |
of water, g |
||
|
||||||
|
|
|
|
|
|
|
PC + water 10 % |
0 |
|
37 |
–– |
3.7 |
|
|
|
|
|
|
|
|
|
0.05 |
|
37 |
0.075 |
3.6 |
|
|
|
|
|
|
|
|
|
0.10 |
10 |
37 |
0.15 |
3.58 |
|
|
|
|
|
|
||
PC + CA + water 10 % |
0.50 |
37 |
0.77 |
3.1 |
||
|
||||||
|
|
|
|
|
|
|
|
1.00 |
|
37 |
1.54 |
2.53 |
|
|
|
|
|
|
|
|
|
2.00 |
|
37 |
3 |
1.44 |
|
|
|
|
|
|
|
|
PC + water 10 % |
0 |
|
40 |
–– |
4 |
|
|
|
|
|
|
|
|
|
0.05 |
|
40 |
0.08 |
3.94 |
|
|
|
|
|
|
|
|
|
0.10 |
20 |
40 |
0.16 |
3.88 |
|
|
|
|
|
|
||
PC + CA + water 10 % |
0.50 |
40 |
0.83 |
3.37 |
||
|
||||||
|
|
|
|
|
|
|
|
1.00 |
|
40 |
1.66 |
2.74 |
|
|
|
|
|
|
|
|
|
2.00 |
|
40 |
3.33 |
1.47 |
|
|
|
|
|
|
|
|
The analysis of the kinetics of an increase in the strength of the samples made under the load of 10 МPа found that the use of a complex additive in different concentrations reduces the strength of a modified cement rock compared to that in the samples by 1.5—2 times.
Hence after day 1 the strength of the samples was 31 МPа and that of the CA samples was 19, 20, 17, 15 and 14 МPа with 0.05, 0.1, 0.5, 1 and 2 % of the additive respectively.
After day 3 the strength of a cement rock went up two-fold except the samples with 0.1 % of CA. From day 3 to day 7 the solidification showed a significant slowdown in the samples with the compositions 2 and 6. By day 14 the strength of the samples with 0.05 and 0.1 % of CA dropped to 23 and 21 МPа respectively. By day 28 the strength of the samples was 63 МPа, while in those with the additive only by 30—39 МPа. The strongest out
47

Russian Journal of Building Construction and Architecture
of the modified samples were the samples with 1 % of the additive and the least strong ones with 0.1 %.
|
Composition of cement soil samples |
|
|
Таble 2 |
|||
|
|
|
|
||||
|
|
|
|
|
|
|
|
|
Mass con- |
Loading |
Mass of |
Mass of |
Mass of |
Mass of |
|
System |
centration of |
durinf for- |
|||||
soil, g |
cement, g |
CA, g |
water, g |
||||
|
CA, % |
mation, МPа |
|||||
|
|
|
|
|
|||
|
|
|
|
|
|
|
|
Soil + CA (10 %) + |
|
|
|
|
|
|
|
+ water (17 % of the mass |
0 |
|
33.5 |
3.35 |
–– |
6.26 |
|
of CS) |
|
|
|
|
|
|
|
|
|
|
|
|
|
|
|
|
0.05 |
10 |
33.5 |
3.35 |
0.08 |
6.10 |
|
|
|
|
|
|
|
||
Soil + PC (10 %) + |
0.10 |
33.5 |
3.35 |
0.15 |
6.00 |
||
|
|||||||
+ CA + water (17 % of the |
|
|
|
|
|
|
|
0.50 |
|
33.5 |
3.35 |
0.75 |
5.60 |
||
mass of CS) |
|
|
|
|
|
|
|
1.00 |
|
33.5 |
3.35 |
1.50 |
5.00 |
||
|
|
|
|
|
|
|
|
|
2.00 |
|
33.5 |
3.35 |
3.00 |
4.00 |
|
|
|
|
|
|
|
|
|
Soil + PC (10 %) + |
|
|
|
|
|
|
|
+ water (17 % of the mass |
0 |
|
36.0 |
3.60 |
–– |
6.70 |
|
of CS) |
|
|
|
|
|
|
|
|
|
|
|
|
|
|
|
|
0.05 |
20 |
36.0 |
3.60 |
0.08 |
6.60 |
|
|
|
|
|
|
|
||
Soil + PC (10 %) + |
0.10 |
36.0 |
3.60 |
0.16 |
6.58 |
||
|
|||||||
+ CA + water (17 % of the |
|
|
|
|
|
|
|
0.50 |
|
36.0 |
3.60 |
0.83 |
6.00 |
||
mass of CS) |
|
|
|
|
|
|
|
1.00 |
|
36.0 |
3.60 |
1.66 |
5.40 |
||
|
|
|
|
|
|
|
|
|
2.00 |
|
36.0 |
3.60 |
3.33 |
4.20 |
|
|
|
|
|
|
|
|
|
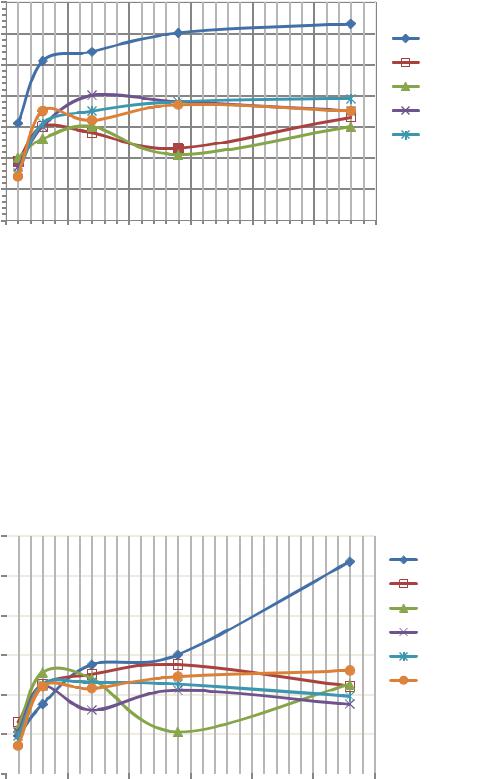
The formation was perfomed using a universal testing machine UMM-20 with an extra load of 10 and 20 МPа. The formed samples were stored in a desiccator at room temperature for 28 days. The compressive strength limit was determined after 1, 3, 7, 14 and 28 days according to the Russian standards and international practices [7, 25]. The kinetics of an increase in the strength of the samples from non-modified and modified soils is presented in Fig. 8—11.
The analysis of the kinetics of an increase in the strength of the samples made under a load of 20 МPа found that after 3 days the strength of the samples with the additive is 10 МPа as much as for the samples (35 МПа). By day 7 there was a drop in the strength of the samples containing 0.1 and 0.5 % of a complex additive. From day 7 to day 14 there was a sharp decrease in the strength from 48 to 21 МPа in the samples containing 0.1 % of CA. Then the strength was also on a sharp rise and after 28 days it was 45 МPа. The strength of the remaining samples was increasing with no changes in the speed. The strength of the samples on day 28 was 107 МPа.
48
Issue № 3 (39), 2018 |
ISSN 2542-0526 |
Пределпрочностиприсжатии, МПа Compressive strength limit, MPa
70
60
50
40
30
20
10
0
1 |
|
11––00%%КДСА |
|||||
|
|
|
|
|
|
|
|
4 |
|
|
|
|
22––0,05.05%%КДСА |
||
|
|
|
|
||||
|
|
|
|
33––0,1.1%%КДСА |
|||
5 |
|
||||||
|
|
||||||
|
|
62 |
|
44––0,5.5%%КДСА |
|||
|
|
|
|
|
3 |
|
55––11%%КДСА |
|
|
|
|||||
|
|
|
|||||
|
|
|
|
|
|
|
|
 66––22%%КДСА
0 |
5 |
10 |
15 |
20 |
25 |
30 |
Time,Времяdays,сут
Fig. 8. Кinetics of an increase in the strength of the samples of a cement rock with the water content of 10 % formed under a load of 10 МPа
It was noted that the strength of the samples made at the pressure 20 МPа for both the samples as well as those containing 1.5 times as much CA as those made at 10 МPа.
The tests of the cement soil samples formed under the press pressure of 10 МPа found that an addition of CA has no effect on their daily strength while on day 3 the strength went up from 4.6 to 5 МPа in the samples with 0.05 and 0.1 % of CA.
Предел прочности при сжатии, Compressive strengthМПа limit, MPa
120 |
|
|
|
|
|
|
|
|
|
1 |
|
|
|
|
|
|
|
|
|
|
|
|
|
|
|
|
|
|
|||
|
|
|
|
|
|
|
|
|
|
|
|
|
|
||
100 |
|
|
|
|
|
|
|
|
|
|
|
|
1––0%%КДСА |
||
|
|
|
|
|
|
|
|
|
|
|
|
|
|
–– . % СА |
|
|
|
|
|
|
|
|
|
|
|
|
|
|
|||
|
|
|
|
|
|
|
|
|
|
|
|
|
|
|
2 0,05% КД |
80 |
|
|
|
|
|
|
|
|
|
|
|
|
|
|
3––0,1.1%%КДСА |
|
|
|
|
|
|
|
|
|
|
|
|
|
|
4––0,5.5%%КДСА |
|
|
|
|
|
|
|
|
|
|
|
|
|
|
|
|
|
60 |
|
|
|
|
|
|
|
|
2 |
6 |
|
|
|
5––11%%КДСА |
|
|
|
|
|
|
|
|
|
||||||||
|
|
|
|
|
|
|
|
2 % КД |
|||||||
|
|
|
|
|
|
|
|||||||||
|
|
|
|
|
|
|
|
|
|
|
|
|
|||
40 |
|
|
|
|
|
|
|
|
|
|
54 |
|
|
|
6––2 % СА |
|
|
3 |
|
|
|
|
|
|
|||||||
|
|
|
|
|
|
|
|
|
|||||||
20 |
|
|
|
|
|
|
|
|
|
||||||
|
|
|
|
|
|
|
|||||||||
|
|
|
|
|
|
|
|
|
|
|
|
|
|
|
|
|
|
|
|
|
|
|
|
|
|
|
|
|
|
|
|
0 |
|
|
|
|
|
|
|
|
|
|
|
|
|
|
|
|
|
|
|
|
|
|
|
|
|
|
|
|
|
|
|
0 5 10 15 20 25 30
Time,Времяdays, сут
Fig. 9. Кinetics of an increase in the strength of the cement rock samples with the water content of 10 % formed under the load of 20 МPа
49
Предел прочности при сжатии, Compressive strengthМПа limit, MPa
Russian Journal of Building Construction and Architecture
12 |
|
|
|
|
|
|
|
|
|
|
23 |
|
|
|
|
|
|
|
|
|
|
|
|
|
|
|
|
|
|
||
10 |
|
|
|
|
|
|
|||||||||
|
|
|
|
|
1 0 % КД |
||||||||||
|
|||||||||||||||
|
4 |
|
|
|
1––0 % СА |
||||||||||
8 |
|
|
|
|
|
|
1 |
|
|
|
|
|
22––0,05.05%%КДСА |
||
|
|
|
|
|
|
|
|
|
|
||||||
|
|
|
|
|
|
|
|
|
|
||||||
|
|
|
|
|
|
|
|
|
|
|
3 % КД |
||||
|
|
|
|
|
|
|
|
||||||||
|
|
|
|
|
|
|
6 |
|
|
|
3––0,1.1 % СА |
||||
6 |
|
|
|
|
|
44––0,5.5%%КДСА |
|||||||||
|
|
|
|
|
|
|
|
|
|
|
|
|
|
||
|
|
|
|
|
|
|
|
|
|
|
|
|
|
|
5 1 % КД |
|
|
|
|
|
|
|
|
|
|
|
|
|
|
|
|
|
|
|
|
|
|
|
|
|
|
|
|
||||
4 |
|
|
|
|
|
|
|
|
|
|
|
|
|
|
5––1 % СА |
|
|
|
|
|
|
|
|
|
|
|
|
|
|
6––22%%КДСА |
|
2 |
|
|
|
|
|
|
|
|
5 |
|
|
|
|
|
|
|
|
|
|
|
|
|
|
|
|
||||||
|
|
|
|
|
|
|
|
||||||||
|
|
|
|
|
|
|
|
||||||||
0 |
|
|
|
|
|
|
|
|
|
|
|
|
|
|
|
|
|
|
|
|
|
|
|
|
|
|
|
|
|
|
|
|
|
|
|
|
|
|
|
|
|
|
|
|
|
|
|
0 5 10 15 20 25 30
ВремяTime, days, сут
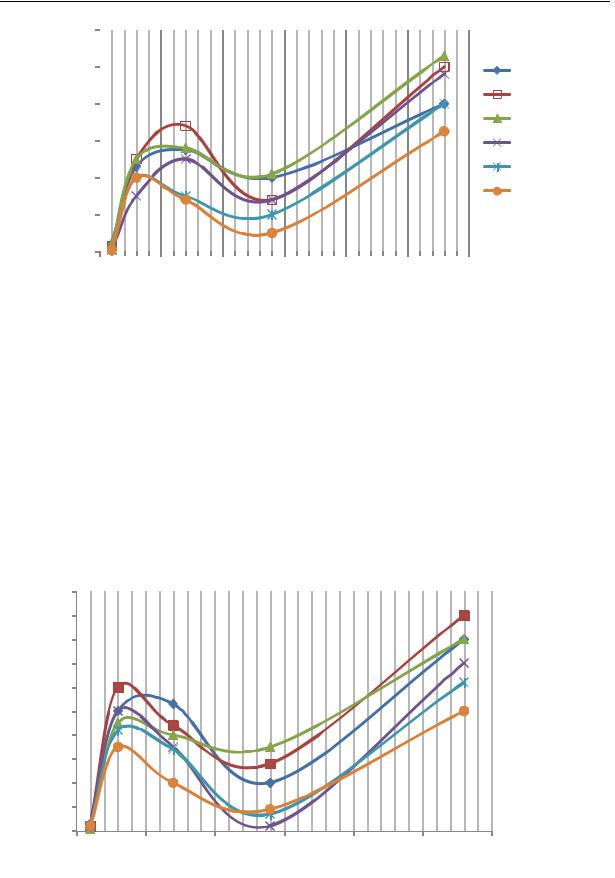
Fig. 10. Кinetics of an increase in the strength of the cement soil samples with the water content of 17 % and PC 10 % formed under the load of 10 МPа
From day 3 to day 7 solidification slowed down in the samples of the compositions 5 and 6, the strength of the remaining samples did not change. On day 14 there was a significant drop by 1.5––2 times in the strength of the smaples of all the compositions as well as a sharp rise on day 28. Hence the strength of the samples was 10, 10.6, 9.6, 8 and 6.5 МPа with 0.05, 0.1, 0.5, 1 and 2 % of CA with the strength of the samples being 8 МPа.
A similar thing holds true for the tests of the samples formed at 20 МPа where the introduction of CA has no effect on the daily strength.
Compressive strength limit, MPa
 1––0 % СА
 2––0.05 % СА
 3––0.1 % СА
 4––0.5 % СА
 5––1 % СА
  6––2 % СА
Time, days
Fig. 11. Кinetics of an increase in the strength of the cement soil samples with the water content of 17 % and PC of 10 % formed under the laod of 20 MPa
50