

3513
.pdfIssue № 3 (39), 2018 |
ISSN 2542-0526 |
According to that collected data of radiation for above statistics period was related to total radiation and also obtained as daily average in Kermanshah meteorological station, and the amount of direct and scattered radiation received on the surface is not available, therefore, Watanabe or other valid methods can be used to calculate these values. In this study due to the unavailability of direct and scattered radiation values, Watanabe method –– which was provided for Japan climates –– has been used to calculate these data [24]. To validate the calculations, actual total radiation amounts collected by Pyranometer of Kermanshah meteorological station were compared with total radiation values estimated by Watanabe method. It should be noted that according to extensive studies conducted by Iranian researchers in this field, direct radiation value calculated by this method are compared to measured results of other Iran cities, and satisfactory results have been obtained.
In this study, according to that the measured data of total radiation received by the horizontal surface is available as daily average; these data were converted to hourly radiation data by using the following method.
a) Calculating the amount of radiation received to the surface from the perpendicular direction (Gen) as hourly. Following equation is used to calculate the amount of radiation received to the surface from the perpendicular direction on a daily basis:
|
1.00011 0.034221 0.00128 0.000719 2 |
|||
|
0.000077 2 , |
|
|
1 |
|
|
6.283185 |
365 |
, |
where Gsc is solar constant and equal to 1367W / m2 (n is the number of days from the January first).
b) Solar radiation received to horizontal surface outside the atmosphere (Geh)Geh is calculated by using the zenith angle (θz) and the following equation: { }. The zenith angle is the angle between the sun rays and perpendicular to the horizon in radians which is calculated by using the following equation (by spherical trigonometry in degree):
|
|
. |
, δ and ω are latitude, deviation angle and hour angle respectively. c) Total solar radiation received on a horizontal surface on Earth (Gh).
To calculate the Gh, first, the actual amount of the monthly clearance coefficient is calculated by having actual measured data for solar radiation from meteorological station. The hourly
21

Russian Journal of Building Construction and Architecture
clearance coefficient is calculated with the actual amount of monthly clearance coefficient, by using Duffie method that will explain in the following [13], then by having the clearance coefficient, the amount of solar radiation received on a horizontal surface is calculated on an hourly basis. It should be noted that there is a need for total solar radiation on a horizontal surface per day in the Sandia method for the each year of the entire statistical period. So the daily total amount of solar radiation received on a horizontal surface is calculated for each year by using monthly radiation data and Duffie method, and Sandia method is used to select the appropriate month. After the selection of appropriate month, solar radiation received on surface is selected by Sandia method and placed to the TMY data as hourly form. Air clearance coefficient in any point of the earth with the given latitude and longitude is as the ratio of intake energy by the horizontal plane at the same point during a given time (daily, monthly or hourly) to the amount of radiation received on the same horizontal plane during at the same time, if the point is located outside the Earth's atmosphere. Air clearance coefficient can be calculated for any day, hour or month:
{ }.
In this equation, Gh and Geh are the total radiation received on the Earth's horizontal surface and the total radiation received on the horizontal surface outside the Earth's atmosphere, respectively. If the air clearance coefficient and Geh calculate correctly, it can be said that the amount of radiation received on the horizontal surface at Earth will also calculate correctly. Duffie in 1980 had offered following equation to calculate the hourly amount of the clearance coefficient from its monthly amount.
|
|
|
|
|
|
|
|
12 |
, |
|
0.409 |
12 |
60 , |
|
0.5016 |
||||
|
0.06609 |
0.4767 |
60 . |
|
H and ωs represent time in hours and the hour angle for sunrise or sunset, respectively (in this equation (ωs – 60) must be converted to radians).
d) Solar direct radiation received on the surface in the perpendicular direction at the earth surface (Gbn).
If the value of direct radiation on a horizontal plane is determined, Gbn is calculated by using the following equation:
{ |
|
}. |
22
Issue № 3 (39), 2018 |
ISSN 2542-0526 |
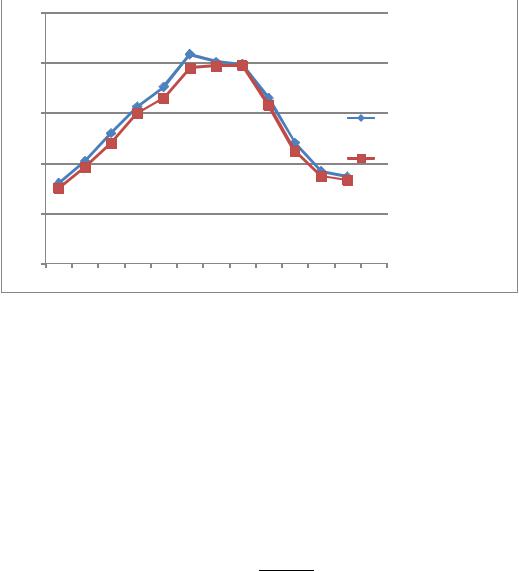
In this equation, the zenith angle is in radians. If the value of direct and scattered radiation received on the horizontal surface is not available, Watanabe method or other valid methods can be used to calculate it. In this study due to the unavailability of direct and scattered radiation, Watanabe method –– which is provided for Japan climates –– has been used to calculate these data. In extensive studies that have been done in this field as well as previous studies of some researchers, calculated Gh amount by this method and measured results for different cities of Iran were compared and satisfactory results have been obtained. In comparative chart 1––4, values of the total radiation calculated based on Watanabe method are compared with the actual total radiation statistics of Pyranometer at Kermanshah airport station for the period (2005––2015), and as indicated in the chart, it shows good agreement with the actual statistics especially in the second half of the year.
Chart. 1. Comparative chart of total radiation (in watts per square meter) based on the actual statistics of Pyranometer Kermanshah airport aerology station and total calculated radiation based
on Watanabe method during (2005––2015)
In this part, the direct radiation is calculated by using Watanabe method and the following formula in (W/m2).
|
|
|
0.4268 |
|
0.1934 , |
, |
|
, |
|||
1.107 0.03569 |
|
1.681 |
1 |
||||||||
|
|
3.9963.862 |
1.54 |
|
, |
|
, |
|
|||
|
|
|
|
|
1 |
|
. |
|
|
|
|
|
|
1 |
|
|
|
|
|||||
23
Russian Journal of Building Construction and Architecture
Gbh direct radiation, Kth air clearance coefficient as hourly and α s is pitch angle in radians. e) Solar scattered radiation received on a horizontal plane on the earth (Gdh). The scattered radiation rate in Watanabe method is calculated by the following formula in (W/m2) Gbh direct radiation, Kth air clearance coefficient as hourly and α s is pitch angle in radians. As mentioned before, the data about the wind direction and speed during the period (2005–– 2015) in Kermanshah aerology station were placed into TMY file every three hours.
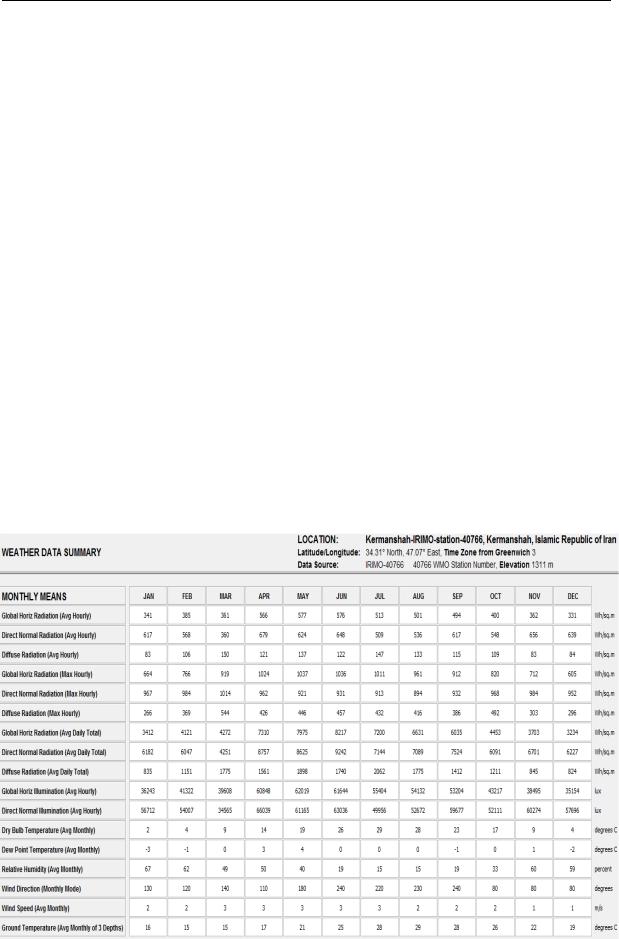
4. Validation of climatic factors in Kermanshah according to TMY file. In this section, first, the TMY file for Kermanshah was produced by using the Meteonorm software [23] to check validation of TMY file which provided in the previous step by Sandia method, then the profile of above TMY file outputs under the Climate Consultant software were compared with TMY outputs provided in this thesis by Sandia method both of which have the same period (2005––2015). The results of the three main parameters including dry air temperature, relative humidity and wind direction were compared with actual profile of the above three parameters in Kermanshah aerology station; thus the rate of closeness to actual statistics indicates the validation of each of the relevant TMY files.
Table 2
Summary of weather data in Kermanshah on the basis of TMY file provided by Sandia
24
Issue № 3 (39), 2018 |
ISSN 2542-0526 |
Table 3
Summary of weather data in Kermanshah based on TMY file provided by using the Meteonorm software
Tables 2 and table 3 shows the summary of weather data in Kermanshah airport aerology station during the period (2005––2015) according to the TMY file provided by Sandia and based on TMY file provided by using the Meteonorm software based on output of climate consultant software, respectively.
Chart. 2. Comparative chart of monthly average of dry temperature from output of Sandia, Meteonorm and actual statistics of Kermanshah weather station during (2005––2015)
25
Russian Journal of Building Construction and Architecture
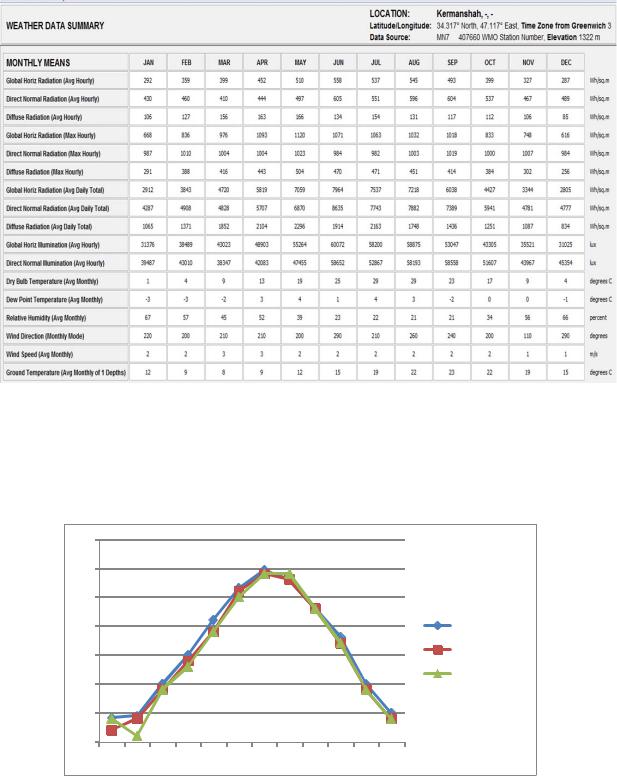
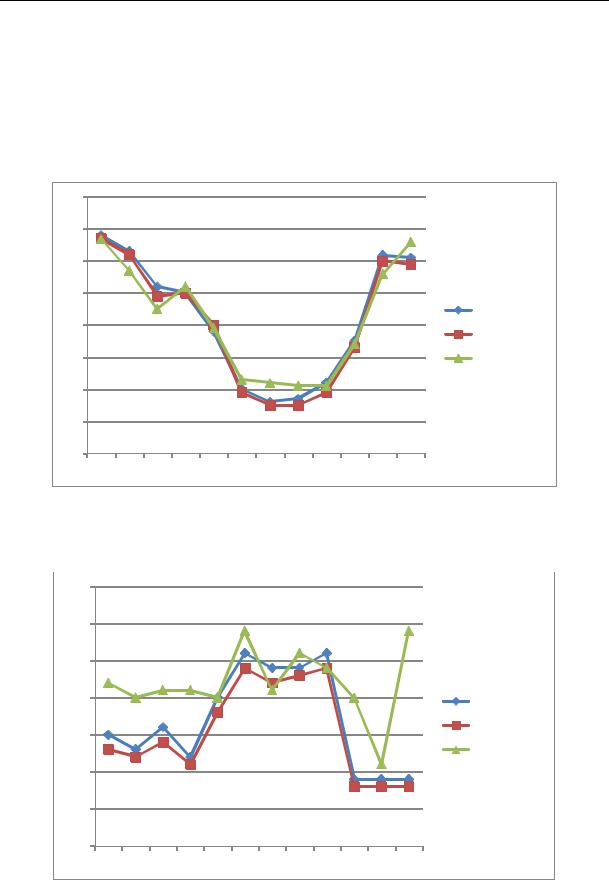
To validate the TMY file provided by Sandia method in this thesis, three main parameters including dry air temperature, relative humidity and wind speed and direction of each of TMY files which presented as monthly average were compared with actual monthly average of above three parameters statistics during the same period in Kermanshah aerology station, and the results can be verified in comparative diagrams of 2 and 3 and 4.
Chart. 3. Comparative chart of monthly average of relative humidity from output of Sandia, Meteonorm and actual statistics of Kermanshah weather station during (2005––2015)
Chart. 4. Comparative chart of monthly average of wind direction from output of Sandia, Meteonorm and actual statistics of Kermanshah weather station during (2005––2015)
26
Issue № 3 (39), 2018 |
ISSN 2542-0526 |
As it is clear in comparative charts of 2, 3 and 4, most conformity of three main parameters of TMY file with actual statistics of Kermanshah weather station during the period (2015––2005) has been observed in outputs of TMY file provided by Sandia in the study, this suggests the accuracy of the method for providing the file and its credit.
5. Analysis of Bioclimatic (psychometric) graph for Kermanshah City. There is need to draw the data about temperature, the monthly minimum and maximum of relative humidity on the graph because of selecting the building bioclimatic comfort criteria for analyzing the weather state of site. For this purpose, the temperature and humidity of hottest and coldest time of a day of each month is determined on the graph. The connection of two points, by a straight line, that is related to the day and night condition of each month shows the situation of the month on the Givoni building bioclimatic criteria. Crossing the line from different parts of the graph represents the all-day conditions of the month. Obviously, in situations where there is a short line and passes through fewer regions, it represents the thermal conditions fixity in a day. In contrast, the long line and passing through different parts of the graph represents the diversity of thermal conditions during a day and night and consequently there is a need to various spaces with different micro-climates to accommodate climatic conditions.
Chart 5 shows the building bioclimatic (psychometric) graph of Kermanshah weather station based on TMY file provided in previous steps and by using graphic outputs of climate consultant software. As mentioned in the previous sections, the data of Kermanshah synoptic station including dry temperature, relative humidity, total and direct solar radiation, and wind direction and speed were been used as hourly form and over the period of 10 years (2005–– 2015); After converting the above data to TMY file by Sandia method and the validation in the previous steps, in this section, climatic parameters listed in the climate consultant software extracted graphically, and then analyzed and compared with other available climate indicators such as Givoni thermal comfort models according to the country climatic zoning studies to specify the variation of climatic trends and thermal comfort requirements in Kermanshah than previous studies. According to the results obtained in psychometric charts in Kermanshah, generally comfort conditions have not significant difference compared to other models such as Givoni model which prepared based on the country climatic zoning map shown in the chart 5, and as it can be seen in the chart, thermal comfort conditions are established in the city of Kermanshah more than 17 % of the year. But just partially in January, at days the use of active solar systems and at night the use of heaters and exothermic mechanical systems is required to provide comfort within building. In February and December, at days for a sense of
27

Russian Journal of Building Construction and Architecture
comfort the use of passive solar systems is needed, also at nights of these months Kermanshah is seen in the area of conventional heating where there is a need to use heaters. In March, April and November, during the day internal heat and at night using a conventional heating system for April and active solar systems for the March and November provides comfort conditions inside the building. In May and October, comfort conditions are provided in the natural way, at night the use of passive solar systems is effective (the use of capacitor materials and solar spaces based on the received solar radiation and absorb and store heat in the building during the day, and excrete the heat into inside at night). June, July, August and September are the warmest period in the city of Kermanshah and in these months due to high temperature, the relative humidity is low thus thermal comfort conditions is not desirable, and a sense of comfort in buildings is require to supply humidity inside the buildings which this can be done by the water cooler; also indoor air can be in the comfort zone by using suitable construction material properties to the climatic conditions, therefore, we should prevent the entry of hot air into the building by selecting and using heavy and heat-resistant materials which have the maximum delay time as well. In September, the use of passive solar system is also useful at night.
Chart. 5. Bioclimatic chart (psychometric) of Kermanshah based on the Kermanshah TMY file from the graphical outputs of climate consultant software
28

Issue № 3 (39), 2018 |
ISSN 2542-0526 |
Chart. 6. Building bioclimatic chart of Kermanshah by using Givoni method from Iran climatic zoning (housing and residential environments)
Fig. 2. Iran climatic zoning (housing and residential environment)
6. Conclusion. Table 4 compares bioclimatic chart of Kermanshah based on the country climatic zoning studies during the period (1966––1982) with psychometrics chart of Ker-
29

Russian Journal of Building Construction and Architecture
manshah in accordance with TMY file provided in Kermanshah aerology station at previous steps and graphic output of climate consultant software during the period (2005––2015). This means that first it determined the range of time when comfort conditions have been established in the natural way or by using heating or cooling systems on the basis of climatic zoning map. Then we addressed to complete this information by using psychometric table of climate consultant software which was set for all months of the year. The sum of the maximum predicted values in the above charts is shown at the rows of the table. As it is clear according to the values, generally, despite an increase in the comfort conditions range in the city of Kermanshah in recent years, the need for mechanical heating and mechanical cooling are reduced and increased, respectively which represents that Kermanshah becomes warmer than previous years.
Table 4
Comparing the range of heat required in Kermanshah based on two climatic zoning maps (Givony chart) and psychometric chart based on the TMY file
|
|
Title |
Climatic zoning map |
TMY file |
|
|
|
(Givoni chart)(Percent) |
(Percent) |
||
|
|
|
|
||
|
|
|
|
|
|
|
Comfort conditions as naturally |
5––10 |
17.6 |
||
|
|
|
|
|
|
Heating |
|
Mechanical systems |
35––40 |
17.7 |
|
|
|
|
|
|
|
|
|
Solar Energy |
20––25 |
22.4 |
|
|
|
|
|||
|
|
|
|
|
|
|
|
|
Creating the storm at |
–– |
4.7 |
|
|
|
indoors |
||
|
Natural |
|
|
|
|
|
|
|
|
|
|
|
|
The use of heavy |
5––10 |
10.3 |
|
|
|
|
|||
Cooling |
|
|
construction materials |
||
|
|
|
|
||
|
|
|
|
|
|
|
Mechanical |
Water Cooler |
0––5 |
16.4 |
|
|
|
|
|
||
|
Air-conditioners |
–– |
–– |
||
|
|
|
|||
|
|
|
|
|
|
|
Total Including overlapping |
90 |
89.1 |
||
|
|
|
|
|
|
References
1.ASHRAE. Weather year for energy calculationsp, ASHRAE research project, American Society of Heating, Refrigerating and Air-Conditioning Engineers Inc, 1985.
2.ASHRAE. International weather for energy calculations (IWEC Weather Files) User_s Manualp, Version 1.1, 2002.
3.Chan. L. S, Chow T. T., Fong K. F. and Lin J. Z. Generation of a typical meteorological year for Hong Kong,
Energy Conversion and management; vol. 47, 2006, pp. 87––96.
30