

3513
.pdfIssue № 3 (39), 2018 |
ISSN 2542-0526 |
that the structure of a designed system and its imitation model are already identified and the parameters of the elements have a metric expression.
|
|
|
|
|
|
Technical task |
|
|
|
|
|
|
|
|
|
|
||||
|
|
|
|
|
|
|
|
|
|
|
|
|
|
|
|
|
|
|
|
|
|
|
|
|
|
|
|
|
|
|
|
|
|
|
|
|
|
|
|
|
|
|
|
|
|
|
|
|
|
|
|
|
|
|
|
|
|
|
Serviced technology |
|
|
|
|
|
Functional purpose |
|
Operating conditions |
|
|
|
|||||||||||||
|
|
|
|
|
|
|
|
|
|
|
|
|
|
|
|
(for industrial buildings) |
|
|
||
|
|
|
|
|
|
|
|
|
|
|
|
|
|
|||||||
|
|
|
|
|
|
|
|
|
|
|
|
|
|
|
|
|
|
|
||
|
Formation of the structure |
|
|
Imitation model |
|
|
|
|
|
|
|
Synthesis criteria. |
|
|
||||||
|
|
of an object |
|
|
|
of an object |
|
|
|
|
|
|
|
Restrictions |
|
|
||||
|
|
|
|
|
|
|
|
|
|
|
|
|
|
|
|
|
|
|
|
|
|
|
|
|
|
|
|
|
|
|
|
|
|
|
|
|
|
|
|
|
|
|
|
|
|
|
|
|
|
|
|
|
|
|
||||||||
|
|
|
|
|
|
|
|
Analysis based on the |
|
|
||||||||||
|
Changing the structure |
|
|
|
|
|||||||||||||||
|
|
|
|
|
|
|
|
|
criteria, restrictions |
|
|
|
||||||||
|
|
|
|
|
|
|
|
|
|
|
|
|
|
|
|
|||||
|
|
|
|
|
|
|
|
|
|
|
|
|
|
|
||||||
|
|
|
|
|
Changing the |
|
|
No |
|
Yes |
|
|
||||||||
|
|
|
|
|
|
|
|
|
|
|
|
|
|
|
|
Designing solution |
|
|
||
|
|
|
|
|
|
|
|
|
|
|
|
|
|
|
|
|
|
|||
|
|
|
|
|
parameters |
|
|
|
|
|
|
|
|
|
|
|
|
|
|
|
No
Fig. 2. Generalized designing scheme
It is challenging to synthesize a structure as it is up to an engineer to choose a parameter and its range. It has to be done correctly in order for the synthesized structures to differ and a range of possible solutions to be wider and then it might be that the more options are synthesized, the more effective of the solutions turns out to be.
A complex designing object consists of a set of structures, elements and engineering systems with each to be designed individually. In some cases a structure can be automated due to an identified and homogeneous original residual structure [8, 10]. It is not the case for e.g., formation of the layout of an industrial building whose elements (structures) are significantly heterogeneous systems. Designing is systemic and its main purpose is to test and connect the solutions of individual structures with a general layout. Due to heterogeneity and high dimensionality of search spaces, it is necessary to decompose a complex task into individual local iteration procedures. They are joined into a structure according to certain rules that are frequently informal. An engineer’s experience and expertise are utilized in dealing with such tasks.
11

Russian Journal of Building Construction and Architecture
Conclusions. Based on the above schemes, a computational tool will be developed for synthesis of designing solutions as well as their visualization and possibly comparison and analysis. Development of corresponding packages for the computational tool that was previously developed by the author [2, 9] is capable of enhancing functionality of an information technology of supporting search of designing solutions. Another opportunity of improving productivity of the method is to use genetic algorithms for synthesizing the structure of a designed object. Therefore the author is currently developing and testing the corresponding tools.
References
1.Boldyrev A. M., Sventikov A. A. Primenenie metodov parametricheskoi optimizatsii pri issledovanii visyachikh konstruktsii s peremennoi raschetnoi skhemoi [Application of parametric optimization methods in the study of hanging structures with variable design scheme]. Metallicheskie konstruktsii, 2008, vol. 14, no. 4, pp. 263—268.
2.Vasil'kin A. A. Informatsionnaya tekhnologiya avtomatizatsii podderzhki poiska proektnykh reshenii stal'nykh konstruktsii [Information technology automation support search design solutions of steel structures].
Promyshlennoe i grazhdanskoe stroitel'stvo, 2016, no. 5, pp. 76—80.
3.Vermishev Yu. Kh. Metody avtomaticheskogo poiska reshenii pri proektirovanii slozhnykh tekhnicheskikh sistem [Methods of automatic search of solutions in the design of complex technical systems]. Moscow, Radio i svyaz' Publ., 1982. 152 p.
4.Ginzburg A. V., Lobyreva Ya. A., Semernin D. A. Cistemnyi podkhod pri sozdanii kompleksnykh avtomatizirovannykh sistem upravleniya i proektirovaniya v stroitel'stve [System approach to the creation of complex automated control and design systems in construction]. Nauchnoe obozrenie, 2015, no. 16, pp. 461—464.
5.Dzhons Dzh. Inzhenernoe i khudozhestvennoe proektirovanie : per. s angl. [Engineering and art design: translation from English]. Moscow, Mir Publ., 1976. 374 p.
6.Dmitrienko D. V. Parametricheskaya optimizatsiya elementov konstruktsii portovykh pere-gruzochnykh mashin [Parametric optimization of structural elements of port transshipment machines]. Vestnik Gosudarstvennogo universiteta morskogo i rechnogo flota im. admirala S. O. Makarova, 2017, vol. 9, no. 3, pp. 655—662.
7.Erokhin A. P. Primenenie parametricheskikh modelei v avtomatizirovannom proektirovanii aviatsionnykh konstruktsii [The use of parametric models in the computer-aided design of aircraft structures]. Novoe slovo v nauke i praktike: gipotezy i aprobatsiya re-zul'tatov issledovanii, 2013, no. 6, pp. 95—99.
8.Zaporozhets D. Yu., Ksalov A. M., Pshenokova I. A. Algoritm resheniya zadachi parametricheskoi optimizatsii na osnove meto-dov bakterial'noi optimizatsii [Algorithm for solving the problem of parametric optimization based on bacterial optimization methods]. Informatika, vychislitel'naya tekhnika i inzhenernoe obrazovanie, 2016, no. 1 (25), pp. 14—26.
9.Ibragimov A. M., Vasil'kin A. A. Avtomatizirovannoe reshenie proektnykh zadach komponovki ob"emnoplanirovochnogo resheniya skladskikh sooruzhenii. Ch. 1. Postanovka zadaniya [Automated solution of design
12
Issue № 3 (39), 2018 |
ISSN 2542-0526 |
problems of layout of space-planning solutions of storage facilities. Part 1. Setting the task]. Nauchnoe obozrenie, 2016, no. 13, pp. 32—36.
10.Karpenko A. P., Gadzhiev S. A. [A modified particle swarm optimization algorithm in the problem of parametric optimization of design solutions]. Trudy XVI Mezhdunarodnoi molodezhnoi konferentsii «Sistemy proektirovaniya, tekhnologicheskoi podgotovki proizvodstva i upravleniya etapami zhiznennogo tsikla promyshlennogo produkta (SAD/CAM/PDM — 2016)» [Proc. of the XVI international youth conference «Systems of design, technological preparation of production and management of stages of the life cycle of an industrial product (SAD/CAM / PDM-2016)»]. Moscow, 2016, pp. 421—425.
11.Kirsanov M. N. Geneticheskii algoritm optimizatsii sterzhnevykh sistem [Genetic algorithm for optimization of rod systems]. Stroitel'naya mekhanika i raschet sooruzhenii, 2010, no. 2, pp. 60—63.
12.Kostin V. E., Tyshkevich V. N., Sarazov A. V., Sin'kov A. V., Belukha V. F. Raschet i proektirovanie mekhanicheskikh peredach s ispol'zovaniem sistem av-tomatizirovannogo proektirovaniya [Calculation and design of mechanical transmission using computer-aided design]. Mezhdunarodnyi zhurnal eksperimental'nogo obrazovaniya, 2012, no. 4—1, pp. 96—97.
13.Panchukov N. A. Ob odnom vide prostranstvennoi konstruktsii i osobennostyakh ee ispol'zovaniya cherez informatsionnoe modelirovanie [About one type of spatial design and features of its use through information modeling]. Izvestiya vuzov. Stroitel'stvo, 2015, no. 6, pp. 63—73.
14.Sobolev Yu. V., Vasil'kin A. A., Koloskov A. D. Opredelenie napryazhenno-deformirovannogo sostoyaniya stenki s geometricheskimi defektami v oblasti montazhnogo styka chislennymi metodami [Determination of the stress-strain state of the wall with geometric defects in the field of the Assembly joint by numerical methods].
Promyshlennoe i grazhdanskoe stroitel'stvo, 2005, no. 12, pp. 44—45.
15.Tamrazyan A. G., Filimonova E. A. Optimal'noe proektirovanie zhelezobetonnykh plit perekrytii po kriteriyu minimal'noi stoimosti [Optimal design of reinforced concrete slabs according to the minimum cost criterion]. Sovremennye problemy rascheta zhelezobetonnykh konstruktsii, zdanii i sooruzhenii na avariinye vozdeistviya, 2016, pp. 424—433.
16.Tumenova I. M. Parametricheskaya optimizatsiya trapetsievidnoi derevyannoi fermy s voskhodyashchimi raskosami na metallicheskikh zubchatykh plastinakh [Parametric optimization of a trapezoidal wooden farm with upward braces of metal gear plates]. Inzhenernyi vestnik Dona, 2017, vol. 45, no. 2 (45), p. 131.
17.Shteinbrekher O. A., Burnysheva T. V. Reshenie zadachi parametricheskoi optimizatsii setchatoi tsilindricheskoi konstruktsii [Solution of the parametric optimization problem of a mesh cylindrical structure].
Inzhenernyi zhurnal: nauka i innovatsii, 2017, no. 10 (70), p. 2.
18.Brown N., Oliveira J. I. F. de, Ochsendorf J., Mueller C. Early-stage integration of architectural and structural performance in a parametric multi-objective design tool. Structures and Architecture. Proc. of the 3rd Interna-
tional Conference on Structures and Architecture, ICSA—2016, 27—29 July. Guimarães, Portugal, 2016, pp. 1103—1111.
19.Brown Nathan C., Mueller Caitlin T. Design for structural and energy performance of long span buildings using geometric multi-objective optimization. Energy and Buildings, 2016, vol. 127, pp. 748—761.
20.Arruda Edilson F., Ourique Fabrício, Almudevar Anthony, Silva Ricardo C. On cost based algorithm selection for problem solving. American Journal of Operations Research, 2013, no 3, pp. 431—438. Available at: http://dx.doi.org/10.4236/ajor.2013.35041
13

Russian Journal of Building Construction and Architecture
21. McCall J. Genetic algorithms for modelling and optimization. Journal of Computational and Applied Mathematics, 2005, vol. 184, iss. 1, pp. 205—222. Available at: https://doi.org/10.1016/j.cam.2004.07.034
22. Rajeev S., Krishnamoorthy C. Genetic algorithms-based methodologies for design optimization of trusses. J. Struct. Eng., 1997, no. 123, pp. 350—359.
23.Vahid Faghihi, Reinschmidt Kenneth F., Kang Julian H. Construction scheduling using Genetic Algorithm based on Building Information Model. Expert Systems with Applications, 2014, vol. 41, iss. 16, pp. 7565— 7578.
24.Volkov A. A., Vasilkin A. A. Оptimal design of the steel structure by the sequence of partial optimization. Procedia Engineering, 2016, vol. 153, pp. 850—855.
25.Wilde D. J. Globally optimal design. Wiley, New York, 1978. 288 р.
14

Issue № 3 (39), 2018 |
ISSN 2542-0526 |
HEAT AND GAS SUPPLY,VENTILATION,
AIR CONDITIONING,GAS SUPPLY AND ILLUMINATION
UDC 697.1
Mohammad Mahdi Moqhadasi1, Shahin Heidari*2, Azadeh Shahcheraghi3
GENERATION AND VALIDATION OF TYPICAL METEOROLOGICAL YEAR (TMY) TO ANALYSIS THE PSYCHOMETRIC CHART TO EVALUATE THE THERMAL COMFORT CONDITIONS IN BUILDINGS
(CASE STUDY: KERMANSHAH, IRAN)
Islamic Azad University
Tehran, Iran, tel: (+98)21-44868540, e-mail: M3line@yahoo.com
1PhD Candidate of architecture, Department of architecture, Science and Research Branch 3Associate Prof. of architecture, Department of architecture,Science and Research Branch
University of Tehran
Tehran, Iran, e-mail: M3line@yahoo.com 2Prof. of architecture, Department of architecture
Statement of the problem. Exact selecting the climatic data is an important and infrastructure factor for computing and simulating the energy consumption in buildings. In this study by using Sandia method which is a statistical method, TMY sample data of weather as a climatic file of real measured data for a period of 10 years (2005 to 2015) were produced for synoptic aerology stations of Kermanshah airport. The data are generated by using the Meteonorm software in order to validation, and the results of Sandia and output data of this software has been compared with average values of real three main climatic data including temperature, relative humidity and wind direction in the period to prepare TMY.
Results. The results show that the Sandia method has better compliance with the actual data of synoptic aerology station of Kermanshah airport while the TMY data of Meteonorm software have not good agreement with data which obtained from the mean of whole period.
Conclusions. checking out the graph of thermal comfort (psychometric) from the output of climate consultant software for Kermanshah city that drawn by using the TMY prepared with Sandia methodin this reaserch, shows that 17 percent of the time in terms of thermal comfort has been established in the city of Kermanshah but the overall condition of climate is becoming warmer.
Keywords: thermal comfort, Typical Meteorological Year, building energy simulation, energy consumption.
Introduction. The existence of climate data of the study area with the maximum proximity rate to the climate reality of that area is one of the most important conditions of validity for any simulation in the field of building energy. Climatic conditions in outdoors throughout the
© Mohammad Mahdi Moqhadasi, Shahin Heidari, Azadeh Shahcheraghi, 2018
15

Russian Journal of Building Construction and Architecture
year are an important part of desirable and intended data which is provided on an hourly basis for the whole year. To simulate the exchange of energy in buildings usually 10 to 13 climatic parameters (such as solar radiation, temperature, humidity rate and altitude, speed and direction of the wind and pressure) are needed. These climate data should not be on average per year or only for the part of year but also should be determined on a daily basis and for total 8760 hours of a year [3, 5, 6]. Several studies were conducted by the researchers to provide TMY data for different parts of the world. From 1970 to 1983, ASHRAE conducted three RP projects 100, 239 and 364 for providing weather data and provided the new plan called TRE; these data in simulation are known as WYEC and have the same format to TRE. The difference between them is that the solar radiation data (measure or calculate on the basis of cloud and its type) are also available in the new one. In early 1990, ASHRAE updated WYEC data and presented its new version that has the TMY format and also calculated data of brightness. The next updates are involved to calculate radiation data. The updated version of the WYEC is known as WYEC 2 (version 2) and 77 versions have created until now. In 1997, ASHRAE made another project called RP to develop worldly WYEC; this project has been completed in 2001 and its weather data were obtained for 227 stations in America and Europe [1, 2]. The type of data file in different softwares of course is different. For example, the Plus Energy Program data accepts input data in the form of EPW [4]. Some of the most important formats used in simulation programs include: TMY, TRY, DET. Thus, preparation of climatic data banks in different cities of Iran seems necessary for accurate estimation of energy consumption in buildings. In this study, weather data generated and compared with the format of TMY by Sandia method and Meteonorm software in Kermanshah city. According to the actual average data of the synoptic stations in Kermanshah for a 10-years statistical period (2005––2015), results were compared with the real data mean of three main parameters including drying temperature, relative humidity and wind direction, and the above TMY file have been validated.
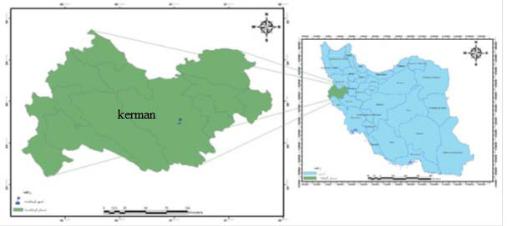
1. Introducing the case study. Kermanshah city with a height of 1318.6 meters above sea level is located at 34 degrees, 23 minutes northern latitude and 47 degrees eastern longitude in the center of Kermanshah province and it is known as the center of Kermanshah province. Kermanshah is located in West of Iran and it neighbors from the north with Kurdistan province, from the East with Hamadan province, from the South and the South-East with Ilam and Lorestan provinces, and from the West with Iraq. A climatic region of Kermanshah is classified into cold and mountainous according to Kasmaee and his colleagues’ climate
16
Issue № 3 (39), 2018 |
ISSN 2542-0526 |
division. The average annual temperature and precipitation of Kermanshah is 14.3 °C and 445 mm respectively Fig. 1 shows the location of the study area in Iran.
Fig. 1. The location of the study area in Iran
2. Sandia method. Some comprehensive information on meteorological data of the study area should collect before any software simulation in the field of energy. These data must be prepared and processed hourly in the whole of year in order to increase the accuracy and reliability of any simulation. To simulate building energy usually nine to thirteen climatic parameters such as temperature, humidity, solar radiation, barometric pressure, wind speed and direction and altitude and etc. are more important; these data should not be determined for a part of the year or as an annual average but must daily and for total 8760 hours a year [14]. The measured data for each of the months is selected out of the measured data in a few years (the statistical period). For each 12 months of the statistical year, five main climatic characteristics are selected by studying measured data which are: total solar radiation, solar direct radiation, dry air temperature, dew point temperature or (relative humidity) for availability as well as wind speed. The correct selection of these data is critical for the accuracy of TMY file. Statistical monthly average can be also used for other required data [7, 8, 9, 10, 11, 12].
Sandia method usually is used to provide the required data for the TMY files from the measured climatic data. Sandia is experimental method which selects the data for each of the year months from the measured data in several years [16, 17]. For example, if 30-years data are available for June, all information will compared by using a statistical method and the data for a month out of the entire period is selected as data for June to create TMY file, and it goes
17

Russian Journal of Building Construction and Architecture
on for other months. Since it is possible that data related to different years is used to create TMY, between two consecutive months which have been selected from different years, matching process is conducted for 6 hours from each side. In Sandia method, each of the months of the year is selected on the basis of the 9 daily parameters (maximum, minimum and average of air temperature, dew point temperature, maximum and average of wind speed and the total amount of radiation received by a horizontal plane). The procedure steps will explain in the following: The first step: for each of the months of the year, five months are selected out of the statistics of the long-term period years (e.g. 30 years) in which cumulative distribution function of their daily indexes is closer to the cumulative distribution function of the intended month in the statistical long-term period. For each month of the statistical longterm period, cumulative distribution function is calculated on a daily basis for each of the above nine parameters as well as for the entire period. The method of calculating the cumulative distribution function is as follows:
S x |
0 |
x |
x |
k 0.5 ⁄n , |
x x |
x , |
|
|
1 |
x |
x |
where X variable of climatic data (nine data), Sn (X) the value of cumulative distribution function for the x variable, n number of elements and k is equal to 1, 2, 3, ..., n – 1 (cumulative distribution function value is between 0 and 1). Comparing the cumulative distribution functions of selected months and statistical long-term period is done by using FS2 statistical method. The selection is the results of other steps which are described below. It should be noted that since some indicators are more important than others, the weight factor (ws) is used in FS method to select the five months and we have:
{ |
1⁄ ∑ |
}. |
Where is absolute value of the difference between the total cumulative distribution function and cumulative distribution function of the period for parameter in one day and n is the number of days in the month. So the FS value is calculated for each month of different years by this equation.
The second step: since some indicators are more important than others, the weight factor (ws) is used as follows:
{ |
∑ }, |
where and i are weight factor for the parameter and index for nine parameters respectively.
18
Issue № 3 (39), 2018 |
ISSN 2542-0526 |
Now, for every month from different years, the month which has the lowest WS select as elected month (five months) to compare.
The third step: five selected months are sorting depending on how close (compliance) to the GPA and average of statistical long-term period.
The fourth step: the durability of two parameters of drying temperature average and approved energy on horizontal surfaces is evaluated based on how much higher or lower the percentage of their repeat and adaptation is, in comparison of the percentage of statistical long-term period. For the dry temperature daily average, repeat and adaptation of hot consecutive days and cold consecutive days are determined more than 67 percent and less than 33 % respectively. For approved energy on horizontal surfaces, repeat and adaptation is determined less than 33 % (consecutive days with low solar energy). Determined percentages is used for selecting the most appropriate years out of the five years (for the month statistics) to use in TMY file (above percentages is related to Sandia method). The statistics of month in a year which has the closest percentage to durability factor based on the obtained results in the Phase 2, are selected as useable statistics in TMY file. For example, this part can be summarized as follows for the average of daily dry temperature.
a)All of the data for daily average dry temperature per month as a long-term statistical period (for all of the period, for example, for ten years) sorted, and 0 and 100 is advocated to the minimum and the maximum value respectively.
b)The data of daily average dry temperature per month of the five selected years compared with the long-term statistical period, and the its location into the long-term statistical period and thus its percentage was determined; If its value will greater than 67 or less than 33 %, it gets the number 1, otherwise zero is advocated.
c)Part b is conducted for all of the data in each month (the average of daily dry temperature) in order to the number of days, and the total amount of per month is achieved 1. Now, the month out of total period which has more number 1, was been used in TMY.
The fifth step: To complete the annual statistics of each of the parameters, the 12-month statistics which determined as above connect to each other. For this purpose, after the selection of 12 months, unification is done between different months for 6 hours by using curve fitting.
The weight coefficients for each data have an important role for selecting data of TMY file. Weight coefficients represent the degree of importance and sensitivity of any of the data for selecting TMY data. Weight coefficient of Sandia method is given in the table 1.
19

Russian Journal of Building Construction and Architecture
|
Table 1 |
The weight coefficients of Sandia method |
|
|
|
Aerial parameter name |
The weight coefficient value of the Sandia method |
|
|
The maximum of drying temperature |
1.24 |
|
|
The minimum of drying temperature |
1.24 |
|
|
The average of drying temperature |
2.24 |
|
|
The maximum of dew point temperature |
1.24 |
|
|
The minimum of dew point temperature |
1.24 |
|
|
The average of dew point temperature |
2.24 |
|
|
The maximum of wind speed |
2.24 |
|
|
The average of wind speed |
2.24 |
|
|
The total radiation |
12.24 |
|
|
The total perpendicular radiation |
–– |
|
|
The fitted curve is used for two months which were selected out of the different year, for six hours on each side of the data including dry air temperature, dew point temperature (or percentage of moisture), wind speed, wind direction, atmospheric pressure, water content percentage in the air. The moisture percentage can be calculated by the equations after calculation of the dry air and dew temperature.
The measured data may not be reported for some months and hours. Thus, these unreported data should be calculated and updated when choosing the TMY data [15]. In this study, we used the following method to correct them, Unreported value = (the value of three hours later + the value of three hours ago)/2.
3. Providing TMY file for the city of Kermanshah. As we said, the data of dry air temperature, relative humidity, total radiation and direct radiation as hourly, and wind speed and direction as every three hours recorded in order of importance is required to provide TMY file for Kermanshah based on Sandia method. Therefore, the above statistics profile was related to statistical period (2005––2015) of Kermanshah airport synoptic station of which was measured for every three hours in the day, also measured data of total radiation on the same period which is as daily average (measured in watts per square meter of horizontal plane) were collected from this station [18, 19, 20, 21]. Since hourly data must be available for the preparation of the TMY file by the above method, the following measured data placed in Excel software as hourly in the TMY file by using interpolation [22]:
a) dry air temperature, b) relative humidity, c) Total radiation, d) Direct radiation.
20