

Система схемотехнического моделирования Micro-Cap 6.0. Комарова Э.П., Каширский С.Н
.pdf
Э.П. Комарова С.Н. Каширский В.П. Литвиненко А.Б. Токарев
СИСТЕМА СХЕМОТЕХНИЧЕСКОГО МОДЕЛИРОВАНИЯ MICRO-CAP 6.0
Хрестоматия
Часть 2
Воронеж 2005
МИНИСТЕРСТВО ОБРАЗОВАНИЯ И НАУКИ РОССИЙСКОЙ ФЕДЕРАЦИИ
Воронежский государственный технический университет
Э.П. Комарова С.Н. Каширский В.П. Литвиненко А.Б. Токарев
СИСТЕМА СХЕМОТЕХНИЧЕСКОГО МОДЕЛИРОВАНИЯ MICRO-CAP 6.0
ХРЕСТОМАТИЯ ДЛЯ ОРГАНИЗАЦИИ САМОСТОЯТЕЛЬНОЙ
УЧЕБНОЙ ДЕЯТЕЛЬНОСТИ СТУДЕНТОВ (РАДИОЭЛЕКТРОННЫЕ СПЕЦИАЛЬНОСТИ)
Часть 2
Утверждено Редакционно-издательским советом университета в качестве хрестоматии
Воронеж 2005

УДК 621.372
Система схемотехнического моделирования Micro-Cap 6.0: Хрестоматия для организации самостоятельной учебной деятельности студентов (радиоэлектронные специальности). Ч.2 / Э.П. Комарова, С.Н. Каширский, В.П. Литвиненко, А.Б. Токарев. Воронеж: Воронеж. гос. техн. ун-т, 2005. 120 с.
Издание соответствует требованиям Государственного образовательного стандарта высшего профессионального образования по направлению 210300 «Радиотехника», специальности 210302 «Радиотехника», по дисциплине «Иностранный язык». Оно может использоваться и для других радиоэлектронных специальностей при освоении материала современного программного пакета схемотехнического моделирования MicroCap 6.0, который широко применяется в различных учебных занятиях по специальным техническим дисциплинам, например, по курсу "Основы теории цепей". Материал хрестоматии базируется на руководстве пользователя пакета MicroCap 6.0. К каждому блоку предлагаются вопросы, ответы на которые позволяют контролировать качество освоения материала.
Хрестоматия предназначена для студентов 1, 2 курсов. Хрестоматия подготовлена в электронном виде в текстовом
редакторе MS Word 2000 и содержится в файле MicroCap6_2.doc
Ил. 76.
Научный редактор профессор Г.В. Макаров
Рецензенты: кафедра иностранных языков Российского государственного торгово-экономического университета (зав. кафедрой д-р пед. наук, проф. А.С. Беляева); канд. филол. наук., доц. Л.В. Квасова
Комарова Э.П., Каширский С.Н., Литвиненко В.П., Токарев А.Б., 2005 Оформление. Воронежский государственный технический университет, 2005
|
Contents |
|
Chapter 7 |
Using the Scope....................................................... |
5 |
What's in this chapter................................................................... |
5 |
|
Experimenting with Scope........................................................... |
6 |
|
Magnifying................................................................................. |
11 |
|
Panning ...................................................................................... |
|
13 |
Cursor mode............................................................................... |
14 |
|
Cursor mode panning and scaling.............................................. |
15 |
|
Cursor mode positioning............................................................ |
16 |
|
Adding text to plots.................................................................... |
21 |
|
Adding tags to plots ................................................................... |
22 |
|
Performance functions ............................................................... |
24 |
|
Animating an analysis................................................................ |
35 |
|
Chapter 8 |
Using Probe ........................................................... |
37 |
What's in this chapter................................................................. |
37 |
|
How Probe works....................................................................... |
38 |
|
Transient analysis variables ....................................................... |
39 |
|
Probing node voltages................................................................ |
41 |
|
Probing lead-to-lead voltages .................................................... |
42 |
|
Navigating the schematic........................................................... |
43 |
|
An AC example ......................................................................... |
44 |
|
A DC example .......................................................................... |
46 |
|
Chapter 9 |
Stepping Component Parameters .............................. |
50 |
What's in this chapter................................................................. |
50 |
|
How parameter stepping works ................................................. |
51 |
|
Stepping in transient analysis .................................................... |
53 |
|
AC and DC examples ................................................................ |
55 |
|
Chapter 10 |
Using Monte Carlo ................................................ |
61 |
What's in this chapter................................................................. |
61 |
|
How Monte Carlo works............................................................ |
62 |
|
Distributions............................................................................... |
64 |
|
Performance functions ............................................................... |
65 |
|
Options....................................................................................... |
|
68 |
Statistical |
summary................................................................... |
78 |
Chapter 11 |
Working with Macros .......................................... |
79 |
What's in this chapter................................................................. |
79 |
|
|
3 |
|
What is a macro?........................................................................ |
79 |
|
Creating the macro circuit file ................................................... |
80 |
|
Entering the macro into the Component library ........................ |
82 |
|
Using the macro in a circuit ....................................................... |
84 |
|
An easy way to create macros.................................................... |
86 |
|
Chapter 12 |
Working with Subcircuits .................................... |
90 |
What's in this chapter................................................................. |
90 |
|
What is a subcircuit?.................................................................. |
90 |
|
Creating the subcircuit text file.................................................. |
91 |
|
Selecting a suitable shape for the subcircuit .............................. |
92 |
|
Putting subcircuits into the Component library ......................... |
92 |
|
Using the subcircuit as a component ......................................... |
95 |
|
Chapter 13 |
Printing ................................................................. |
97 |
What's in this chapter................................................................. |
97 |
|
Printing schematics .................................................................... |
98 |
|
An example of schematic printing ........................................... |
100 |
|
Printing an analysis plot........................................................... |
102 |
|
Chapter 14 |
Using Animation Mode...................................... |
106 |
What's in this chapter............................................................... |
106 |
|
How Animation mode works ................................................... |
107 |
|
Animation components ............................................................ |
108 |
|
Animate Options dialog box .................................................... |
108 |
|
A transient analysis example ................................................... |
109 |
|
Menus........................................................................................... |
|
112 |
Index ............................................................................................ |
|
114 |
Перечень заданий |
|
|
Задание 1............................................................................... |
|
5 |
Задание 2............................................................................... |
|
21 |
Задание 3............................................................................... |
|
37 |
Задание 4............................................................................... |
|
50 |
Задание 5............................................................................... |
|
61 |
Задание 6............................................................................... |
|
79 |
Задание 7............................................................................... |
|
90 |
Задание 8............................................................................... |
|
97 |
Задание 9............................................................................... |
|
106 |
|
4 |
|

Задание 1
Прочтите и ответьте на вопросы.
1.Какие функции предоставляет меню “Scope”?
2.Зачем нужна опция “Magnifying”?
3.Что осуществляет процедура “Panning”?
4.Как можно управлять позицией курсоров?
Chapter 7 Using the Scope
What's in this chapter
Every analysis routine generates waveforms or curves as a part of the run, based upon the instructions in the Analysis Limits dialog box. After the run is complete, you can inspect, manipulate, magnify, and annotate the plot, as well as search for and display specific numeric positions or values for each of the curves or waveforms. The collection of tools that helps you do this is called Scope.
This chapter shows how to use these features to get the maximum information from an analysis run. The topics include:
•Experimenting with Scope
•Magnifying
•Panning
•Cursor mode
•Cursor mode panning and scaling
•Cursor positioning
•Adding text to plots
•Adding tags to plots
•Performance functions
•Animating an analysis
5
Experimenting with Scope
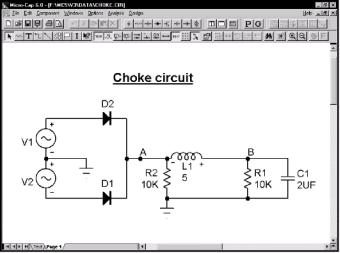
Load the file CHOKE. It looks like this:
Figure 7-1 The CHOKE circuit
After loading the circuit, select transient analysis by pressing ALT + 1. Press F2 to start the run. When finished, the plot looks like Figure 7-2.
When the analysis is over, click on the Scope menu. It provides these options:
•Delete All Objects: This command removes all objects (shapes, tags, or text) from the analysis plot. To delete an object, select it by clicking on it, then press CTRL + X or the DELETE key. To delete all objects use CTRL + A to select all objects, then press CTRL + X or the DELETE key.
•Auto Scale: This command scales the plot group containing the selected waveform. F6 may also be used. The selected waveform is the one whose Y expression is underlined.
6
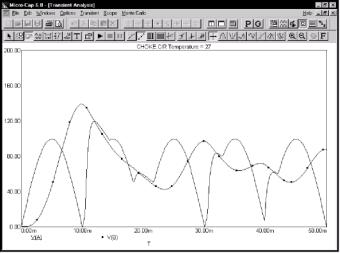
Figure 7-2 Transient analysis of the CHOKE circuit
•Restore Limit Scales: This command restores the range scales to the values in the Analysis Limits dialog box. CTRL + HOME may also be used.
•View: The view options only affect the display of simulation results, so you may change these after a run and the screen is redrawn accordingly. These options may also be accessed through Tool bar icons shown below.
 • Data Points: This marks the actual points calculated by the program on the waveform plot. All other values are linearly interpolated.
 • Ruler: This substitutes ruler tick marks for the normal full screen X and Y axis grid lines.
 • Tokens: This adds tokens to each waveform plot. Tokens are small graphic symbols that help identify the waveforms.
 • Horizontal Axis Grids: This adds grids to the horizontal axis.
7