

Innovative power engineering
..pdfflow V is inversely proportional to the area of the inlet S. At first, we choose the velocity 1.5 m/s because the velocity has influence to the efficiency, then the square meter of the inlet is 0.023 m2.
The thickness of the device
The thickness of the device should be blew 240 mm (the thickness of the outside wall in normal buildings), because it should be installed with the window in the wall.
2.3. The design of the ionic wind parameters
The function of the ionic wind generator is to produce the air flow. The ionic wind is a new technology. The principle of the ionic generation is a combination of fluid, electrostatic field, the diffusion of the electrons. Now, there is not any accurate formula of the wind velocity of the ionic wind. We decided to use semi-experienced way to choose the parameters of the ionic wind generator.
The major parameters of the ionic wind generator included the distance between the wire and the mental net.
The distance between the positive electrode and the negative electrode, according to the text above, the velocity is about 1.5 m/s, we could infer the distance according to Zhuang Mengmeng’s research. When the distance reaches 15 mm and the voltage reaches 10.5 kV, the wind velocity of the ionic wind could reach 1.5 m/s.
2.4. Conclusion
In summary, the device is composed of two main regions, dust removal district and air drive district. The dust removal district use double-zone electric field structure of the dust collector area is 18 cm, the width is 16 cm, the height is 30 cm. Air driven area using multi – network structure, using an ion wind corona wire, wire spacing is 1cm. Therefore the overall thickness of the device length and the flow of dust area driven line distance and coupled with the screen and an active carbon screen width, total thickness is 24 cm meet requirements in installation in the wall.
241
3. Experiment results
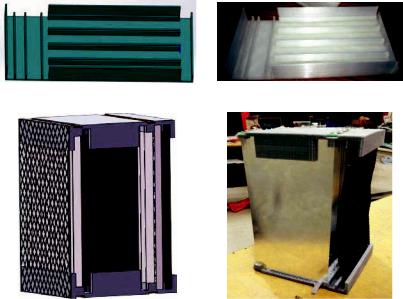
The novel air purification window is composed of top cover, lower base, positive electrode plates, ground electrode plates and a ground electrode net for ionic wind. The top cover and base are made by engineering plastics, and featured high strength and good insulation and produced by 3D printing technology. The plastic model is shown in Fig. 3.1, a, and the real object shown in Fig. 3.1, b. The material of positive electrode plate sand ground electrode plates is 2A11 aluminum, and the material of corona wire is 65 Mn steel. Both have good conductivity, easy processing characteristics. Using line cutting techniques to produce the electrode plate, and punch machine to fix corona wire at the positive electrode plate to produce corona.
a |
b |
c |
d |
Fig. 3.1. The prototype of novel air purification window: a – the lower base 3D printing model; b – the lower base real model; c – the air purification window assemble; d – the air purification window real model
242
The parameters of lower base are as follows: the length is 110 mm and wide 99.5 mm. There are 7 slots, of which 4 are fixed in the ground plate, and 3 are fixed with the positive electrode plate. The slot width is 1.5 mm, the slot depth is 10 mm, the slot interval is 15 mm, which is used for fixing the positive and ground electrode plates. On the base of the Z axis in the positive plate slot, the 1.5 mm-width-groove is left to facilitate the electrode connection. And then separately on the top cover and lower base remain two wide 12 mm, deep 3.3 mm horizontal groove, for the fixed connection of the PCB. The plate part of the front and rear left transverse groove, used for fixing the window screen, ionic wind ne and carbon net. The window screen is glued to the lower base. The width of ionic wind level net and activated carbon net is separately 21 mm and 10 mm.
The air purification window assembly model is shown in Fig. 3.1, c, and the prototype is shown in Fig. 3.1, d. We have applied the national invention patent for the novel air purification window, and application has been accepted.
3.1.Introduction to instruments
1.Using high voltage DC power supply to provide high voltage (Brand: Dong Wen, Type: DW-P503-1ACDF, Voltage range: 0– 50 kV);
2.Using fuming tablets to produce smog;
3.Using thermal anemometer to get the wind velocity (Brand: KANOMAX, Type: MODEL KA23/33, Speed range: 0~5 m/s);
4.Using aerosol detector to measure the value of PM2.5 and PM10 (Brand: TSI, Type: DUSTTRAKTMDRX-Model8533, Concentration
range: 0~150 mg/m3).
3.2. 1m³ sealed box purification experiment
Igniting 1 fuming tablet in a 1m³ sealed and transparent box and after a few second the smog would full of the box and the air purifier cannot be seen by naked eyes. Then, turn on the air purifier and give the rated voltage and start air purifying. We record the process of the smog collecting by this air purifier, and we take a photo of it every 30 s. we use the TSI aerosol detector to record the curve of PM2.5 variation in
243
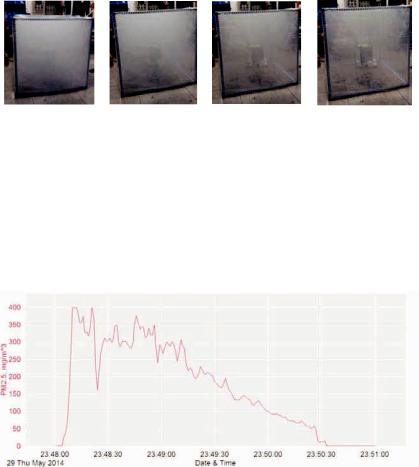
two minutes. The experiment system is shown in Fig. 3.2, and the phenomena is shown in Fig. 3.2 and the curve of PM2.5 variation is shown in figure.
a |
b |
c |
d |
Fig. 3.2. Photos of the 1m³ sealed box purification experiment: a – device running 0 s; b – device running 30 s; c – device running 60 s; d – device running 90 s
From the Fig. 3.3, we can conclude that after igniting the fuming tablets, the PM2.5 concentration increases quickly. With the air purifier turn on, the value steadily decrease. After 2 min, the PM2.5 concentration of the sealed box is lower than 1 mg/m3, which means the air purifier can filter small particles quickly and effectively.
Fig. 3.3. The origin data of the 1 m³ sealed box purification experiment
3.3. Experiment on simulation of the haze weather
Firstly, we ignited only one cigarette in the 1m3 zone, and let stand for a minute. The air in the box was regarded as the still haze air, and the PM2.5 concentration is up to 4000 wg/m3. The space outside the box as the
244
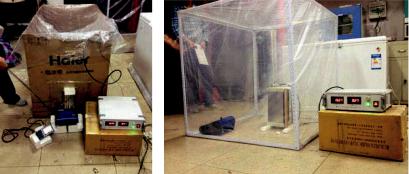
indoor environment in the haze weather. The TSI aerosol detector recorded the curve of PM2.5 variation at the air outlet of the window in a minutes with the power on and off separately to make a comparison, the thermal anemometer could measure the wind velocity at the outlet of the device, the real experiment condition is shown in Fig. 3.4.
Fig. 3.4. Experiment on |
Fig. 3.5. Experiment on 1m³ sealed box |
simulation of the haze |
purification |
weather |
|
During the 1 min when the air purifier was turned on, we measured the wind velocity in outlet vent 6 times, and the results is shown in Table 3.1. This table proves that the velocity of ionic wind is 1.52 m/s.
|
|
|
|
|
|
|
Table 3.1 |
|
|
|
The wind velocity in outlet vent |
|
|
||||
|
|
|
|
|
|
|
|
|
Serials |
1 |
2 |
3 |
4 |
5 |
6 |
Average |
|
Velocity |
1.48 |
1.62 |
1.68 |
1.41 |
1.39 |
1.52 |
1.52 |
|
(m/s) |
||||||||
|
|
|
|
|
|
|
||
The test continues in 2 min. The curve of variation of PM2.5 concentration at the air outlet of the window is showed in Fig. 3.6, a, b separately show when the air purifiers is turned on and off. Through the Fig. 3.6, a, we can get the average value of the PM2.5 concentration C0 during 1 min when the air purifier is turned off, which is 4420 wg/m3, on the contrary, the average value when the air purifier is turned on is
245

328 wg/m3. By dust removal efficiency calculation formula, we can get the efficiency can up to 92.8 %.
a
b
Fig. 3.6. the origin data of experiment on simulation of the haze weather: a – when the device is turned off; b – when the device is turned on
4.Practical analysis
4.1.Innovations
1.Combining windows with air purifiers and installing air purifiers on the wall just like wearing a mask for houses, which can forbid the pollutants from coming into the houses and collect the small
particles when it comes into houses with air flow. This novel air purification windows have 96 % dust removal efficiency and 203 m3/h
ventilation volume and meet the need of users for fresh and clean air.
246
2.Using ionic wind as air flow driver in ventilation. This products uses multi-line net-ionic wind structure to produce steady and uniform air flow with the velocity reached 1.24 m/s, in order to accelerate the air flow and increase ventilation quantity. The evident advantages of ionic wind is super thin and ultra-silent, which facilitates shorten the width of products and the usage of it in calm environment.
3.Realizing integration of ionic wind tech. and electrostatic precipitation tech. Setting the rated voltages of ionic wind and ESP in the same value through connecting the corona pole of ESP with the positive pole of ionic wind, and by this we can only use one voltage source to produce ionic wind and ESP, which saves one voltage source and reduce the cost and simplify the structure of circuit.
4.2.Market outlook
Product superiority: This product set the ventilation and dust removal as a whole and can effectively remove pollutants in airflow, initiative to achieve ventilation, send the fresh air into houses. The experiments showed that when the concentration of PM2.5 reached 5000 wg/m3 in the wind inlet, the air PM2.5 concentration is only 196 wg/m3 in the wind outlet. The dust particle size range is wide, the vent wind speed reached 1.24 m/s, ventilation volume of 203 m3/h; the product is placed in the wall, does not occupy the indoor space, low energy consumption, low cost, no secondary pollution.
Market demand analysis: Due to the frequent haze weather, air purifiers are sold well in market, but the existing air purifiers cannot achieve active ventilation. Therefore it cannot meet people's needs for indoor fresh air. So people need a kind of household appliances which can simultaneously achieve ventilation and dust removal.
Potential customer analysis: This product is suitable for home life, public places, and the laboratory which needs clean environment.
References
1. Li M., Zhang L. Haze in China: Current and future challenges // Environmental Pollution. – 2014. – Vol. 189(0). – P. 85–86.
247
2.Formation process of the widespread extreme haze pollution over northern China in January 2013: Implications for regional air quality and climate / M. Tao, L. Chen, X. Xiong [et al.] // Atmospheric Environment. – 2014. – Vol. 98(0). – P. 417–425.
3.An experimental investigation of electrostatic precipitation in a wirecylinder configuration at high temperatures / G. Xiao, X. Wang, G. Yang [et al.] // Powder Technology. – 2015. – Vol. 269(0). – P. 166–177.
4.Kocik M., Dekowski J.A., Mizeraczyk J. Particle precipitation efficiency in an electrostatic precipitator // Journal of Electrostatics. – 2005. – Vol. 63(6–10). – P. 761–766.
5.Evidence of powdered activated carbon preferential collection and enrichment on electrostatic precipitator discharge electrodes during sorbent injection for mercury emissions control / V. Prabhu, T. Kim, Y. Khakpour [et al.] // Fuel Processing Technology. – 2012. – Vol. 93(1). – P. 8–12.
6.EHD Flow and Collection Efficiency of a DBD ESP in Wire-to-Plane and Plane-to-Plane Configurations / N. Zouzou, B. Dramane, E. Moreau [et al.] // IEEE Transactions on Industry Applications. – 2011. – Vol. 47(1). – P. 336–343.
7.Kitahara Y. KARO. An Experimental Analysis of Ionic Wind Velocity Characteristics in a Needle-Plate Electrode System by Means of Laser-Induced Phosphorescence.
8.Air supply using an ionic wind generator in a proton exchange membrane fuel cell / K. Kwon, L. Li, B.H. Park [et al.] // Journal of power sources. – 2015. – Vol. 284. – P. 504–510.
9.CFD simulation of high-temperature effect on EHD characteristics in a wire-plate electrostatic precipitator / Y. Li, C. Zheng, K. Luo [et al.] // Chinese journal of chemical engineering. – 2015. – Vol. 23(4). – P. 633–640.
10.Hanne O., Timo N., Hannu K. Increase the utilisation of fly ash with electrostatic precipitation // Minerals Engineering. – 2006. – Vol. 19(15). – P. 1596–1602.
248
DESIGN OF A WAVE POWERED COMBINATION ELECTRIC GENERATOR BASED ON THE LIQUID METAL MHD
Sun Yue, Han Bing
School of Energy Science and Engineering, Harbin Institute of Technology, Harbin
The aim of this paper is to develop an innovative method for electric power conversion of the ocean wave energy. The wave energy is a kind of new clean energy, while its feature of low density and instability made it cannot be used efficiently. The efficiency of the existing wave energy plant is no more than 20% mostly. A combined magneto hydrodynamics-based wave energy converter (CMHDWEC) is proposed to enhance the electric power generation from wave fluctuations. In the CMHDWEC design, the working media of this system is magnetic fluid, such as mercury, and the generating terminal is the MHD channel. This device absorbs wave energy through a plate-pendulum hanged on the girder, and converts the wave energy into electric power using the MHD channel. Design concept and the working principle were firstly demonstrated. Then the key technologies of main components system are carried out for an adequate explanation of the proposed system. Finally, numerical simulations using were performed to verify the effectiveness of the system. From the simulation results the electric power generated can achieve to 20kW when the system is run under the steady-state operating conditions.
Keywords: wave energy, Combination, Converter, MHD channel, Numerical simulation.
Nomenclature
B – Complex magnetic field (T)
b,h,l – The width, height and length of MHD channel (mm) c – Specific heat capacity of the magnetic fluid (J/kg K)
J – Density of induced currents (A/m2) k – The external load factor
Po1 – Output Power of MHD channel with one wheel drive (W) Po2 – Output power of the buoy-swing magnetic fluid system (W)
Rl ,Rg – External resistance and internal resistance of MHD channel (•)
V– Velocity of the magnetic fluid (m/s)
– Thermal conductivity of the magnetic fluid (W/(m K)) ; – Kinematic viscosity of the magnetic fluid (St)
249
– Density of the magnetic fluid (Kg/m3)
– Conductivity of the magnetic fluid (S)
<V – Viscous dissipation (J)
<JH – The Joule heat (J)
– Flow frequency of the magnetic fluid (rad/s)
Introduction
Energy saving and emission reduction is a common topic in current world, and renewable energy is becoming increasingly important due to the expected exhaustion in the current energy resources [1], more and more people have been paying their attention to explore and utilize sustainable energy. Among the new energy, ocean energy occupied the quite essential position because of the tremendous storage on the earth, and the wave energy has been regarded as one of the most promising renewable technologies. Compared with other sustainable technologies, wave energy is more dependable, and the power at a given site is available up to 90 percent of the time, while solar and wind availability tend to be available just 20-30 percent of the time [2]. The waves are produced by wind directly, being considered as an indirect form of solar energy therefore [3]. The possibility of converting wave energy into other usable energies has inspired numerous inventors for a long time: thousands of patents had been registered by 1980 and the number is increasing rapidly [4]. Interestingly, the earliest patent was filed in France in 1799 by a father and a son named Girard [5]. And it can be seen that the final product of the most devices developed or considered is electrical energy from the patents registered so far.
Experiencing decades of development, the four main types of energy harvest and storage methods have been applied in wave energy generation (WEG). The first type of devices is based on oscillating water column (OWC), which is most widely used in current research and utilization. This WEG method depends on the air column and the pressure difference generated by waves. The rotational motion of air turbine rotor caused by the compressed air makes it possible to store
250