

Innovative power engineering
..pdf4)With humidification dehumidification process going, the amount of sea water on the sieve and all levels of stack plates will be reduced. In order to maintain a larger area of sea water evaporation on the inclined surface, water concentration is avoided too high, the temperature difference between the bottom surface of the stack plate and moist air should be maintained, and the new seawater is needed to add regularly into the seawater on the sieve and on the stack plates. The larger the temperature difference is, the faster moist air condenses and the higher water production rate is.
5)In the experiments, the water production of first stage stack plate was 1.60 kg/h, the second one was 0.90 kg/h, the total water production of the unit was 2.70 kg/h, and the GOR of the unit was 4.
6)Experiments of this paper were done under the conditions of a certain bubbling humidifying temperature. In fact, improving this temperature can increase the water production rapidly. Theoretical analysis shows when the bubbling humidifying temperature rising from 40 °C to 70 °C, every 10 °C increasing would lead to the enhance of theoretical water production by about one time.
7)There are several reasons resulting in the difference between the theoretical water productions and the actual ones, such as the temperature difference between internal and external of the device, which resulted in some heat loss to the environment; part of fresh water drops into the lower seawater pan resulting in the loss of water production; some of freshwater condensed around the walls of the dehumidifier which cannot be recovered; condensed water vapor adhering to the surface of stack plate causes the reduction of condensation heat transfer coefficient, and the moist air.
References
1.Sharon H., Reddy K.S. A review of solar energy driven desalination technologies // Renewable and Sustainable Energy Reviews. – 2015. – Vol. 41. – P. 1080–1118.
2.Chennan Li, Yogi Goswami, Elias Stefanakos. Solar assisted sea water desalination: a review // Renewable and Sustainable Energy Reviews. – 2013. – Vol. 19. – P. 136–163.
121
3.Thermal design of the humidi{cation dehumidi{cation desalination system: an experimental investigation / G. Prakash Narayan, Maximus G. St. John, Syed M. Zubair, John H. Lienhard V. // International Journal of Heat and Mass Transfer. – 2013. – Vol. 58. – P. 740–748.
4.Juan-Jorge Hermosillo, Camilo A. Arancibia-Bulnes, Claudio A. Estrada. Water desalination by air humidi{cation: Mathematical model and
experimental study // Solar Energy. – 2012. – Vol. 86. – P. 1070–1076.
5.El-Agouz S.A., Abugderah M. Experimental analysis of humidifycation process by air passing through seawater // Energy Conversion and Management. – 2008. – Vol. 49. – P. 3698–3703.
6.Lixi Zhang, Guangping Cheng and Shiyuan Gao. Experimental Study on Air Bubbling Humidification // Desalination and Water Treatment. – 2011. – Vol. 29. – P. 258–263.
7.Veera Gnaneswar Gude. Energy storage for desalination processes powered by renewable energy and waste heat sources // Applied Energy. – 2015. – Vol. 137. – P. 877–898.
8.Veera Gnaneswar Gude, Nagamany Nirmalakhandan, Shuguang Deng, Anand Maganti. Low temperature desalination using solar collectors augmented by thermal energy storage // Applied Energy. – 2012. – Vol. 91. – P. 466–474.
9.Hou Shaobo, Zhang Hefei. A hybrid solar desalination process of the multi-effect humidification dehumidification and base-type unit // Desalination. – 2008. – Vol. 220(1). – P. 552–557.
10.Reddy K.S., Ravi K. Kumar [etc.] Performance analysis of an evacuated multi-stage solar water desalination system // Desalination. – 2012. – Vol. 288. – P. 80–92.
11.Hongfei Zheng, Zehui Chang, Zhili Chen, Guo Xie, Haijiang Wang. Experimental investigation and performance analysis on a group of multieffect tubular solar desalination devices // Desalination. – 2013. – Vol. 311. – P. 62–68.
122
CAVITATION TECHNOLOGY FOR WASTE PROCESSING AND POWER GENERATION
Y.L. Spirin
Currently, one of the most promising areas of recycling is the transfer traditional sterilization technologies for the processing of municipal solid waste.
The development of these technologies in the recycling of household waste goes in two directions: the first is associated with the development of autoclave technologies to effectively decompose the waste into fractions; the second one is to use the technology of the boiling debris from the pre-shredded garbage mass.
In the autoclave technology companies are the absolute leaders EstechUSA, Babcock (UK), Ambiensys (Spain), Sterecycle (UK), WastAway(USA) [1,2].
Autoclave technology is the mass in garbage handling autoclave at pressures of from 4 to 7 bar of superheated steam at a temperature of 120 to 200 .
In the most basic applications as the primary treatment vessel is used the horizontal rotating autoclaves combined with some debris grinder. In the processing of plastic bottles pulverization occurs, packets, boxes, etc. and their partial softening and melting. Organic wastes decompose into cellulose, lignin and other fractions, wherein the cellulose content after autoclaving is 50 % [3, 4].
After “autoclaving” the average volume of municipal waste is reducing up to 70 %. The waste mass is completely sterilized and free of infections.
After 'overheat steaming' the steam flow is stopped. For cooling used the special condenser. In one of the applications the condenser is the one of the element for heating steam for the second autoclave [5, 6]. When depressurized the autoclave door is opened. Rotating drum makes it easy to download “steamed post-waste” material to processing for subsequent fractionation. So, 'steamed post-waste”' material can be
123
discharged and separated by a series of vibratory areas (trommel screens usually) and recovery systems [7, 8]. The “steamed post-waste” materials after vibratory separation have several valuable uses. One system claims to be able to dry the cellulose during processing using “dry” overheating steam. Another system is able to dry the cellulose using centrifugation. The second system is more economically.
Separation of the cellulose fibers is carried out in a stream of air which blows the lighter cellulose fiber fraction. The heat, steam and rotating action of the autoclave vessel strip off labels and glues from food can provide very high quality ferrous/non-ferrous fission.
Further separation of “steamed post-waste” plastics and glass also produced on vibrating screens.
For separation ferrous materials used electromagnets, for separation non-ferrous metal particles used Foucault current devices.
The full process of loading, treatment and separating is typically completed within 90–120 minutes. Usually it used autoclaves of 0.5; 2; 6; 12 and 36 cubic meters for plant with annual processing volume 1,200; 4,800; 15,000; 30,000 and 120,000 respectively.
Another method of using of sterilization is the “cooking” process. A significant advance in this technology has made the company Vickers Seerdrum (UK).
The main feature of the technology is a decoction of garbage at a temperature of 75–95 °C. As a result waste treatment process is required more and more lower capital and operating cost, no pressure vessel engineering, no odorous condensate disposal cost, no glass and melted plastic fragments which pass out with the cellulose fibre etc.
However none autoclave technology or technology pulping are not widely development in the world. There are only a few plants working on these high-temperature processing technologies. The reason is the significant energy consumption and high technological complexity of the equipment and the complexity of the control programs.
Further promotion of high-temperature sterilization technologies to processing waste is developed at our Moscow University of Information Technologies, Electronics and Automatics (MIREA) cavitation ones.
124
A cavitation technology of municipal waste proceeding provides significantly reducing of power consumption and simplifies and reduces the cost of equipment operation. Waste treatment by cavitation technology is conducted inside a rotating column operating without the addition of large volumes of water and without raising temperature above 50|l due to its own moisture collector.
Cavitation bubbles are created by the action of the combination of microwave and ultrasonic radiation on the flow in the pre-shredded garbage under the influence of the alternating electric field. Then this mass of debris flows in the low-temperature horizontal rotating vessel with the additional mechanism for grinding.
The key element for cavitation bubbles forming is piezotransformer [3, 4] (figure).
Fig. Piezotransformers with autoelectronic emission
Pressure necessary for decomposing of garbage particles creates on the base of producing water drops on the surface of garbage particles above. These drops in the cavitation fluid are obtained by intense ultrasonic waves method. In this case, the waste flow is handled by the variable electrical field.
125
Waste stream is heated by microwave radiation. This is the additional factor in the formation of cavitation bubbles.
Liquid flow which is injected into the cavitation vessel also is incurred to ultrasonic, electrical field and microwave influence to cavitation bubbles creation.
As a result alternating phases of compression (compression) and the dilution cavitation bubbles is created. The average bubble diameter is approximately 1 mm.
During the collapse of the bubble (the collapse time can vary from a few nanoseconds to tens of microseconds) they contain gas can be heated up to 6000–7000 °C (for comparison surface temperature of the sun is 5500–6000 °C).
Using of piezotransformers with autoelectronic emission provides to form more than 105 cavitation bubbles and reaction temperature up to 6000–7000 °C.
When these cavitation bubbles on the surface of waste small particles and larger pieces and bubbles created in the water pipes inject to processing vessel it can give such a rapid relative movement these particles and larger pieces (especially organic, plastic, stone and metallic), they will be destroyed and even melted in a collision
Ultrasonic waves with microwave and electrical “pumping” are also able to create microscopic and nanoscopic “pockets of hightemperature elements” in a cold liquid or in bubbles inside ice. This may be way to develop waste proceeding vessel without any heating but on the base crashers only (with special tools, of course).
Moreover these effects of ultrasound are caused by physical process of liquid arise, grow and collapse gas and steam bubbles.
The required pressure to destroying of waste particles is depending on the type and purity of garbage or liquid on the surface of waste particles and water inside operation vessel. It is very useful for further separation process to obtain separate fractions of cellulose, plastic, glass, metal and stone.
As a result there are two proceeding vessels is required. The first one is for primary treatment the “continuous throughput” and the second one used for separation and drying.
126
Cavitation process used the more simple equipment as waste autoclave process or cooking process. Comparative characteristics can be viewed in table below.
Description |
Autoclave |
“Cooking” |
Cavitation |
|
Technology |
Technology |
Technology |
Capital Costs |
High |
Middle |
Low |
Operation Cost |
High |
Low |
Low |
Process |
Batch |
Continuous |
Continuous |
|
|
Throughput |
Throughput |
Vessel Types |
Rotating, high |
Rotating, non- |
Rotating, non- |
|
pressure, high |
pressure, high |
pressure, low |
|
temperature |
temperature |
temperature |
Process Tempe- |
120–200 |
75–95 |
20–50 |
rature, °C |
|
|
(may be |
|
|
|
from –50 to +50) |
Heat Input |
Overheating |
Hot Water |
Ordinary tap water, |
|
steam |
|
heating is not |
|
|
|
required |
Heat required per |
1 |
0.1 |
0.001 |
Tonne MSW, GJ |
|
|
|
Process Water |
High quality |
Low grade |
Low grade |
Organic Fibre |
With melted |
Without melted |
Without melted |
Product |
plastics |
plastics |
plastics |
Condensate |
Yes with high |
None |
None |
Production |
disposal costs |
|
|
Potential for |
Fibre only |
Fibre only |
Fibre, Plastics, |
Incineration or |
|
|
Tyres and Resins |
Pyrolysis |
|
|
due to good plastic |
|
|
|
types separation |
|
|
|
(the secondary |
|
|
|
proceeding) |
Fibre Potential |
Good |
Good |
Good |
for Biogas |
|
|
|
Fibre Potential |
Poor due to |
Poor due to lignin |
Good |
for Biogas |
plastics |
contamination |
|
|
contamination |
|
|
127
References
1.Solid material comminution or disintegration processes with heating or cooling of material: patent application number US20090250535 / J.K. Michalek, 25.03.2010.
2.Distillation: processes, thermolytic feed other than coal, oil shale or wood: patent application number US 20100163396 / J.K. Michalek, T.J. Thomas. 01.07.2010.
3.Solid Waste Compresion Loading and Waste Treatment Apparatus
Method: patent application number US 20130309143 / J.K. Michalek, T.J. Thomas. 21.11.2013.
4.Waste Treatment Autoclave to Provide for Steam – Assisted Drying: patent application number US20100135851 / J.K. Michalek, T.J. Thomas. 01.12.2008.
5.Process for Recycling Absorbent Sanitary Products: patent USA 8979005 / M. Somma, G. Vaccaro, J.K. Michalek, T.J. Thomas. 17.03.2015.
6.Apparatus and process for Recycling Sanitary Products: patent USA 8883076 / M. Somma, G. Vaccaro, J.K. Michalek, T.J. Thomas. 11.11.2014.
7.Solid Waste Compression Loading and Waste Treatment Apparatus and Method: patent USA 8834809 / J.K. Michalek, T.J. Thomas. 16.09.2014.
8.Waste Treatment Vessel Featuring Tilt Mechanism and Accociated Door Arrangment: patent application number US20100129257 / J.K. Michalek, T.J. Thomas. 27.10.2010.
9.Electronic controllable source with autoelectronic emission: patent USSR 851543 / Y.L. Spirin, V.N. Frolov, V.V. Drohzev. 30.07.1981.
10.Electronic source with autoelectronic emission: patent Russia 2147781 / Y.L. Spirin, A.A. Platonov. 22.04.2000.
128
ANALYSIS OF SOURCE OF OIL FLOODING
A. Laushkin, A. Khaziev
The Moscow State Automobile and Road Construction University (MADI))
The article discusses the causes of flooding of engine oil from vehicles and provides quantitative estimates of transferring of water into oil.
Keywords: motor oil, humidity, water in oil.
Introduction
Recently in the Russian Federation, there are many cases of motor failure in warranty cars, caused by the loss of efficiency of motor oils. While testing of individual samples of lubricants conducted in the laboratory of MADI-CHEM Moscow State Automobile and Road Technical University (MADI), along with a significant deterioration of the physical and chemical properties of engine oils, a huge amount of water was found in them: up to 1…2 % with an acceptable water content in used oil 0.5 %.
The water in the engine oil is most common in the operation of vehicles in winter and this fact shows:
rejecting the thermal regime of the engine from the norm;
a constant “feeding” of motor oil by water, because during the normal operation of the power plant water from the engine oil should evaporate.
The most common version of flooding of oil is condensation of water from the air entering the cylinders of the engine [1].
Water as a product of condensation of atmospheric air
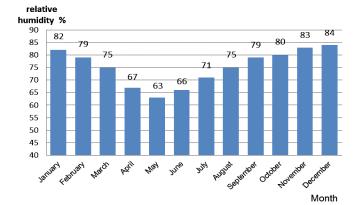
Let’s calculate the mass of water flowing into the engine oil from the air. The relative humidity of the ambient air, in most regions of Russia generally varies from 60 to 85 %. Changes in the relative humidity of the ambient air in the city of Moscow are shown in Fig. 1.
Relative humidity of air is the ratio partiall pressure of water vapor to the equilibrium vapor pressure:
RH = (p / p *) } ~
129
where RH – relative humidity; p – partial water vapor pressure Pa; p * – the equilibrium vapor pressure, Pa.
Fig. 1. Changes in the relative humidity of the ambient air in Moscow, %
As to weight units, relative humidity – the ratio of the mass fraction of moisture in the air to its maximum possible value within the given temperature:
RH = (f / fmax) } ~
where f – the mass fraction of moisture in the air, g/m3; fmax – maximum possible water content in the air, g/m3.
Table 1 shows the maximum absolute humidity at different temperature conditions in ambient air [3].
|
|
|
|
|
|
Table 1 |
|
Maximum absolute humidity in different temperatures |
|
|
|||||
|
|
|
|
|
|
|
|
Temperature of ambient air, t °C |
C |
|
0 |
10 |
20 |
|
30 |
Maximum possible contains of |
0,81 |
2,1 |
4,8 |
9,4 |
17,3 |
|
30,4 |
water in air(fmax, (g/m³)) |
|
|
|
|
|
|
|
We will calculate how much water gets into the working mixture from the air.
130