

Innovative power engineering
..pdfTHE NEW ANTI-TYPHOON WIND TURBINES
Wang Xuchen, Li Haoran, Li Songqi, Yu Tianning
Northwestern Polytechnical University, Xi’an, P.R.China
The project design is defined as the “new anti-typhoon wind generator”, based on the optimal design of the traditional three-blade wind turbine. It has a low-cost installation, remote monitoring, periodic change blades and stronger anti-typhoon capacity.
By applying about ten core technologies, which greatly improve the viability of the fan in the strong typhoon environments, while maintaining the fan will not be damaged under the premise of the wind to generate electricity, this may slightly decrease the strength of typhoons.
Background:
1.Wind resources on the planet is about 200 trillion kilowatt-hour per year, just insignificant part of which have been developed now. According to statistics, only 1 % of the ground wind resources will be able to meet the worldwide demand for energy
2.July 18, 2014, the strongest typhoon “Ramasun” in recent 41 years landed in Wenchang City, Hainan Province, South China. Great destructive power generated when the typhoon passing, which made three 1.5MW wind turbine badly damaged in Hainan Wenchang wind farms, one of pillar bases collapsed.
Because of the “Ramasun”, 18 units 1.5MW wind turbines in Xuwen Yongqi windfarm were badly hit, including 15 pillar base collapsed, 3 units severely damaged, which causes the total loss of more than 200 million yuan.
Only in Zhejiang Province, since large-scale development of wind power in 1997, a total of 23 typhoon have effect on Zhejiang. Of which 8 typhoon have caused loss of millions yuan on the wind power equipment, 2 of which have caused loss of more than 10 million yuan.
3.Last year, researchers at Stanford University and the University of Delaware's published a new report, which reveals that wind turbines
191
may be enough to destroy the hurricane whose peak wind speeds up to 92 miles an hour, and reduce storm surge of up to 79 %. The results was published in the journal “Nature Climate Change”.
Structure outlined
The all new designed anti-typhoon wind turbines has following key points.
Shorter blades – by shortening the length of the blade, this can be in the same wind conditions, this can reduce the cumulative moment of the blades greatly in the same wind conditions.
Strengthen connections of blades – using patented technology for blades strengthen and decentralized stress. Which in purposes to reduce the possibilities of the fan blade fracture caused by stress concentration resulting in strong winds.
Main power slip ring – by using the main power slip ring substitution complicated cable system to improve the freedom of the fan head.
Suspension tower – with new suspension tower, inspired by submarine, which could avoid the risk of broken tower.
Performance
The blades of the all new designed anti-typhoon wind turbines can withstand wind speeds of 70 meters per second.
192
PHOTOSYNTHESIS ALGAL MICROBIAL FUEL CELL SYSTEM
Yifei Xue, Lin Zhang, Hanying Xu, Zhu Mao, Li Tian, Yiming Yan
Microbial fuel cell is a type of fuel cell that transfer chemical energy into electric energy based on the metabolism of microbe or the catalysis of biomolecules. Microbial fuel cell is attracting more and more research attentions due to its advantages, such as green and clean, renewable, low-cost and mild operating-conditions, etc. On the other hand, microalgae reproduce rapidly, insert to most contaminants and own high photosynthetic efficiency. Those features endow microalgae with great values for scientific study all over the world.
The photosynthetic algal microbial fuel cell (PAMFC) studied in this project is an electricity-generation technology that combines microalgae energy technology and microbial fuel cell technology. PAMFCs collect solar energy through the photosynthesis of microalgae and transfer solar energy into electric energy by microbial fuel cell technology.
Given the fact that the current researches on PAMFC technology are still in its infancy, most of the studies are theoretical calculations and just focused on demonstrating its feasibility, rather than their practical application. In this project, we aim to study PAMFCs mainly from three aspects: microalgae cultivation, air cathode and biological anode, based on the analysis and measurements of PAMFCs’ performance. We finally present a sustainable prototype and on this basis we designed and built our test system.
We used relatively inexpensive carbon paper as the biocathode substrate and coated it with Co-C-N catalyst as a substitute for platinum catalyst. The bioanode was fabricated by simple immersion method, avoiding the complicated process of immobilization techniques. According to the electrodes’ polarization curves, a theoretical shortcircuit current of the PAMFC is calculated to be 0.79 mA, a short-circuit current density is estimated to be 526.67 mA/m2, an open circuit voltage is around 0.23V, an ideal maximum output power is 2.57×10⁻² mW and
193
a maximum power density is 18.31mW/m2.The highest open-circuit voltage is 0.20V, which is consistent with the theoretical values.
We designed the structure of our test system by INVENTOR software. Control module took MSP430F5529 as the core for controlling electrical appliances, data acquisition and communication with upper computer, it has low power and low cost. The software of control and data acquisition written by MATLAB, it was used to send control data and receive measure data between upper computer and MCU. This apparatus can cyclically pumped algae solution through anode cell and measured the output of the cell.
Keywords: microalgae photosynthetic microbial fuel cell, air cathode, oxygen reduction, microalgae bioanode, electricity production system.
194

POWER MANAGEMENT
USING A MEASURING SYSTEM FOR THE STUDY OF POLIS D'ALEMBERT'S PARADOX AND THE CONTINUED USE OF THIS PHENOMENON FOR VARIOUS SPHERES OF POWER
A.V. Nikiforov, S. . Sheklein
Ural Federal University
The measuring system POLIS, based on the digital flow visualization techniques for measuring velocity fields in liquids and gases (PIV, Tomo PIV, Stereo PIV, Micro PIV), as well as methods for measuring the diameters of droplets and bubbles (IPI, PFBI), fields of concentration, temperature, and film thickness (PLIF, LIF), allow to solve a variety of scientific and applied problems. The main objective was to create an installation showing the d'Alembert's paradox and with the help of a measuring system to measure the velocity field POLIS flow symmetric body airflow.
The basic method for the study of selected PIV-method (method for measuring instantaneous optical fields or gas velocity of the fluid in the selected section of the flow). Thin knife light from a pulsed laser illuminates fine particles in the test stream does two more successive laser flash, which recorded a special digital camera. Consequently, the rate is determined by calculating movement, which make the particles during the time between the laser flash. Determination of displacement based on the use of correlation methods for tracer paintings, using regular decomposition into elementary regions.
The basis of the experience of the first leg d'Alembert's paradox (at steady flow of a solid stream of air drag-free). To see this, consider the symmetric flow around the body, shown in Fig. 1. The current lines are symmetrical about the plane, and the particle velocity of air at the appropriate points in front of and behind the body are equal in
195
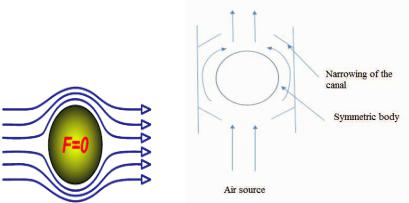
magnitude and differ only in direction. Pressure at these points equally according Bernoulli's equation. Now the components of the force of pressure at points a direction parallel to the flow, cancel each other out. Since the total force exerted on the body by the flow equals the sum of the air pressure forces acting on the individual elements of the solid surface, the drag is absent.
The essence of the first experiment was to measure the velocity fields of flow around a sphere flow of air in the pipe. For the experiment took: Plexiglas tube with an outer diameter of 50mm, 45mm and inner wall thickness of 3 mm, light ball source blowing air and the measuring system of the POLIS.
Schematically setting characterizes d'Alembert's paradox is presented in Fig. 2.
Fig. 1. Wrap symmetric body |
Fig. 2. Installation |
uniform air flow |
|
In order to rotate the ball quickly, you need to do before and after the constriction of the ball. As a result, the air will begin to flow around the ball and drag is equal to 0, d'Alembert's paradox.
During the experiment clearly demonstrated d'Alembert's paradox (the result of the vanishing of the total force acting on the body from the air stream). Further, with this setting and measuring system must be measured POLIS velocity field of air at a flow object.
196
DEVELOPMENT OF HEAT SUPPLY ELECTRONIC MODEL
FOR TOWN OF DOBRYANKA, PERMSKIY KRAI, RUSSIA
N.A. Laba, S.M. Kuminov, A.M. Lotokhov,
E.V. Makhnutina, D.A. Startsev, V.V. Tiunov
Computerized simulation of the processes in the heat supply system of a city allows to estimate parameters of the current operation at the maximum possible accuracy, to calculate reliability, to investigate various options for future potential development of the system and within shortest timeframe to determine efficiently optimum solutions of heat supply to consumers in emergency situations which is extremely vital question in cases of low negative temperatures of the ambient air in the Ural region of Russia and in other parts of the world.
Keywords: heat energetics, heat supply system of a city, heat network, hydraulic simulation, on-line operation, accuracy, reliability, safety, accidents precaution.
Facility General Description under Investigation
Population of the town is approximately 30 thousand people.
Heat energy is supplied by Production Process-and-Heating Boiler Plant of Inter-RAO – Power Generation JSC (Joint Stock Company) (affiliated with Permskaya GRES power plant), installed heat capacity is 298 Gcal/hr.
The temperature chart for direct supply and return water is 150/70 ° , trimmed to 130/70 ° .
The heat energy consumption of the town (maximum) is 85 Gcal/hr (based on data provided by heat supply enterprise).
The quantity of Central Heat Supply Station – 1, Individual Heat Supply Stations ~ 500. Length of the heat supply lines is 101 km (double tube representation).
Project Objectives and Tasks
Development of the first on-line chart of heat energy the towm
supply.
Comprehensive analysis of the heat supply system on the basis of the chart.
Computer-aided calculation of thermal losses.
197

Investigation of potentialities for occurrences of various emergency conditions and non-standard situations.
Search the ways for emergency isolation methods with minimum damage [1–10].
Integrated Information System Development for Heat Supply of a Town
The description of source information materials as of the project commencement date:
The list of consumers with the preset agreed loads.
The obsolete but in majority cases still valid technical data sheets for main networks and quarter-based networks illustrated as diagrams.
The thermal chamber diagrams indicating existing shut-off and control valves.
The obsolete utilities database of Dobryanka town (as of 1987) which is the key source of geodetic marks of the heat supply networks (as per Baltic elevation system).
Generation of graphic representation of the town layout and of the heat supply system
The sample of the quarter layout derived from processing of the hard copy field survey maps is shown Fig. 1.
Fig. 1. The sample of the quarter layout derived from processing of the hard copy field survey maps
198

The same quarter referenced to space view map is present on Fig. 2.
Fig. 2. The same quarter referenced to space view map
The same quarter. Finalized on-line chart of heat energy supply (Fig. 3).
Fig. 3. On-line chart of heat energy supply
199

Analysis of heat supply
Actually delivered heat for the heating period is calculated as per design ambient air temperature, we defined maximum heat load at the heat supply source output:
Qmax=83.7 Gcal/hr.
Actually delivered heat energy for the summer period defines the heat load at the heat supply source output for preparation of the hot water supply:
Qhot wat.sup. av.=11 Gcal/hr.
Conclusion: heat energy load at the heat source output when calculated for the ambient air temperature Tamb.air = –35 ° (for Ural, region of Russia) can be compared to contractual consumed loads.
Actual readings of metering devices if compared to preset temperature chart (Fig. 4).
Fig. 4. Actual readings of metering devices if compared to preset temperature chart
Some of the conclusions of computer-aided analysis of the heat supply system
Actually released heat energy determined in the project illustrated by the graphics shows that no temperature is exceeded in the
200