normal electrical axis
left electrical axis

right electrical axis

Thus, based on the above, we can assume that:
I, AVL leads characterize changes in the left heart;
III, AVF leads characterize changes in the right heart;
II, AVR total leads in them reflect changes from the left and right departments.
Changes to these pairs must be duplicated.

The chest leads also reflect the balance between the right and left sides of the heart:
V1 and V2 - right chest
V5 and V6 - left chest
V3 - V4 - transition zone

normal electrical axis

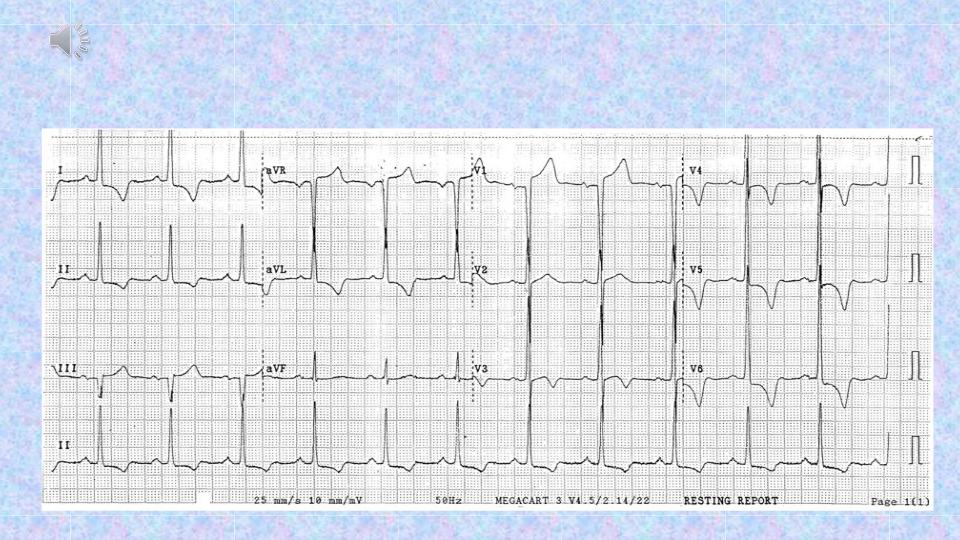
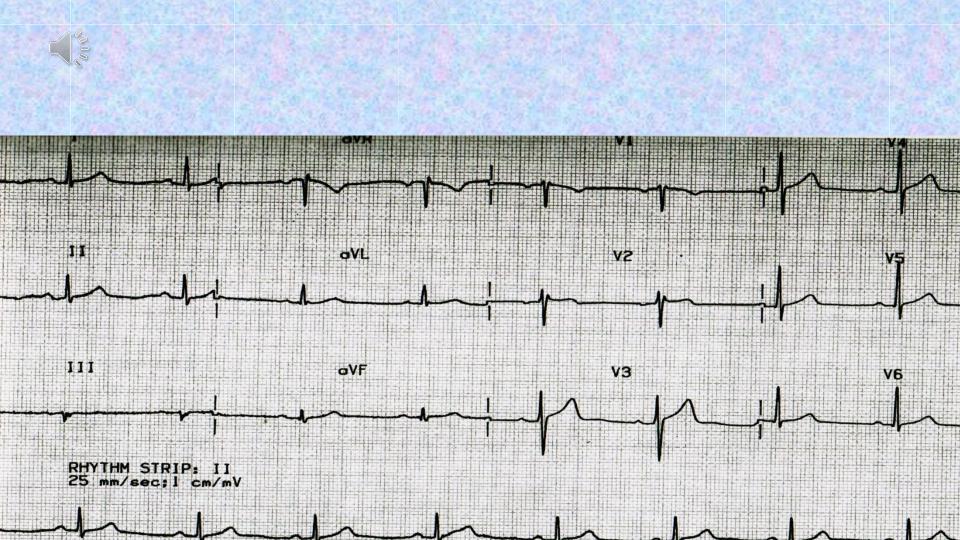
Left ventricular hypertrophy
-An increase in the amplitude of the R waves in V5 and V6 (it is higher than in V4), and S in V1 and V2, R in I and R in aVL.
-QRS width grows = 0.10 - 0.12 s
-Deviation of the electrical axis of the heart to the left (angle α <0º). R I> R II> R III, high R in lead I and deep S in III.
-An increase in the time of internal deviation in V5, V6 leads (from the beginning of the R wave to its apex)> 0.05 s.
-With severe left ventricular hypertrophy: ST segment in I, AVL, V5, V6 below the isoline ("trough-shaped"), T is negative.
-Displacement of the transition zone to the right chest leads.
Sokolov - Lyon amplitude criteria.
R in I> 15 mm; R in I + S in III (or II)> 25 mm.
R in aVL> 11 mm.
R in V5 or V6> 25 mm.
R in V5 or V6 + S in V1 or V2> 35 mm.

left-ventricular hypertrophy