

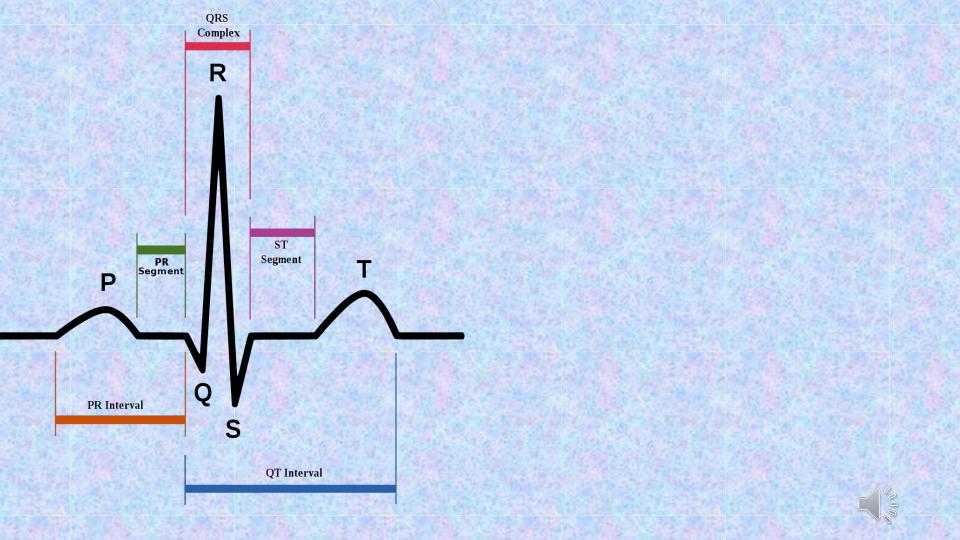
Generation of ECG waves and intervals:
P – depolarization of atriums,
QRS - depolarization of ventricles, ST,Т,U - repolarization of ventricles. The
QRS-T cycle corresponds to different phases of the ventricular action potential.

Длительность.
The duration of the waves, complexes and intervals
is the distance in mm multiplied by the division value (at a speed of 50 mm / s, 1 mm corresponds to 0.02 sec; 25mm / s - 0.04 sec.).
Высота.
The height of the waves (P, R, T) and depth (Q and S) are measured in millimeters and millivolts based on
I mv = 10 mm.
Other characteristics.
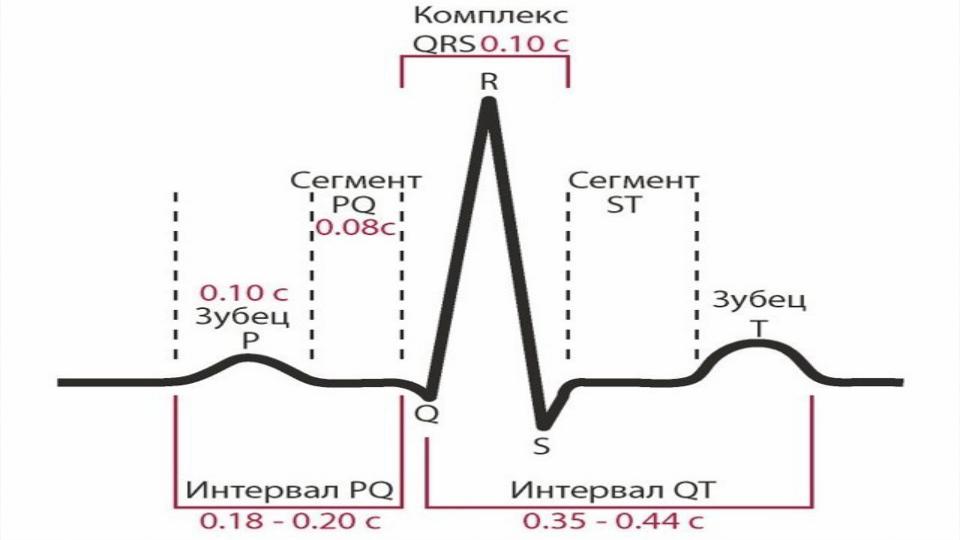
1)P ≤0.10 ≤2-2.5 (+) I, II, aVF, (-) aVR
may be (±) III, aVL, V1-2 2)PQ 0.12—0.20 - isoline
3)QRS 0.06—0.10 ≥5 all leads; 4)Q(<0.04 s, ≤2 mm) except aVR,V1-2 ;
transition zone (R wave = S wave) between V2 –V4
5)ST - - isoline (as rule); may be - (+)1 or
(-) 0.5 mm in aVL, aVF. aVR; 6)QT - 0.30—0.46

Interpretation of ECG
In the beginning of interpretation of ECG technical conditions of tape recording must be defined (voltage of the ECG and speed of a tape).
The ECG graph paper records the time (interval) between cardiac electrical events along the horizontal axis and their amplitude (voltage) along the vertical axis.
It is important for correct estimation of heart rate, amplitude and duration of ECG waves and intervals.
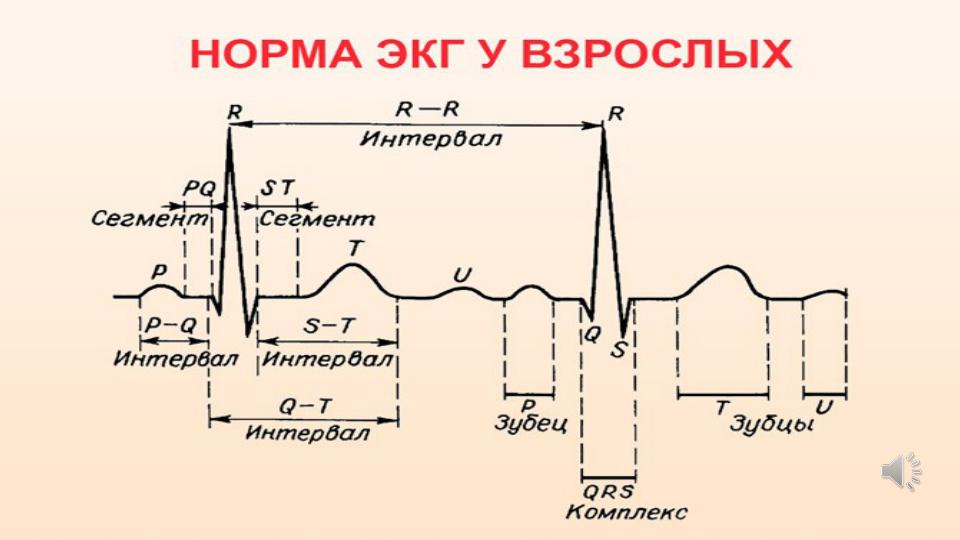

The sequence of ECG analysis:
1. Voltage of the ECG is estimated in compliance with standard size of
1 mv =10 mm. To that end, the amplitude of R waves is measured in standard leads. Normal amplitude is 5- 15 mm.
2. Speed of tape. If speed of tape is 50 mm/min – 0.02 s in 1 mm of
tape (width of QRS=3-4 mm). If speed of tape 25 mm/min – 0.04 s in 1 mm of tape (width of QRS=1-2 mm).
3. Regularity and pacemaker of the cardiac rhythm.
Since the sinoatrial node is the pacemaker of a normal heart, and the excitation of the ventricles is preceded by excitation of the atria, the P wave should come before the ventricular complex. The R-R intervals should be equal. Its fluctuations normally do not exceed 0.1 s. Greater variations in the length of the R-R intervals indicate disordered cardiac rhythm.
Sinus rhythm signs - Р-wave positive in II standard lead and corresponds (previous) to complexes QRS.

4. Heart rate (HR)
60 (seconds in 1 minutes) _____________
[R-R] (in seconds, i.e. to - in divisions х 0.02)
To that end, duration of one cardiac cycle (the R-R interval) and the number of such cycles in one minute length should be determined. For
example, if one cycle lasts 0.8 s, there will be 75 such cycles in a minute (60 : 0.8 = 75).
5. Analysis of myocardial conduction depending duration of:
-P wave (≤0.10-0.12 s)– intraatrial conduction;
-PQ interval (0.12-0.20 s) – conduction in atrioventricular node;
-QRS complex (0.06-0.10 s) - intraventricular conduction.
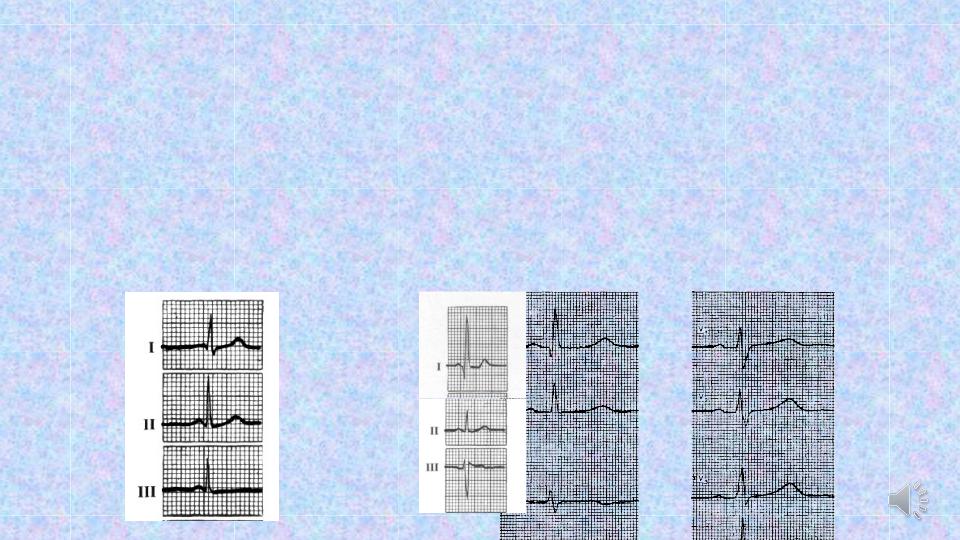
6. The position of the electrical axis of heart changes with changes of
the position of the heart in the chest. The relation between the electrical axis and the magnitude of the QRS complexes in standard leads is described by the so-called Einthoven triangle. The electrical axis of the heart is determined by the shape of ventricular complexes in standard leads:
-normal electrical axis - RII> RI> RIII;
-horisontal electrical axis (levogram)- RI> RII> RIII;
-vertical electrical axis (dextrogram) - RIII> RII> RI.

7. Analysis of waves and intervals. The length and size of ECG
elements (P wave, R-Q interval and QRST complexes) are then determined in those leads where the waves are the largest (usually in lead II).
Moreover, the direction of the P and T waves is determined (they can be positive and negative). Smaller and split waves can be present as well. Additional waves can appear.
The shape of the ventricular complex in all leads is thoroughly examined, character of the S-T interval is noted (see Table 9-2).
The length of the QRST complex (Q-T interval) depends on rate: the higher the rate, the shorter the interval.