

Mechanical Properties of Ceramics and Composites
.pdf570 |
Chapter 9 |
The issue of possible microcracking in composites of SiC whiskers in Al2O3 is important, since there is substantial difference in expansion, and composites of SiC platelets in Al2O3 clearly exhibit cracking (discussed below); moreover there are indications of cracking in composites with SiC particles, as was discussed earlier. Tiegs’ [85] observation above of spontaneous cracking with whiskers 2 m dia. is an important example. Sato and Kurauchi [88] reported that composites of Al2O3 with 25 v/o SiC whiskers 1.5 m long and 0.5m dia. showed substantial acoustic emission on cooling from heating to 600°C, with this increasing substantially as the maximum heating temperature before cooling increased. They indicated that such cracking was indicated by a basic analysis, e.g. reflecting the substantial axial Young’s modulus of the whiskers of700 GPa.
Consider now issues of matrix grain size on strength. Increasing Al2O3 grain size was shown to increase toughness across the range of SiC whisker additions, e.g. by 20+% on going from G = 1–2 to 4–8 and then to 15–20 m [87]. However, Ikeda and Kishi [89] showed that composites of 10–20 w/o SiC whiskers (or platelets or both) in an Al2O3 matrix all exhibited strengths decreasing linearly versus G-1/2 across the range of resultant G values of 1.5 to 15 m. The decreases in strength from 400–600 to 100–200 MPa are consistent in both absolute values and relative changes with those of pure alumina (e.g. Figs. 3.13, 3.14). Such grain size effects are clearly a dominant factor in the variations in starting strengths, i.e. with no whiskers ranging from 250 [51] to 550 [83] MPa. These results are in contrast to increased toughness of whisker composites as the Al2O3 G increased [90,91].
Strengths of Al2O3-SiC whisker composites generally increase as φ increases, similar to, but often < the relative increases of toughness, especially at higher whisker contents, due at least in part to processing defects (Section IV). The ratios of strength to toughness generally increase with φ and they usually pass through a maximum at various values of φ depending on the whiskers and processing, as was previously shown by Rice [32] (Fig. 9.16). Except for some low ratios, mostly at lower or higher relative φ values, reasonable flaw sizes are indicated, as are minimum flaw sizes for the maximum ratios.
Composites of SiC whiskers in other oxide matrices also predominantly show strength increasing with increasing SiC whisker content. However, as previously shown by Rice [32], strength-to-toughness ratios generally continuously decrease as φ increases, with indicated flaw sizes being reasonable for half or more of these composites. Wadsworth and Stevens’ [92] study also corroborates the effect of whisker character on strength as for toughness, e.g. strength increasing with increasing diameter (from 0.7 to 1.2 m). One exception to this trend for increased strength as φ increases in other oxide matrix composites with a TZP matrix, was shown by Zhang et al. [93] and Yang and Stevens [87] who showed respectively strengths decreasing from 1150 to 850 MPa from φ = 0 to

Particle Dependence of Tensile Strength |
571 |
FIGURE 9.16 Strength-to-fracture toughness ratio for various A2O3-SiC whisker composite investigations. Note the approximate flaw sizes shown by the righthand scale. (From Ref. 32. Published with permission of Ceramic Engineering and Science Proceedings.)
0.25 (with most decrease between φ= 0.15 and 0.25) and from 1050 to 850 MPa from φ= 0 to 0.2 (with the decrease fastest at low φ). Zhang et al. showed (NB) toughness increasing linearly over the φ range, but the high toughness levels result in somewhat larger than likely flaw sizes. Yang and Stevens cite both larger matrix grain size in the composite and mismatch stresses between the whiskers and the matrix, and implied possible microcracking, as sources of the decreased strengths in the composite.
Turning to composites of Si3N4 with SiC whiskers, Rice [32] showed that these had at best limited strength increases, and more often progressive decreases in strengths as φ increased. This in turn results in significant decreases in strength-to-toughness ratios, and thus frequent larger than likely calculated flaw sizes as φ increases, e.g. to hundreds of microns or more. Neergard and Homeny
572 |
Chapter 9 |
[94] showed that BN coated SiC whiskers gave lower strengths than uncoated ones. Olagnon et al. [95] reported a probable but modest maximum of strength of900 MPa at 15 v/o whiskers, up from 700+ MPa with no or 20 v/o whiskers. This was somewhat inconsistent with I toughness (for cracks perpendicular to the whisker orientation) showing a clear increase only at the highest whisker content of 20 v/o (and apparently no dependence on whisker content for crack propagation parallel with the whisker orientation). Rossignol et al. [96] similarly showed that strength increased from 800 to 950 MPa, with limited or no SENB toughness increases for 30 v/o SiC whiskers. They also showed extensive R- curve effects that commenced at smaller crack sizes and increased faster than for the Si3N4 alone, e.g. at crack lengths of 1.5 mm versus 2.5 mm, and substantial effects of different whisker sources. Fusakawa and Goto [97] showed that while fracture energy nearly doubled on addition of 30 v/o SiC whiskers, strengths decreased 5%.
Other, more recent studies show modest to negative results with other nonoxide matrices: NbC [98], B4C [99], TiB2 [100,101], and TiC [102]. NbC gave strengths increasing 70% from 500+ to 900 MPa (versus 20 % increase in toughness) as φ increased from 0 to 0.3 with reasonable calculated flaw sizes, but with slightly lower results as whisker diameter doubled from 0.45 to 1 m. B4C gave an 10% increase in toughness and a modest ( 20%) maximum of strength (φ 01–0.2) over the same φ range, with some indicated reduction of values with somewhat smaller whiskers. TiB2 matrices showed mixed and modest changes in toughness and strength over the same φ range. TiC gave similar modest (both) effects or substantial strength decreases with limited toughness changes [102]. In all cases except that with B4C, reduced grain growth due to whisker additions were cited as a factor in strength increases, especially at lower whisker levels.
Dusza et al. [103,104] reported that hot pressing of Si3N4 with additions of 10 or 20 w/o Si3N4 whiskers (+ Al2O3 + Y2O3 densification aid) gave respective average strengths of 690 and 510 MPa, though both had essentially the same (IF) toughness of 6.3 MPa·m1/2. The discrepancy in strengths was attributed to observed increased fracture initiation from whisker agglomerates or associated pores at the higher whisker loading.
Much less strength data is available for platelet composites, in part because there is much less development and because some investigations do not address strength, even though toughness was measured. Chou and Green [105] reported that composites of Al2O3 with 10 v/o of smaller ( 12 m dia.) SiC platelets had strengths 1/3 < the Al2O3 only, and strength increased only a limited amount with increased platelet additions to 30 v/o, in contrast to 50% increases in toughness. Composites with larger SiC platelets by 2, which resulted in spontaneous cracking and substantial decreases in E, as was noted earlier (Chap. 8, Sec. IV.D), suggest that stress-induced cracking may be a factor in the strength loss.
Particle Dependence of Tensile Strength |
573 |
Mitchel et al. [106] reported that composites of Al2O3 coated SiC (20 v/o) platelets in a SiC matrix had strengths 10–20% higher that the matrix alone without the nearly 50–100% anisotropy found in toughness. Naschik et al. [107] reported strengths of composites of mullite matrices with 10 v/o SiC platelets ( 10–25 m dia.) typically decreasing by up to 50% below that of the matrix alone despite toughness increases of up to 20%. Strength increases of 10–20% were obtained in some cases (with similar toughness increases) when the platelets were oxidized to enhance platelet–matrix bonding.
Strength behavior of composites of aluminas with in situ formed platelets, whose toughnesses were discussed in Chap. 8, Sec. IV.D, are important to consider along with data for alumina bodies with elongated, platelike grains. While Chen and Chen [108] reported that in situ formation of various hexaluminate platelets with overall dimensions similar to those of the matrix Al2O3 grains (e.g. 2–15 m) resulted in a maximum toughness of 4.3 (versus3.0 MPa·m1/2 for the martix alone) at 30 v/o aluminate, no strengths were reported (and E decreased continuously from 420 GPa at 0 v/o to 230 GPa at 100 v/o aluminate). While Yasuoka et al. [109] reported similar but greater increases in (SEPB) toughness from 3.5 to 6 MPa·m1/2 by in situ growth of hexaluminate platelets combined with inducing some platelet character of the Al2O3 grains via doping of 240 ppm SiO2, their strengths did not follow toughness trends. Thus small additions reduced G from 5 to 2 m, increasing strengths from 420 to 660 MPa with no change in toughness, while increased additions increased G and introduced platelets, while increasing toughness to 4.1 and then 6 MPa·m1/2 with respectively, no clear increase in strength and a modest (6%) but clearer strength decrease occurred (accompanied by increased intergranular fracture and hence grain bridging). While Kim et al. [110] reported nearly identical (I) toughness increases, maxima (at 1 m/o), and subsequent modest decreases in Al2O3 doped with 0.5 to 3 m/o Na2O + MgO to grow in situ beta alumina platelets, strength increased to a more pronounced maximum at 0.5 m/o, with some and possibly most of this due to G reduction. Koyama et al. [111] reported that (CNB) toughness of Al2O3 with platelet grains due to low additions of CaO + SiO2 increased ( the same as found by Yasuoka et al.) with either the diameter (d) or the thickness (t ) to the 1/2 power (or d 5/6t-1/3), which was also true for the lesser increases as G increased in bodies with equiaxed grains. However, as noted earlier (Chap. 3, Sec. III.A), strengths of both bodies with platelet grains and those with equiaxed grains both increased as toughness deceased. Similarly, An and Chan [112] showed that in situ formation of 30 v/o Al2O3·CaAl12O19 platelets in Al2O3 increased toughness but at the expense of strength, which they acknowledged was inevitable and is now being increasingly recognized (Sec. III.E). As was discussed in Chap. 3, Sec. III.A, data for the above bodies generally agrees with that for other alumina bodies based on their grain sizes.
574 |
Chapter 9 |
Baril et al. [113] reported that their composites of Si3N4 with 0–30 v/o SiC of smaller platelets ( 11 m) had strengths of 800 MPa independent of the v/o platelets, except for a 5–10% decrease at 30 v/o platelets, while use of larger platelets (17 m) had strengths of 700 MPa that decreased at 20 and more at 30 v/o platelets, the latter by 10–15%. This was in contrast to the linear increase in CNB toughness from 6.4 to 8.1–8.8 MPa·m1/2 for 0–30 v/o, with a trend for slightly higher toughness with larger platelet sizes. This toughness increase was similar to, but substantially greater than, that of elastic moduli (10–15%). Fusakawa and Goto [97] showed that addition of up to 30 v/o SiC (10–20 m dia., 1 m thick) platelets to Si3N4 increased fracture energy by an additional 40% over that produced by such additions of whiskers, but strengths decreased with increased additions, e.g. by 40% versus 5% with whiskers. While simultaneous addition of SiC platelets and whiskers gave even higher fracture energies and increased toughnesses over those achieved with platelets alone, toughness still decreased by up to 10–15%, and strengths decreased as much as, or more likely somewhat more than, with platelets alone. The significant strength reductions with platelet additions were attributed to large surfaces of them frequently acting as fracture origins.
Kellet and Wilkinson [114] fabricated Al2O3-graphite flake/platelet composites via filter pressing or tape casting and then hot pressing, showing that flexure strengths of bars with tensile surfaces parallel to the plane of pressing were 2/3 those with tensile surfaces normal to the plane of hot pressing. Coarse ( 75 m dia.) platelets gave strengths 30–45% lower than fine platelets ( 4 m dia.). Strengths decreased with increasing graphite and pore contents, and the authors noted that both had similar effects on strength (as was also suggested for effects of BN flake/platelets, Chap. 11, Sec. III.E). This similarity is supported by the slope of a semilog plot of their strengths versus the sum of the volume fractions of porosity and graphite being 3.6 for the fine and 3 for coarse graphite, i.e. similar to the dependence of E for composites with BN platelets (Fig. 8.13). Ozgen and Bond [115] studied alumina–graphite refractory bodies made with fine (50–150 m dia.) or coarse (350–420 m dia.) graphite flakes made with 3/4 coarse (250–420 m dia.) and 1/4 finer (< 50 m dia.) fused alumuna grain and silicate-based binder and 20 v/o porosity. Their strengths were only 3–5% those of Kellet and Wilkinson, reflecting the larger sizes of the graphite and alumina as well as the porosity and the binder, and had a greater rate of decrease with increased graphite content, e.g. a semilog slope of 5.6, reflecting expected less graphite preferred orientation.
Naschik et al. [107] showed that addition of 5–20 (mostly 10) v/o SiC platelets ( 10–25 m dia., 1 m thick with various surface treatments) to mullite did not significantly increase, and most commonly reduced, strength, e.g. with reductions up to 50%, despite more frequent increases in toughness, e.g. by 20%. Fracture surfaces showed substantial fracture through
Particle Dependence of Tensile Strength |
575 |
large sections of individual platelets, or even larger fracture areas along the platelet–matrix interfaces.
Chaim and Talanker [116] reported bend strengths of their composites of α-SiC platelets (50–250 m dia., 5–25 m thick) in a cordierite glass matrix as generally similar to their NB toughness dependence on composition, i.e. a rapid initial rise and then much less increase. Strengths increased from 120 MPa at 0 v/o to 160 MPa at 10 v/o SiC for crack propagation parallel to the hot pressing direction, i.e. somewhat <the 50% increase in toughness, followed by no increase or a limited decrease for 20 and 30 v/o SiC, in contrast to 10–15% increases for toughness. Strengths for crack propagation normal to the hot pressing direction gave similar trends, i.e. like those for toughness, but again somewhat less. On the other hand, crystallization of the glass matrix, while giving somewhat higher toughnesses versus no crystallization, resulted in strengths decreasing from 130 MPa at 0 v/o SiC to 110 and 90 MPa at respectively 10 and 20 v/o SiC.
F.Ceramic Eutectic Composites
Results for composites made from eutectic particles of Al2O3-ZrO2 were discussed in Sec. III.B.2. Limited results of composites made by directional solidification of eutectics are addressed here. Earlier work by Hulse and Batt [117] on Y2O3-ZrO2, CaZrO3- ZrO2, MgO-CaO, and Al2O3-ZrO2(Y2O3) reported strengths for stresses parallel to the solidification direction of commonly 300–700 MPa, with the highest strengths for the latter system (Fig. 11.11). Limited or no effects of solidification rate and resultant changes in fiber spacing were reported (other than possible effects of high thermal stresses) indicating that colony structure dominated. Mah et al. [118] also reported similar strengths, i.e. 370 MPa, for directionally solidified Al2O3-Y3Al5O12 (YAG) eutectic, but again colony structure ( 200 m) probably was a dominant factor limiting strength.
Bradt and colleagues [119–121] also measured strengths of directionally solidified eutectics, mostly parallel with the solidification direction. Strengths of160 MPa across the range of solidification rates used were reported for ZrO2- MgO eutectic specimens. The lack of effects of growth rate, which had the normal inverse relation to fiber spacings, was attributed to strengths being controlled by the essentially constant colony structure size ( 230 m). Effects of residual stresses were indicated by increases and decreases in strengths on annealing. Similarly, no clear variation of strengths of MgO-MgAl2O4 with solidification rates and resultant MgO fiber spacings (of 1 to 4 m) were observed, which was again attributed mainly to the presence of a nearly constant colony size ( 400 m), as well as some possible contributions of residual stresses and cracking. However, some anisotropy was observed, e.g. strengths for stressing normal to the solidification direction were 3/4 those for stressing parallel to it,
576 |
Chapter 9 |
and distinct effects of fiber spacing on hardness were observed (since indent sizes were < the colony size, Chap. 10, Sec. III.A). Significant effects of fiber spacing are also indicated in tests of ZrC-ZrB2 and ZrC-TiB2 directionally solidified composites in other mechanical properties, though strengths were not measured [121].
G.Ceramic–Metal Particulate and Wire Composites
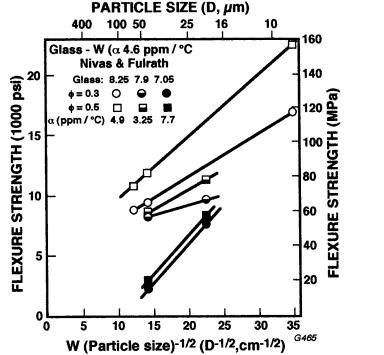
Nivas and Fulrath [122] reported that composites of glass matrices with dispersions of 10– ≥ 50 v/o of spherical W particles (20–70 m) all followed the behavior shown in Fig. 9.1, but which varied significantly as a function of the thermal expansion differences. For a glass with an expansion that of W, the observed intersection of the two σ–λ-1/2 lines was at flaw sizes of 50–57 m as respectively observed and calculated. Also the slope of the strength increase as λ-1/2 increased was again nearly the fracture toughness of the glass (again reduced 30%, since λ is a diameter and c a radius), as was found for similar composites with dispersed Al2O3 particles (Sec. III.A). Glasses with expansions 1.3 ppm/°C < or 3.1 ppm/°C > that of W gave similar bilinear trends but with respectively somewhat larger observed and calculated flaw sizes, 64–74 m and 80–92m and substantially and even greater reduced slopes of the portion of increasing strength versus λ-1/2. This translated to progressive decreases in strengths of respectively 100, 70, and 55 MPa as the absolute difference in expansion increases. However, strengths decreased as the expansion of the dispersed particles exceeded that of the matrix and as the size of the dispersed particles increased due to their increasingly acting as voids due to lack of bonding to the matrix. While the pores caused strength reductions, there can still be some toughening due to the pore–particle combinations that limit strength losses, e.g. see Biswas [123]. However, note that this data clearly shows a definite D-1/2 dependence (Fig. 9.17), reflecting effects of v/o W and glass matrix character. The lack of a higher D dependence at larger D is attributed to flaw sizes being at or beyond the larger particle sizes.
Turning to finer dispersed particle sizes, Yun and Choi [124] showed that addition of up to 20 v/o of W particles (up to nearly 1 m) results in a continuous strength decrease to 30%, i.e. opposite of their (I) toughness values, which increased > 50%. These changes in properties were accompanied by x-ray measured compressive stresses (radial to the W particles) that increased from 70 to100 MPa as the v/o W increased from 5 to 20%. Sekino et al. [125] dispersed Ni particles in Al2O3 by reduction of either fine particles of NiO or of solution dispersed Ni(NO3) giving Ni average particle sizes of respectively 100–224 and 50–130 nm, where the first value in each set is for intraand the second for intergranular particles, the latter particles being 66 and 82% of the particles respectively for the larger and the finer particles. Both dispersions resulted in
Particle Dependence of Tensile Strength |
577 |
FIGURE 9.17 Strength of spherical W particle–glass matrix composites versus the inverse square root of the W particle size for volume fractions (φ) of 0.3 and 0.5 tested at 22°C. Note designations of the three different glass matrices used by their strengths (in 1000 psi) as glasses without any W particles and thermal expansion. (From Ref. 122.)
significant strength maxima of respectively 1.09 and 0.99 GPa for the finer and larger particles, with both decreasing back to the strengths without Ni particles of 700 MPa at 20 v/o Ni. This was in marked contrast to very limited but continuous (I) toughness increases as φ increased. Similarly Nawa et al. [126] showed that while addition of 5–20 v/o Mo particles (< 0.2 to > 1 m) continuously increased (IF) toughness from 3–4.3 to 4.3–7.7 MPa·m1/2 as φ increased, strengths continuously decreased from 570–880 to 570 to 400 MPa, i.e. opposite to each other. Strengths increased as the grain size was reduced (i.e. consistent with data of Fig. 3.14) as a result of increased Mo addition, decreased hot pressing temperature, or both, while toughness increased as G increased, i.e. again opposite to strength, similar to frequent opposite G dependence of these properties in monolithic Al2O3 (Chaps. 2 and 3).

578 |
Chapter 9 |
Pyzik and Beaman [127] formed composites from in situ reaction of B4C- Al which give complex composites of either discontinuous or continuous B4C structures, with the latter giving higher strengths, e.g. by 20–50%, while (CNB) toughness showed an opposite trend.
Continuing with composites with continuous metal phases, i.e. mainly cermets, consider WC-Co bodies. Rice [32] reviewed the microstructural dependence of toughness (Chap. 8, Sec. IV.F) and strength, the latter showing strengths generally increasing as the WC grain size decreases, the opposite of toughness. This opposite trend is also seen in the ratio of strength to toughness (Fig. 9.18), which also indicates reasonable calculated flaw sizes and a trend for them to be finer at intermediate Co compositions, i.e. where strength and toughness are both high.
Next, consider results of Donald and McMillan [128] for hot pressed composites of chopped Ni wire 3 mm long and 0.05 or mostly 0.125 mm dia. in
FIGURE 9.18 Strength-to-fracture toughness ratio of WC-Co bodies as a function the volume percent (v/o) Co for various WC grain sizes (numbers next to curves or data points, where there is a bar for the range of data, the grain sizes for the higher and lower strengths are shown at the respective ends of the bars). (From Ref. 32. Published with permission of Ceramic Engineering and Science Proceedings.)
Particle Dependence of Tensile Strength |
579 |
glass matrices having an expansion of 8.3 ppm/°C < that of Ni, the same expansion, or 1.7 ppm/°C > that of Ni. Normal flexural strengths of the composite with the lower expanding matrix dropped precipitously from 220 MPa at 0 v/o to 70 MPa at 1 v/o Ni (with an apparently somewhat slower and less drastic but still substantial decrease, e.g. to 100 MPa with the finer Ni wires segments) and then steadily increased, e.g. to 140 MPa at 30 v/o. Composites with matched expansions started from the same strength, decreased much more slowly to a minimum strength of 110 MPa at 20 v/o Ni, and then increased to 160 MPa at 30 v/o (and to 180 MPa at 40 v/o Ni). Composites with the highest expansion glass behaved very similar to those with matched expansions, except that they showed very little increase in strength beyond the minimum at 20 v/o Ni. Strength behavior of the composite with matched expansions was quite similar to its Young’s modulus dependence (Chap. 8, Sec. III), except that the maximum loss of E was 40% versus 70% for strength. There was also similarity between the strength and E dependences for the other two composites, but with greater strength decreases to lower minima relative to those for E. Also, the increased strength for the lower E glass past the minimum was much greater than that for E, while the reverse was indicated for the composite with the higher expansion glass. These strength trends for normal testing (without notches) were similar to results of flexure testing of specimens with notches, except that the strengths of the pure glasses were much lower ( 70–85 MPa), and strengths increased steadily with increasing v/o Ni, typically more so at higher Ni contents, reaching similar levels at higher loadings as for unnotched specimens. This behavior of notched specimens was quite similar to that for work of fracture (measured from the area under the load-deflection curves) with or without notches, and thus was quite different from the unnotched strength behavior at lower Ni loading.
Zwissler et al. [129] showed that finer (6, 12, or 25 m dia.) stainless steel chopped wires hot pressed in an FeO matrix increased strengths over the range investigated (0–15 v/o) at a rate of up to twice the rate of increase of Young’s modulus and consistent with toughness increases (due mainly to wire bridging in the crack wake). The contrast in these trends with those of Donald and McMillan above are probably due to much less or no cracking in the former composites due to the combination of finer wire size, limited expansion and E differences, e.g. the steel wire expansion was only 14% > that of the FeO. Simpson and Wasylyshyn [130] hot pressed up to 12 v/o Mo wires (3.16 mm dia.) in an Al2O3 matrix, which made large (up to 250-fold) increases in the work of fracture, but ultimate strengths were reduced, e.g. by 20–25%, probably due to some cracking. Brennan [131] hot pressed 25 v/o continuous Ta wires (0.63 or 1.27 mm dia.) in a Si3N4 matrix, obtaining flexural strengths of 550–700 MPa (and fourfold increases in Charpy impact strengths). However, tensile strengths were only170 MPa, apparently due to cracking not seen in the flexure tests due to the