

Mechanical Properties of Ceramics and Composites
.pdf490 |
Chapter 8 |
than the Al2O3 ( 50 m spherical, or 50 or 12 m angular) particles. All combinations increased toughness as φ increased to 0.3, typically by threefold, but with somewhat higher and more varied increases with irregular versus spherical and larger versus smaller angular particles.
Lange [30] measured (DCB) fracture energies for his composites of Al2O3 particles in a glass matrix with very similar expansion to that of the Al2O3 particles that were of finer sizes averaging 3.5 and 11 m (and irregular in shape) and larger ( 44 m) spherical. Fracture energies increased with increasing φ, and generally with increasing D, especially at the largest D where increases were nearly fivefold those of the glass itself. He showed that the fracture energies were linear as a function of the mean free particle spacing (λ) per Eq. 9.1 and were generally consistent with his line tension model (Fig. 8.4).
Carlström et al. [77] reported fracture toughnesses of alumina-containing electrical porcelains using three indentation techniques (IF, I, and a modified IF technique) giving respective average values of 1.1, 2.1, and 1.5 MPa·m1/2 (with coefficients of variation of 10% or less). Such values are 50–200% higher than for similar silicate glasses alone, e.g. 0.7 MPa·m1/2. Some of this increase may be due to microcracking, indicated by microscopic and acoustic emission techniques, associated mostly with the quartz particles, e.g. Kirchhoff et al. [100] showed that while microcracking is dependent on thermal history as expected, it follows the expected decrease with decreasing quartz particle size. Thus finer particles required greater cooling to cause microcracking, e.g. 1 m particles had extensive acoustic emission on cooling to 300°C, while 0.6 m particles required cooling to 100+°C. On the other hand, Banda and Messer [101], who give (NB) toughness in terms of starting quartz particle sizes, showed toughnesses of
2 MPa·m1/2 at starting particle size (D) of < 20–25 m which then drop rapidly
to 1/2 these values by D 50 m, the drop (of both toughness and strength, Fig. 9.4) possibly corresponding to serious microcracking.
Beall et al. [102] obtained different toughness values by different techniques in a crystallized glass, where much of the toughening was attributed to
microcracking from the monoclinic canasites crystals (Ca5Na4K2Si12O30F4), as is indicated by the marked toughness decrease as test temperatures increased (Fig. 11.1). NB tests gave 4.4 MPa·m1/2, while IF values started at 2 MPa·m1/2 at smaller crack sizes but reached the NB level and were constant for crack sizes ≥ 200 m, while I values started at 1 and saturated at crack sizes of ≥ 200 m at
1.8 MPa·m1/2. Baik et al. [103] reported (I) toughnesses of a glass crystallizing to yield flurophlogopite crystals of 1.2 to 2.2 versus 0.8 MPa·m1/2 for the parent glass. Anusavicé and Zhang [104] reported toughnesses (IF) in the range of
1.5–2.5 MPa·m1/2 in a LiO-Al2O3-CaO-SiO2 glass that yields a complex crystallized structure and very high (95%) levels of crystallization.
Hing and McMillan [105] measured (NB) fracture energies and other properties of a glass giving Li2O·2SiO2 crystallites giving values from 17 J/m2
Particle (and Grain) Effects |
491 |
for the starting glass to 100 J/m2 generally increasing as φ increased from 0 to 0.35–0.67. They showed that these values also increased linearly as a function of λ-1, where λ= the mean spacing between crystallites, noting that this correlation was functionally consistent with the line tension model (Fig. 8.4) but noted that this mechanism of toughening was inadequate to account for the sixfold increase in fracture energies. They did not comment on the translation of these energy values into fracture toughnesses of 1 to 3.5 MPa·m1/2 using their E values (measured from deflections during flexure strength testing, which appear to be low by 30–40% across the range of values reported, Chap. 9, Sec. III.A). Cook et al. [80] also indicated substantial increases in toughness due to crystallization of a similar LiO2-SiO2 glass, showing that I toughness values increased 20–30% (as did strengths) as the size of the highly elongated crystallites increased (from equivalent radii of 2.8–6.7 m) and λ nearly doubled from 1.2 to 2.3 m as φ decreased from 0.33 to 0.2. Earlier, Morena et al. [106] also showed ≥ increases in toughness of a crystallized cordierite glass (Pyroceram 9606®) over the parent glass. They also showed their I toughness values increasing with increases in both crystallite size, D, and λ, both from 0.5–1.5 m, but only at higher indent loads (e.g. > 2–5 N). Govila et al. [107] measured a low fracture energy of 2.2 J/m2 (i.e. a toughness of 0.6 MPa·m1/2 for their crystallized lithium aluminum silicate (LAS) glass (grain size ≤ 1 m) via indent fracture with flaws 10–100 m. The low values appear to reflect fracture mainly through the glass phase, and less decrease in indented strengths at larger flaw sizes suggest a trend for increased toughness at larger crack sizes.
Hasselman et al. [108] later followed up on the above indent crack size dependence of toughness in composites of 0–35 v/o of Al2O3 spheres (25 ±5 m) in borosilicate glasses of 75 m/o SiO2 with B2O3/Na2O molar ratios adjusted to give thermal expansions relative to that of Al2O3 of +2.7,+ 0.7, or - 3.7 ppm/°C. They showed all three starting glasses showed crack sizes uniformly increasing as indent load increased to give nearly identical toughness values independent of crack size as expected. However, the composites showed distinct breaks in such crack–load curves indicating a region over which crack sizes being introduced were constrained, which corresponded to toughness being first independent of load and then increasing with load and then saturating (i.e. an R-curve-type effect). They noted that this region of changing crack size–toughness behavior corresponded to the region over which the crack size and the mean free path between the Al2O3 particles (λ) were equal and is thus consistent with earlier work indicating strengths being a function of λ-1/2, due to such constraint of cracks by the spacings between particles (Chap. 9, Sec. III.A). However, note that such λ correlation can reflect other mechanisms, e.g. correlation with the volume fraction dependence of E (see note at the end of this chapter).
Wolf et al. [109] reported that composites of 75 v/o Al2O3 particles in glass matrices (e.g. for dental purposes) had (I) toughnesses of 4 MPa·m1/2 over a
492 |
Chapter 8 |
range of glass expansions from 2 ppm/°C less than to that of alumina, with a few percentage decrease as the expansions approached each other. These toughness values were > three times those measured for the glasses themselves (and three times those cited for similar porcelain compositions, which correlated with strengths of the studied bodies being nearly three times those of the similar porcelains cited, consistent with the finer size of the often somewhat tabular Al2O3 particles, 0.3 to 10 m).
B.ZrO2 Toughened Ceramic Composites
Transformation toughening of ZrO2 is manifested in ZrO2 bodies composed entirely of fine grain (e.g. a few m) tetragonal ZrO2 (referred to as TZP) or of a cubic stabilized ZrO2 matrix with fine dispersed tetragonal particles (typically obtained by precipitation heat treatment, resulting in larger, e.g. 50 m grains, with submicron precipitates isotropically and uniformly distributed within the grains, but often with some excess at grain boundaries). These, especially TZP, bodies were discussed mainly in Chapters 2 and 3. However, a very common use of this mechanism is to incorporate ZrO2 particles in a matrix of some other composition, with Al2O3 being a particularly important and common one due to its high Young’s modulus and other attractive properties, uses, and costs, and hence the focus of this section.
The φ for a toughness maximum probably varies with the matrix composition, but the dominant factors are the size and composition, i.e. degree of stabilization, of the dispersed ZrO2 particles. Thus Claussen’s original study [16,110] of ZAT showed that both the φ value of the maximum and its toughness level increased as the unstabilized ZrO2 particle size decreased (Fig. 9.5), with the maximum for ZrO2 particle sizes averaging 1+ m being at φ 0.15. However, Becher’s study [16,111] using sol derived unstabilized ZrO2 that was finer (≥ 1 m) in size and much more uniform in both size and spatial distribution showed the toughness (fracture energy) maximum at φ 0.1–0.12 (Fig. 9.6). Lange [112] subsequently corroborated that the toughness maximum for fine unstabilized ZrO2 was at φ 0.1. He also showed that both the level of the toughness and the φ value at which it occurs increased as the degree of partial stabilization was increased, with the maximum toughness and φ being those of TZP, i.e. φ= 1(Fig. 9.7).
While the primary toughening mechanism in ZrO2 toughened bodies is transformation, microcracking can also occur and was proposed as a major source of toughening in ZTA composites [113–116], since larger, less stabilized, and higher volume fractions of ZrO2 particles can result in substantial microcracking. Ono et al. [37] showed that additions of totally unstabilized ZrO2 to Al2O3 resulted in essentially identical toughness increases as with additions of ZrO2+ 3 m/o Y2O3 as the ZrO2 additions increased, except that the unstabilized
Particle (and Grain) Effects |
493 |
ZrO2 additions reached a maximum (I) toughness of 6.5 MPa·m1/2 at 50 w/o ZrO2 (from 2.5–3 MPa·m1/2 with no ZrO2), while ZrO2+ 3 m/o Y2O3 additions continued to increase toughness to a maximum of nearly 8 MPa·m1/2 at 70–80 w/o ZrO2. Lutz and colleagues [117–119] used this to produce bodies of much higher thermal shock resistance (Chap. 11, Sec. III.C). However, the unusual crack propagation in the duplex composites they made, partly by design and partly by chance, in bodies having a dispersion of particles of mixtures of monoclinic ZrO2 + Al2O3 in TZP matrices, depended significantly on limited quantities of porosity left from sintering, which is of interest here. They dispersed, in powder of the selected TZP composition, agglomerates of the selected ZrO2 + Al2O3 composition formed by spray drying and then HIPed or sintered the dual composite with the intent of obtaining a duplex population of microcracks, e.g. like that sketched in Fig. 8.2C. The unexpected result was that HIPing, which gave little or no residual porosity, did not produce any significant amount of microcracking or the resultant desired toughening, but sintering, which left some porosity in the dispersed ZrO2 + Al2O3 ( 20–60 m dia.) particles, resulted in substantial microcracking zones along with substantial R-curve effects. As revealed by dye penetration, such zones were up to 1–3 mm wide about the mean paths of macrocracks. As microcracking increased, R-curve effects and fracture toughness and residual strengths after serious thermal shocks all increased, but initial strengths decreased substantially, e.g. from 1300–1700 MPa to 100–800 MPa [118,119]. The specific mechanisms by which the limited porosity plays such a key role in the microcracking scale is not known, but this indicates that such effects, e.g. possibly similar to those schematically suggested in Fig. 8.1B, deserve investigation. Finally, some bodies processed from melt processed eutectic particles indicate possible unique crack bridging effects [116].
Finally, while much of the toughening in composites with dispersed tetragonal ZrO2 particles is from transformation of the ZrO2 particles to the monoclinic phase, and this may be partly replaced, or supplemented, by microcracking, there are other effects to complicate the picture. These include other phases, e.g. possible nontransforming noncubic phases and possible metastable cubic phases, which are topics beyond the scope of this book. However, an important added factor central to this book is effects of dispersed ZrO2 in addition to or instead of transformation and microcracking, since the presence of such particles can still in principle cause other toughening such as crack deflection, bridging, or branching. Thus Ruf and Evans [41] reported that addition of 20 v/o monoclinic ZrO2 particles increased (I and NB) toughnesses of ZnO by 70%, with progressively less but still substantial toughening as 4 and 8 w/o Y2O3 were added to the ZrO2. Based on acoustic emission, microcracking was ruled out, while crack deflection and bowing were suggested based on fractography. Further, Langlois and Konaztowicz [120] have subsequently reported 100% increases in toughness (and strength, Chap. 9, Sec. III.B) of Al2O3 with 30 v/o cubic ZrO2 particles. Other
494 |
Chapter 8 |
important evidence of dispersed ZrO2 particles causing toughening without transforming or microcracking is the substantial toughness retained in PSZ ZrO2 crystals with tetragonal precipitates as test temperatures increase to reduce and then eliminate any transformation, yet still have twice the toughness of fully stabilized crystals (Fig 6.6.).
Wang and Stevens [121] investigated Al2O3-ZrO2 composites of various microstructures using I toughness and strength measurements. Bodies fabricated with dispersions of individual, fine (~ 1 m) ZrO2 showed toughness increasing rapidly from 3 MPa·m1/2 at 0 v/o ZrO2 and then more slowly, reaching a limit of 7 MPa·m1/2 at 12–20 v/o unstabilized ZrO2. They also noted that increasing addition of ZrO2 increased the amount of intergranular fracture and decreased the Al2O3 grain size from 10 to 3 m (which, at least in part, accounts for increased intergranular fracture and the marked contrast to their strength trends, though the toughness levels are reasonably consistent with the strength levels). Bodies with addition of 2.5Y-TZP agglomerates (20–50 m) instead of the unstabilized ZrO2 particles, i.e. as a step in the direction of composites along the lines of Figure 8.2C, showed a linear increase in toughness starting at 20 v/o and reaching 6+ MPa·m1/2 at 40 v/o TZP, i.e. a slower initial increase with somewhat reduced toughness levels. Combinations of both types of ZrO2 dispersions lead to linear increases of toughnesses, reaching values of 11+ MPa·m1/2 at 40 v/o. They attributed toughening of the composites with unstabilized particles alone to transformation and microcrack toughening, that with TZP agglomerated alone to transformation and crack deflection, and all of these with both types of addition. The indicated presence of microcracking with all additions is consistent with the limited strengths (200–500 MPa) and indicates that the combined composite is a probable manifestation of either, or probably both, of those sketched in Figures 8.1B and 8.2C.
French et al. [38] showed IF toughness values decreasing linearly as the content of stabilized, cubic ZrO2 (+ 8 m/o Y2O3) increased in very similar fashions for their E values (Sec. III), but the ratio of the end ZrO2 and Al2O3 was higher for toughness, i.e. 0.76 for toughness and 0.6 for E. They also noted that there were no R-curve effects, which was consistent with the fine grain and particle sizes (about 5 m for Al2O3 alone, somewhat greater for ZrO2 alone, and somewhat less for mixed compositions), and that fracture of the Al2O3 alone was intergranular and that of the ZrO2 alone was transgranular, with mixed fracture mode for mixed compositions.
Turning to composites with a mullite matrix, which has been the next most used matrix after Al2O3 for composites with ZrO2, toughness increases with modest additions of ZrO2 have been mixed. Thus Yuan et al. [39] showed NB toughness values increasing by 10–25% as the ZrO2 addition increased to 25 v/o, i.e. from 2 to 2.5 MPa·m1/2 as-measured, increasing faster at lower v/o and possibly saturating at 25 v/o ZrO2. Probable corrections for the 2.6–8.7% residual
Particle (and Grain) Effects |
495 |
porosity reinforce this trend and raise the net increase to 40%. However, Lathabai et el. [122] reported an I toughness of 2.2 MPa·m1/2 in their reaction processed 64 w/o mullite + 5 w/o Al2O3 + 31 w/o ZrO2 (about 1/2 tetragonal and 1/2 monoclinic) with 1–2 m mullite grains and 1 m (mostly intergranular) ZrO2 particles. No evidence of transformation toughening or R-curve effects was observed, consistent with primarily transgranular fracture and no significant crack bridging or deflection (but high strength of 330 MPa, consistent with the fine grain and particle size). On the other hand, Ishitsuka et al. [40] reported that addition of 5 v/o mullite (mostly as small elongated grains) to 3Y-TZP increased their I toughness from 7.5 to 12+ MPa·m1/2, which then decreased with further mullite additions (especially from 30–50 v/o mullite to 5.5 MPa·m1/2 at the latter) to 3.6 MPa·m1/2 for pure mullite. (Thus while their value for pure mullite is higher, their trend for toughness with ZrO2 additions on the mullite rich side are not inconsistent with those of Yuan et al. above.)
C.Composites with Nontransforming Particles in Polycrystalline Matrices
This section addresses the fracture toughness of extensively investigated ceramic composites of nontransforming particles in a polycrystalline matrix as a function of the microstructural parameters, especially of the dispersed second phase. Composites are addressed in the order of mixed oxide–nonoxide and then all nonoxide composites (the most important all-oxide composites having been reviewed in the previous section). A detailed review of the many studies of such composites is not attempted here, as it would be too voluminous and ineffective to the goal of this book (see Campbell and El-Rahaiby’s [27] compilation). Instead, the focus is on studies that address microstructural parameters, the focus of this book. In particular, having introduced the important parameter of the dispersed particle size, D, in ZrO2 toughened materials above, which is expected from models of both transformation toughening and microcracking, let us consider it more broadly in other nontransforming composites.
Composites of Al2O3 with dispersed SiC particles have received considerable attention. Nakahira and colleagues [123] showed that (I) toughness generally rose to a maximum increase of 40% as the SiC content increased, with the maximum toughness value progressively decreasing as the hot pressing temperature increased (from 1600 to 1800°C), and the φ for the maximum increased from 0.1 to ≥ 0.4 for SiC with D 2 m. With 8 m SiC particles, overall toughness increases were lower, e.g. 25%, at φ= 0.1, but again overall toughness values decreased as hot pressing temperatures increased, with the highest temperature (1800°C) giving toughness decreasing, with a modest minimum (~ 25% decrease) at φ 0.03. In another study [124] they showed much less effect of hot pressing temperatures, but with similar toughness values, and a distinct
496 |
Chapter 8 |
maximum for both SiC particle sizes at φ 0.05, the maximum for the larger SiC particle size being ≥25% lower.
Yasuoka et al. [125] also showed that in Al2O3-SiC composites the CNB toughness increased, e.g. ≥ 40% at φ= 0.3, but with an inverse dependence on SiC particulate size. Thus SiC particles, D 4 m, gave a lower maximum of 20% increase at φ= 0.1 but an 35% increase with the finest SiC particles (~ 0.4m) and a decrease to no increase by D = 9 m. They, however, also showed that the toughness increased 15% as the grain size of the Al2O3 matrix increased by100% from G < 1 to > 2 m, being linear as a function of D1/2 (while strength still varied as D-1/2). Thompson and Kristic [126] showed CNB toughness only increasing at their upper SiC particle content of 20 v/o, and only by 10%. Similarly, Zhang et al. [127] showed the change in (I) toughness of hot pressed bodies with SiC particles at the maximum addition (24 v/o) was + 42, + 3, and -6% for SiC particles with mean sizes of 2.5, 0.2, and 0.05 m. Thompson and Kristic, along with Nakahira et al. [123] and Stearns and Harmer [128] have all showed substantial reduction in the Al2O3 matrix G as the level of SiC addition increased for a given densification temperature, but with G increasing in the composites at constant φ as the processing temperature increased.
Another composite with an oxide matrix and nonoxide particles that has seen considerable investigation is Al2O3-TiC, which has been in commercial production for cutting tools and wear applications for a number of years. While much of the development work on this system was done before fracture toughness and mechanics evaluations were commonly available, there is some information on its toughness behavior. Wahi and Ilschner [42] showed that NB toughness using a machined notch increased from 4.1 to 6.7 MPa·m1/2 as TiC particle (~ 1 m) content increased from 0 to 35 v/o, while tests with natural cracks showed a statistically uncertain increase from 4.6 to 5 MPa·m1/2. Yasuoka et al. [125] presented some of the limited data on TiC particle size effects showing that for 10 v/o TiC particles, toughness increase was 0 for D = 0.5 or 13m, with a maximum increase of 20% at D 5 m. Other data also indicates a TiC particle size dependence (Fig. 9.10).
Turning to all nonoxide particulate composites, consider first data for composites of Si3N4 with dispersed SiC particles of differing amounts and sizes. Lange’s (DCB) toughness [129] clearly showed the level of toughness increasing as D of the dispersed SiC particles increased, whether or not correction is made for the limited amount of porosity in some bodies (Fig. 8.16). Further, only the largest SiC particle size (32 m) showed any increase in toughness as φ increased, being a maximum at φ= 0.1–0.2. Data of Tanaka et al. [130] on the same system, but with finer SiC particle sizes (and use of IF for K), is a logical extension of Lange’s data, which is reasonable since they are expected to have similar microstructures of SiC particles dispersed intergranularly between the Si3N4 grains. Data of Sawaguchi et al [131] on composites of this system made by

Particle (and Grain) Effects |
497 |
8.16 Fracture toughness of Si3N4-SiC particulate composites versus the volume fraction of dispersed SiC particles for different indicated particle sizes of Lange [129] and Tanaka et al. [130] at 22°C. Note vertical arrows indicating corrections for limited porosity in some bodies, and that the SiC particles in all bodies are intergranular, versus those of Sawaguchi et al. [131], which have many of the 50–100 nm SiC particles within the finer ( 1/2 m) Si3N4 grains. (Original plot (updated). From Ref. 18. Published with permission of the Journal of Materials Science.)
CVD production of the mixed powder, which when densified by hot pressing with Al2O3 + Y2O3 gave Si3N4 grains 1/2 m with SiC particles 50–100 nm, many of which were within the Si3N4 grains, with intermediate toughness (I) which was a maximum at φ= 0.1. The substantial intrangranular character of the SiC particles is clearly a possible reason why the toughness is not closer to that of Tanaka et al., since for intergranular particles reductions in toughening increases should diminish at small SiC particle sizes. In contrast to the overall substantial effects of dispersed particles on toughness shown, substantial effects of SiC particle size will also be shown on room temperature flexure strengths, but with the particle size effects on strength (Chap. 9, Sec. XII) and toughness being opposite, as is often found for other composites below, and sometimes for monolithic ceramics, especially some self-reinforced Si3N4 (Chap. 2, Sec. III.D).
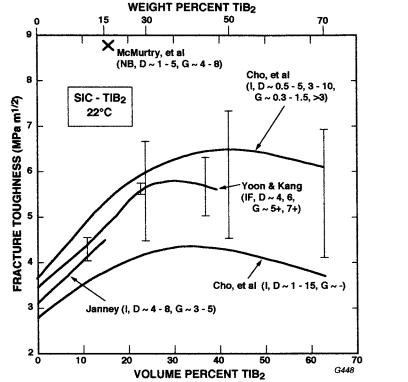
Two other systems that have also received considerable attention are SiC-TiC (Fig. 8.17) and SiC-TiB2 (Fig. (8.18), including commercially available bodies of

498 |
Chapter 8 |
FIGURE 8.17 Fracture toughness versus volume percent TiC particles from Endo et al. [48], Cho et al. [132], Wei and Becher [133], and Lin and Iseki [134,135]. Note (1) designation of toughness tests and different values for testing the same body by different methods (Endo et al.), (2) use of different densification aids (Lin and Iseki), and (3) average D values, except the range is shown for Endo et al. (and that of Becher and Wei was similar, i.e. to 11 m).
sintered α-SiC with 15 w/o TiB2 and B+C additions (also used in several experimental bodies). Besides either showing or supporting toughness maxima at 40 v/o TiC, the data indicates higher toughnesses with larger TiC particle size over the limited range investigated. A summary of much of the available SiC-TiB2 data shows similar trends as well as a common range of variation in the level of toughness and the composition for a toughness maximum, e.g. a toughness maximum at φ 0.25–0.4 with some indications of increased toughness with increased partucle size (D). A complicating factor is SiC grain size variations, better characterized for the SiC-TiB2 system but also indicated by Lin and Iseki’s data [134,135] showing higher toughness with AlN versus Ti additions, with the former giving larger SiC G (and TiB2 D) values. Another is different toughness values due to variations in test technique and method, e.g. higher values for NB. Some variations also probably reflect the extent of development (i.e. high for the material of McMurtry et al. [138], which impacts the ranges of dispersed particle and matrix grain sizes. Note that Yoon and
Particle (and Grain) Effects |
499 |
FIGURE 8.18 Fracture toughness of SiC-TiB2 particle composites versus volume percent TiB2 from Cho et al. [132], Yoon and Kang [136], Janney [137], and McMurtry et al. [138]. Note toughness measurement methods indicated along with the average particle size (D) and average matrix grain size (G). Also note (1) that two sets of values shown for Yoon and Kang reflect two different processings, while the extremes of values for three processing variations are shown for data of Cho et al. (the third value was typically substantially closer to the higher one, hence the average trend line being above the average of the two extreme values) and (2) that the materials of Yoon and Kang, Janney, and McMurtry et al. were densified with B–C additions, while the others used Al2O3 and Y2O3.
Kang [136] showed toughness versus D was either more scattered at D 2.5–5 m or passing through a maximum of 5.7 MPa·m1/2 at D 4 m, but in either case then constant at 5.4 MPa·m1/2 for D 6–12 m (while they showed a continuous 40% decrease in strength over this range). Recently Cho et al. [139] reported that SiC-50 w/o TiB2 composites hot pressed with Al2O3 and Y2O3 additions had I toughness of 4.5 MPa·m1/2, which increased on annealing and resultant coarsening of both