

Mechanical Properties of Ceramics and Composites
.pdf540 |
Chapter 9 |
flaw size, which was λ ( 40 m) and is consistent with typical machining flaws controlling strengths of machined silicate glasses [2,3], and the slope of the subsequent strength increase at finer λ values, being ( 0.7 MPa·m1/2), i.e. the fracture toughness of the glass, appeared consistent with the model. However, the latter correspondence is somewhat misleading, since λ is taken as the flaw diameter, while the toughness is determined by a slope based on the flaw radius, so the above slope translates into a toughness of 0.5 MP·am1/2, i.e. with less good agreement. Hasselman and Fulrath also noted that in the large λ region where strengths were constant with flaws smaller than λ strengths actually had a modest minimum (e.g. 10% lower at higher φ), which they attributed to probable stress concentration effects near the Al2O3 particles, e.g. due to the large particle–matrix elastic moduli differences. However, while λ is a parameter of some importance, their reliance on it as the controlling parameter is questioned by other evaluations, including a possible more direct role of particle size, as is discussed below (Fig. 9.2B).
Davidge and Green [5] made composites of 10 v/o of ThO2 spherical particles of different sizes (50 to 700 m) in three different glass matrices ranging in expansion from 30 to 50, and 75% that of ThO2. Composites with the lowest expansion glass had no cracks around ThO2 particles < 60 m, with at least 25% of particles D > 80 m having cracks (Chap. 8, Sec. III). In composites with the intermediate expansion glass matrix the threshold for cracking around the spheres increased to D 200 m, and no preexisting cracks were found in composites with the glass expansion closest to that of ThO2. Uniaxial flexure strengths of the composites with the glass matrix expansion somewhat below, but approaching that of, the ThO2 particles were somewhat higher than that of the glass alone at the finest D ( 150 m) tested, while those of composites with the two lowest expansion glasses fell somewhat below those of the glasses themselves at the finest ThO2 particle sizes. Strengths of composites with either of the three glass matrices all decreased linearly as D-1/2 decreased, but at two significantly different rates (Fig. 9.2A). Evans presented modeling to support crack sizes being related to the particle sizes, with some variations based on the local stresses [6].
Frye and Mackenzie’s [7] biaxial flexure strengths of composites of 125–150 m spheres of Al2O3 or ZrO2 in glasses tended to scale with the resultant composite Young’s moduli with limited glass–particle expansion differences (e.g. ± 2 ppm/°C) from those of the dispersed particles. With larger expansion differences, strengths first decreased, e.g. by 10–20% at φ=0.2, and then increased back to or above the glass strength at φ=0.4; as noted in Chap. 8, Sec. V.A, the latter bodies had preexisting cracks. The authors noted that the mean free paths between particles in their composites were > the expected flaw sizes, so that the mechanism of Hasselman and Fulrath of particle spacing constraining flaw sizes was not pertinent.

Particle Dependence of Tensile Strength |
541 |
(A)
FIGURE 9.2 Flexure strengths at 22°C of various synthetic glass matrix composites with different crystalline oxide particles and machined or abraded surfaces, as shown (volume fractions indicated in captions, or as decimals next to data points). (A) Data of Binns [4], Davidge and Green [5], and Lange [8], the latter corrected for residual volume fraction porosity (P) of up to 0.07 via e -4P in samples with 40 v/o Al2O3 particles. (B) Data of Hasselman and Fulrath [1], Binns [4], and Miyata et al. [9]. Note (1) definite strength dependence on particle size (D), with similar trends, and often similar strength levels, for different composites, with higher strengths at higher volume fraction of particles and less particle–matrix expansion mismatch, and (2) limited effect of irregular versus spherical particles (Miyata et al., half solid circles). See Fig. 9.17 for similar trends for glass matrix–W particle composites.
Lange’s [8] uniaxial flexure strengths for his composites of smaller, irregular, or larger spherical Al2O3 particles in a glass matrix with very similar expansion to the Al2O3 particles tended to follow his fracture energy trends versus φ for the finer particle sizes averaging 11 and 3.5 m, scaling as their increases in E and K with increasing φ. However, strengths with the larger ( 44 m) particles, which had given much higher toughnesses (Chap. 8, Sec. V.A), gave the lowest strengths, which fell below that of the glass at φ= 0.1 and 0.25, giving

542 |
Chapter 9 |
(B)
FIGURE 9.2 Continued
measurable strength increases by φ=0.4 but still below those with finer particles. This behavior is inconsistent with his fracture energy results at larger particle size and is thus at least partly inconsistent with his fracture energy results being fairly consistent with his line tension model, since this predicts increasing fracture energy, and hence toughness, as D increases (Chap. 8, Sec. II.B). His strength data generally increased linearly with λ-1/2, suggesting some possible agreement with the line tension model and the flaw size limitation model of Hasselman and Fulrath [1]. However, again the largest particle composite did not appear consistent with this, generally having the lowest strengths and highest fracture energies, and there was no break in the σ–λ-1/2 line to no strength decreases with further decrease in λ-1/2 and the σ–λ-1/2 slope appeared too low, e.g. by 2. Further, there was a distinct particle size dependence to the data that was not recognized (Fig. 9.2A).
Miyata et al.’s [9] strengths of composites of glass matrices having thermal expansions greater (by 2.8 or 5 ppm/°C) than the Al2O3 ( 50 m spherical, or50 or 12 m angular) particles also vary significantly from their toughness trends. While in all cases substantial (e.g. twofold) toughness increases occurred as φ increases to 0.3 (Chap. 8, Sec. III.A), strengths always initially decreased
Particle Dependence of Tensile Strength |
543 |
below, and frequently barely increased to or slightly above, the glass strengths by φ= 0.3. Again, strength levels were lower as the particle–matrix expansion difference increased and the particle size increased (with no great differences between spherical and irregular shaped particles). That microcracking was increased by both the application of external stress and as the matrix–particle expansion differences increased was shown by acoustic emission in conjunction with strength tests. Emission occured at the failure stress of samples with the lowest expansion mismatch and φ=0.1 but decreased to 75–95% of failure stress for composites with the larger expansion mismatch and even somewhat lower for all bodies with φ=0.3. Surprisingly, composites with 12 m angular particles had lower thresholds for acoustic emission than did composites with larger spherical particles, but there was little effect of particle shape on strengths, but a substantial effect of particle size (Fig. 9.2B).
Dental composites of 75 v/o Al2O3 particles in glass matrices ranging in expansions from 2 ppm/°C < that of alumina to that of alumina made by Wolf et al. [10] via infiltration of molten glass into Al2O3 preforms were more consistent with the high toughness values (Chap. 8, Sec. V.A). Thus while toughness values were typically three times those measured for the glasses themselves, strengths were nearly threefold those of the glasses and porcelains cited. These trends are consistent with the finer size of the often somewhat tabular Al2O3 particles 0.3 to 10 m and the above trend for toughness and strength behavior to be closer for finer particles.
Borom [11] in reviewing synthetic glass matrix composite strength behavior noted Miyata and Jinno’s [12] reploting of Hasselman and Fulrath’s [1] data showing this fell on different curves of strength versus φ (again with initial strength decreases from those of the glass at low φ and strengths generally increasing as D decreased). He also showed that increases in E of the composites correlated closely with λ-1/2 and concluded that (1) dispersed particles did not limit flaw sizes (but may produce surface flaws proportional to the particle sizes), and (2) Young’s modulus increases were a major source of composite strength increases unless compromised by particle-induced cracking.
However, none of these past evaluations has recognized the central role that composite particle size plays in the strength of these composites as shown here in Figure 9.2, i.e. analogous to the role of grain size for monolithic ceramics (Fig. 3.1). Thus note that Lange’s data covering both finer and larger particles relative to expected flaw sizes (mostly 30–50 m) shows limited but not zero dependence of strength on particle size when this is < the flaw size, but a substantial decrease in strength with decreasing particle size via a D-1/2 dependence when D > the expected flaw size. (Note that the larger particle size branch was estimated by assuming a zero intercept for both axes, which may not be true if there are substantial residual stresses contributing to failure, but variations from this slope should not be great.) The mechanism is seen as the same as for the role
544 |
Chapter 9 |
of grain size in the strength of machined monolithic ceramics (all of the composites were tested as finished by machining or abrasion), i.e. at finer particle sizes machining flaws are < D, so D only has a limited effect on strength via effects on the local E, H, and toughness values affecting the size and character of the surface finishing flaws. However, for D ≥ the flaw size, the particles become the flaws. While it might be thought that the effects of D may really reflect a dependence on λ via their close relation, this is unlikely, since at φ= 0.1, λ =6D, with λ = D only at φ= 0.4, i.e. far too large to be related to normal flaw sizes for most particles. Note also that most of the other data only shows the finer D branch consistent not only with the finer particle sizes but also with the expected flaw sizes being ≥the largest particle size. In the case of the ThO2 particle composite, the particle sizes are ≥ the flaw sizes, so the data is mostly or completely along the larger D branch, except for a possible transition to the finer D branch at the finer D. Finally note three other key factors about this D dependence and the model for it analogous to that for monolithic ceramics. First, besides the D dependence having the same shape as for the G dependence of strength of monolithic ceramics, and being consistent with the flaws’ sizes, the slopes of the larger D branches are < the fracture toughness. Second, this D dependence frequently shows similar strengths for similar v/o of particles from different investigators, as expected from similar composite compositions and flaw sizes. Third, similar results are shown for not only glass–W composites (Fig. 9.17) but also particulate composites of crystalline phases for both the matrix and the dispersed particles (Fig. 9.15).
2.Crystallized Glasses, Porcelains, and Related Composites
Turning to crystallized glasses, Freiman and Hench [13] plotted their strength data for some LiO2-SiO2 bodies (normalized by (Eg/E)1/2 where Eg and E = the Young’s modulus of the parent glass and of the crystallized body) versus λ-1/2, where λ was the mean spacing between the spherulites (not individual crystallites). Since this plotting resulted in rational, not chaotic, organization of the data, they concluded that strength varied as a function of λ-1/2. However, they did not associate the differing trends of bodies from different crystallization treatments with any particular mechanism, since there were clearly significantly different trends among the different specimen data sets as well as with models discussed above. Thus their largest data set had strength increasing as λ-1/2 decreased (and D-1/2 increased), while their second largest data set had the opposite trend with λ-1/2 (and D-1/2), i.e. in the first case the trend with λ-1/2 was not consistent with known or expected mechanisms but was possibly consistent in the second data set, and vice versa for the D-1/2 dependence. Since they also showed E doubling as crystallization was completed, this could explain most, but not necessarily all, of their strength increases, but would be inconsistent with significant strength decreases with increased crystallization in one case (but not the other
Particle Dependence of Tensile Strength |
545 |
three cases). However, this may reflect stress-induced microcracking, which was not addressed, and illustrates the often serious complexities that can occur in these systems and the need for more characterization and evaluation, as well as consideration of various mechanisms.
Close parallels of Young’s modulus and strength were also shown by Atkinson and McMillan [14] in studies of the Li2O-SiO2, e.g. showing substantial minima and maxima as a function of heat treatment time at a given temperature. Thus strength and Young’s modulus changes were quite similar, but not identical, with maxima and minima patterns as well as changes in numerical values, e.g. of up to threefold for strength and fourfold for E. They also noted that strengths showed a λ-1/2, but not a D-1/2, dependence, i.e. strengths varying from 70 to 210 MPa as λ decreased over the range 0.25–0.125 m and D 1.3–1 m. Freiman and Rice [15] commented that microstructural stresses were probably a factor in their strengths and that this could be a factor in the lack of a correlation with D.
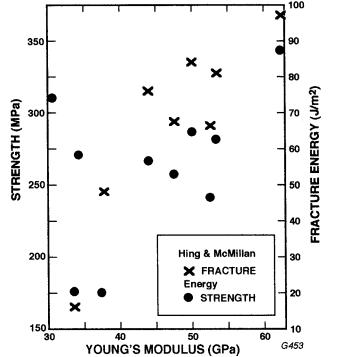
Hing and McMillan [16] investigated crystallization of similar LiO2-SiO2 glasses to those of Freiman and Hench above but showed strengths following the trend of Fig. 9.3, as well as versus λ-1/2, with similarity and differences with the results of Freiman and Hench. They noted that the intersection of the two lines atthe flaw size and the slope of strength increasing with λ-1/2 was consistent with the measured glass fracture energy, but this may be fortuitous, e.g. their equation to determine λ appears to be missing a factor of 2/3. They noted that while E increased as strength increased (Fig. 9.3), strength increased more than E, but the changes in the two are not that much different and there is reasonable correlation between the two (and of λ with E). Further, their E values are substantially lower than those of Freiman and Hench, e.g. by 30–40% (which is a common occurrence for E values from deflections in flexure versus resonance or ultrasonic measurements, as well as from possible stress initiated microcracking in flexure testing). (They noted that microcracking in these materials, though reported by others, was not expected due to similar glass–crystallite expansions, and was not observed.) Other correlations, e.g. of E and strength versus λ-1, and that, while the range of D values was limited, data was not inconsistent with strength varying as D-1/2, indicate the complexity of sorting out mechanisms in many of these complex systems.
Turning to porcelains, residual quartz particles are commonly found to play an important role in their strengths due to either preexisting cracks or stress generated microcracks from them and a general decrease in strengths with higher quartz contents. Plotting Hamano and Lee’s [17] strengths versus D-1/2 of the quartz particles in fired bodies (based on x-ray analysis) shows a substantial drop in strength (Fig. 9.4A), very similar to that found for bodies in the range of spontaneous microcracking (Figs. 3.1, 3.23). More recent data by Banda and Messer [18] based on starting rather than in situ quartz particle sizes shows a
546 |
Chapter 9 |
FIGURE 9.3 Strength of LiO2-SiO2 specimens versus Young’s modulus (measured from deflections in flexure testing) of Hing and McMillan [16]. Note that measured E values are low relative to those reported by Freiman and Hench [13] of 50–90 GPa (as is often the case for such measurements) and that fracture energies showed nearly identical correlation with E.
similar trend, i.e. a rapid decrease in strength over a limited D range and then an apparent leveling out of the strength decrease (Figs. 3.1, 3.23). Thus the differences appear to be mainly or only due to the large differences in D values, much of which stems from the latter work using the starting particle sizes rather than those of the remaining quartz particles. The former measurements of residual quartz particle sizes may not give a good indication of larger remaining sizes that play a larger role in microcracking and resultant mechanical behavior, and thus another source of the difference in quartz particle sizes.
Turning to other related natural ceramic composites, there are indications of strengths correlating with microstructural parameters, especially D (probably because it has been considered more, not necessarily because it is more important or pervasive in its effects). Thus previous plotting [19] of strengths versus D-1/2 for flint

Particle Dependence of Tensile Strength |
547 |
FIGURE 9.4 Strength dependence of porcelains on actual (A) and starting (B) quartz particle sizes. (Respectively after Hamano and Lee [17] and Banda and Messer [18], the latter including data on (NB) toughness.)
particles in earthenware and Al2O3 particles in china clay–Nepheline Syenite–Al2O3 bodies [20] suggested possible similarities with the G-1/2 dependence of monolithic ceramics (Fig. 3.1), e.g. finer and larger D branches intersecting at D 10 m. Similar correlations are seen in some crystallized glasses, e.g. crystallized LiO2-Al2O3- SiO2 glass data of Utsumi and Sakka [21] also indicate two branches, but data for a crystallized ZnO-Al2O3-SiO2 glass of Stryjak and McMillan [22] appears to be over too small a D range to show a large D branch and thus does not show such behavior. However, again data such as that of Freiman and Hench shows both some similar possible trends as monolithic ceramics and also some clear differences and at least some aspects of the various differing and complex trends that need to be addressed. In the cases where intersections of the two branches are at reasonable flaw sizes, e.g. of the order of 10 m or so, the branch intersections may reflect the flaw sizes, while at fine, e.g. nm, particle sizes, a D-1/2 dependence of strength may reflect microcracking or other correlations, e.g. with λ or φ but not due to flaw size–particle relations.
548 |
Chapter 9 |
B.ZrO2 Toughened Composites
1.Powder Processed ZTA Composites
Following the discovery of transformation toughening with metastable tetragonal ZrO2, especially in fine grain TZP materials (Chap. 2, Sec. III.F, and Chap. 3, Sec. IV.B), many composites of fine metastable tetragonal ZrO2 particles dispersed in a variety of matrices have been investigated. While the majority of these composites have been with oxide matrices, some have been made with nonoxide matrices despite complications that can arise due to the nonoxidizing atmospheres, and often higher temperatures needed for processing that can result in reaction with, or reduction of, ZrO2 or both. However, this section focuses on strengths of Al2O3-ZrO2 (ZTA) composites, since these particularly clearly illustrate the microstructural effects. Thus they have been the most extensively developed, used, and understood, since Al2O3 is a very desirable and practical matrix. This is because it is compatible with ZrO2 from both a basic chemical and a processing standpoint and is an excellent matrix because of its properties; its high Young’s modulus provides significant constraint of the expansion required by the transformation of the ZrO2 giving higher tougheners in composites with Al2O3 than most, if not all, other matrices (except possibly ZrO2 itself).
Strength behavior, however, can be significantly different from that of toughness, which as said in Chap. 8, Sec. V.B is a maximum when the ZrO2 particles have no stabilizer and an average particle size of 1+ m with φ 0.12 (Figs. 9.5 and 9.6). Thus Claussen’s original study [23,24] of ZTA showed that both the φ values for toughness maxima and their levels increased as the unstabilized ZrO2 particle size decreased (Fig.9.5A). However, regardless of the varying levels of toughness increases, the strengths of all his original ZTA bodies progressively decreased as the ZrO2 content increased, with the strength decreases becoming progressively greater as the ZrO2 particle size increased. Thus the strength decreases increased as the toughness increases decreased, and hence in this sense they were correlated, i.e. better toughness meant less strength decrease, but there was no increase in strength with increased toughness. The failure of the toughness increases to translate into strength increases was attributed to processing heterogeneities acting as fracture origins, which was reinforced by better toughness and strengths being obtained with finer ZrO2, which should provide less serious heterogeneities.
This proposed cause of strengths not following the toughness increases due to processing heterogeneities was confirmed by Becher’s study [24,25]. Using sol gel processing that produced fine, unstabilized ZrO2 particles that were much more uniform in both size and spatial distribution in a more uniform dense Al2O3 matrix showed toughness (fracture energy) and strength closely following each other, with the maximum for both being at φ 0.1–0.12 (Fig. 9.6). Subsequently conventional powder processing was improved to yield the

Particle Dependence of Tensile Strength |
549 |
FIGURE 9.5 Plots of (A) fracture toughness and (B) flexure strength versus volume percent of unstabilized ZrO2 particles in an Al2O3 matrix made by conventional powder processing. Note strengths decreasing despite toughness increases, compared to Fig. 9.6. (Data from Ref. 23, plots from Ref. 24. Published with permission of Noyes Publications.)
homogeneity needed to realize at least most of the strength benefits of the ZrO2 toughening.
Lange [26] subsequently corroborated that the toughness maxima for fine unstabilized ZrO2 was at φ 0.1, but that progressively higher toughness maxima occurred at higher φ values with increasing degrees of partial stabilization of the ZrO2, with the maximum toughness being that of TZP, i.e. at φ= 1. (This may also allow use of somewhat larger ZrO2 particles, but this may still be constrained some by possible moisture degradation effects, Fig. 2.9.) Thus Lange’s work showed that starting with totally unstabilized ZrO2 a series of composites with decreasing Al2O3 content and increasing toughness and strengths extrapolate to those of TZP bodies (Fig. 9.7).