

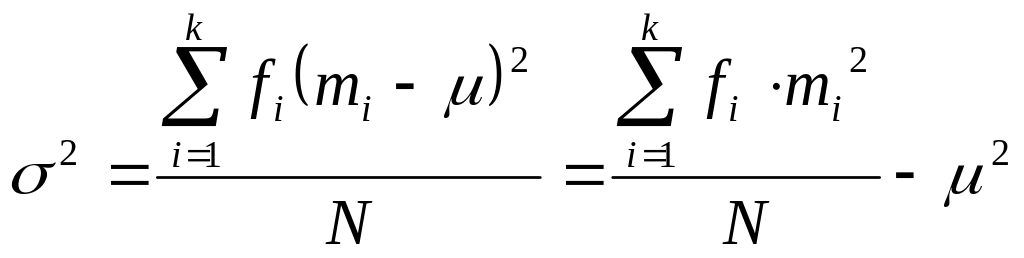
1.6.4. Variance for data with multiple-observation values
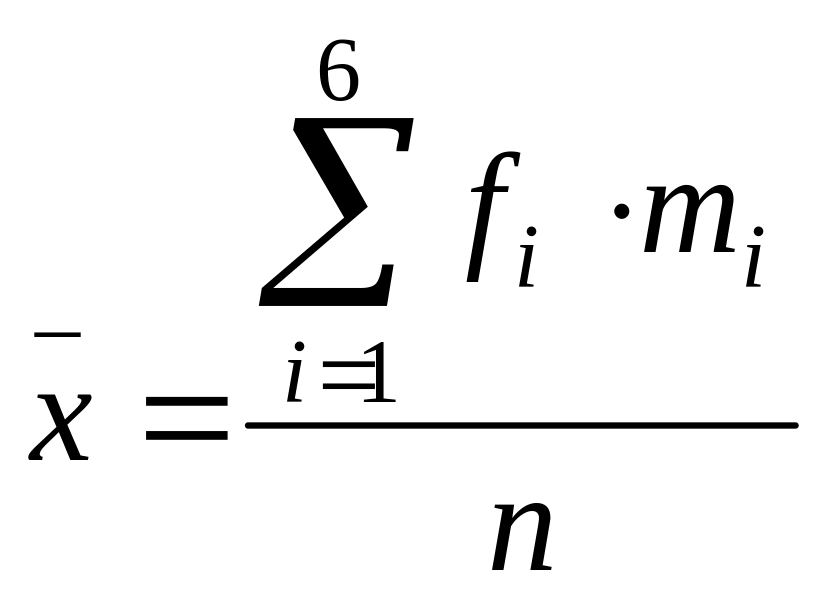
Suppose that a data set contains values occurring with frequencies, respectively.
1. For a population of observations, so that
The variance is
The
standard deviation is![]() .
.
2. For a sample of observations, so that
![]()
The variance is

The
standard deviation is ![]() .
.
The arithmetic is most conveniently set out in tabular form.
Example:
The score for the sample of 25 students on a 5-point quiz are shown below.
Find a sample variance and standard deviation.
Score
|
Frequency
|
0 1 2 3 4 5 |
1 2 6 12 3 1 |
Solution:
Remark:
The denominator in the formula
 is
obtained by summing the frequencies
is
obtained by summing the frequencies![]() .
It is not number of classes.
.
It is not number of classes.
To
calculate variance we need three columns to display the computation
of the quantities
![]() a
column for the
a
column for the
![]() a
column for the
a
column for the
![]() and
a column for the
and
a column for the![]() .
We also need a column for
.
We also need a column for
![]() and
a final column for the products
and
a final column for the products![]() .
(Table 1.5)
.
(Table 1.5)
The
necessary computations for finding
![]() are
shown below.
are
shown below.
Table 1.5
Score
|
Frequency
|
|
|
|
0 1 2 3 4 5 |
1 2 6 12 3 1 |
0-2.7=-2.7 1-2.7=-1.7 2-2.7=-0.7 3-2.7=0.3 4-2.7=1.3 5-2.7=2.3 |
7.29 2.89 0.49 0.09 1.69 5.29 |
0· 7.29=0 1· 2.89=2.89 2· 0.49=0.98 3· 0.09=0.27 4· 1.69=6.76 5· 5.29=26.45 |
|
|
|
|
|
Thus we
have 
![]() .
.
Example:
The number of television sets sold per month over a two year period is reported below. Find the variance and standard deviation for the data.
-
Number of sets
sold
Frequency (month)
5
6
7
8
9
10
2
3
8
1
6
4
Solution:
Let us
apply 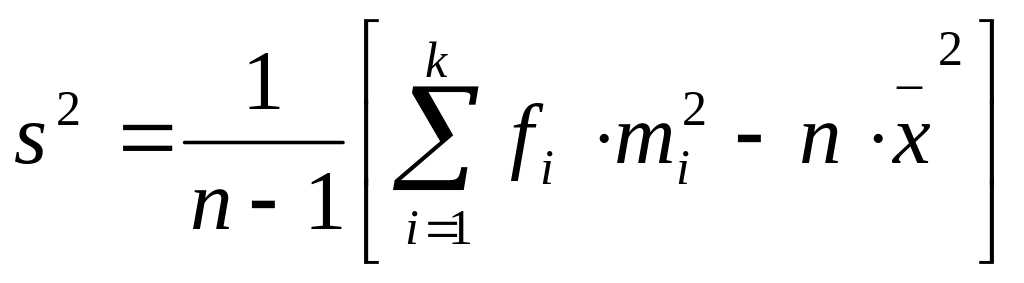 .
.
Make a table as shown below
Sets |
Frequency |
|
|
|
|
|
|
|
|
|
|
|
|
|
![]()
![]()
To find standard deviation we take the square root of variance
![]() .
.
Exercises
1. The following numbers of books were read by each of the 28 students in a literature class.
Number of books |
Frequency (students) |
0 1 2 3 4 |
2 6 12 5 3 |
b) Find the median
c) Find the mode
d) Find the variance and standard deviation.
2. The all forty students in a class found the following figures for number of hours spent studying in the week before final exam
Time (hours)
|
Number of students |
1 2 3 4 5 |
1 7 15 10 7 |
b) Find the median
c) Find the mode
d) Find the variance and standard deviation for this population.
3. A sample of fifty personal property insurance policies found the following numbers of claims over the past 2 years
Number of claims |
0 1 2 3 4 5 6 |
Number of policies |
21 13 5 4 2 3 2 |
a) Find the mean number of claims per day policy
b) Find the sample median of claims
c) Find the modal number of claims for this sample
d) Find the sample variance and standard deviation.
4. For sample of 50 antique car owners, the following numbers of cars’ ages was obtained
Ages (in years) |
Frequency (cars) |
17 18 19 20 |
20 18 8 4 |
b) Find the median
c) Find the modal number
d) Find the sample variance and standard deviation.
Net worth (in million of dollars) |
Frequency
|
15 20 25 30 35 40 |
2 8 15 7 10 3 |
a) Find the sample mean net worth
b) Find the median
c) Find the mode
d) Find the sample variance and standard deviation
Answers.
1. a) 2.04; b) 2; c) 2; d) 1.09; 1.04; 2. a) 3.375; b) 3; c) 3; d) 1.08; 1.04;
3. a) 1.4; b) 1; c) 0; d) 3.061; 1.75; 4. a) 17.92; b) 18; c) 17; d) 0.89; 0.94; 5. a) 27.7; b) 25; c) 25; d) 41.98; 6.48.