

6.3. Shallow water.
Shallow water subsidence
Q = 2 * ((CB * V2)/100) (6.9)
Q – maximum theoretical possible hull subsidence (m);
CB – coefficient of total completeness of the submerged part of the hull;
V – speed of vessel (kn)
CB = D / (𝜸 * L * B * T) (6.10)
D – deadweight loaded (t)
𝜸 = 1.025 – density of sea water (g/sm3);
L – length of the ship between perpendiculars (m);
B – breadth of the ship (m);
T – draught to summer mark (m)
Shallow water subsidence for Full Ahead Speed (10.3 kn)
CB = 11559 / (1.025 * 131 * 22.46 * 6.114) = 0.626 (6.11)
Q = 2 * ((CB * V2)/100) = 2 * ((0.626 * 10.32)/100) = 1.328 (6.12)
Shallow water subsidence for Half Ahead Speed (8.2 kn)
Q = 2 * ((CB * V2)/100) = 2 * ((0.626 * 8.22)/100) = 0.841 (6.13)
Shallow water subsidence for Slow Ahead Speed (6.2 kn)
Q = 2 * ((CB * V2)/100) = 2 * ((0.626 * 6.22)/100) = 0.481 (6.14)
Shallow water subsidence for Dead Slow Ahead Speed (4.1 kn)
Q = 2 * ((CB * V2)/100) = 2 * ((0.626 * 4.12)/100) = 0.210 (6.15)
6.4. Tidal streams.
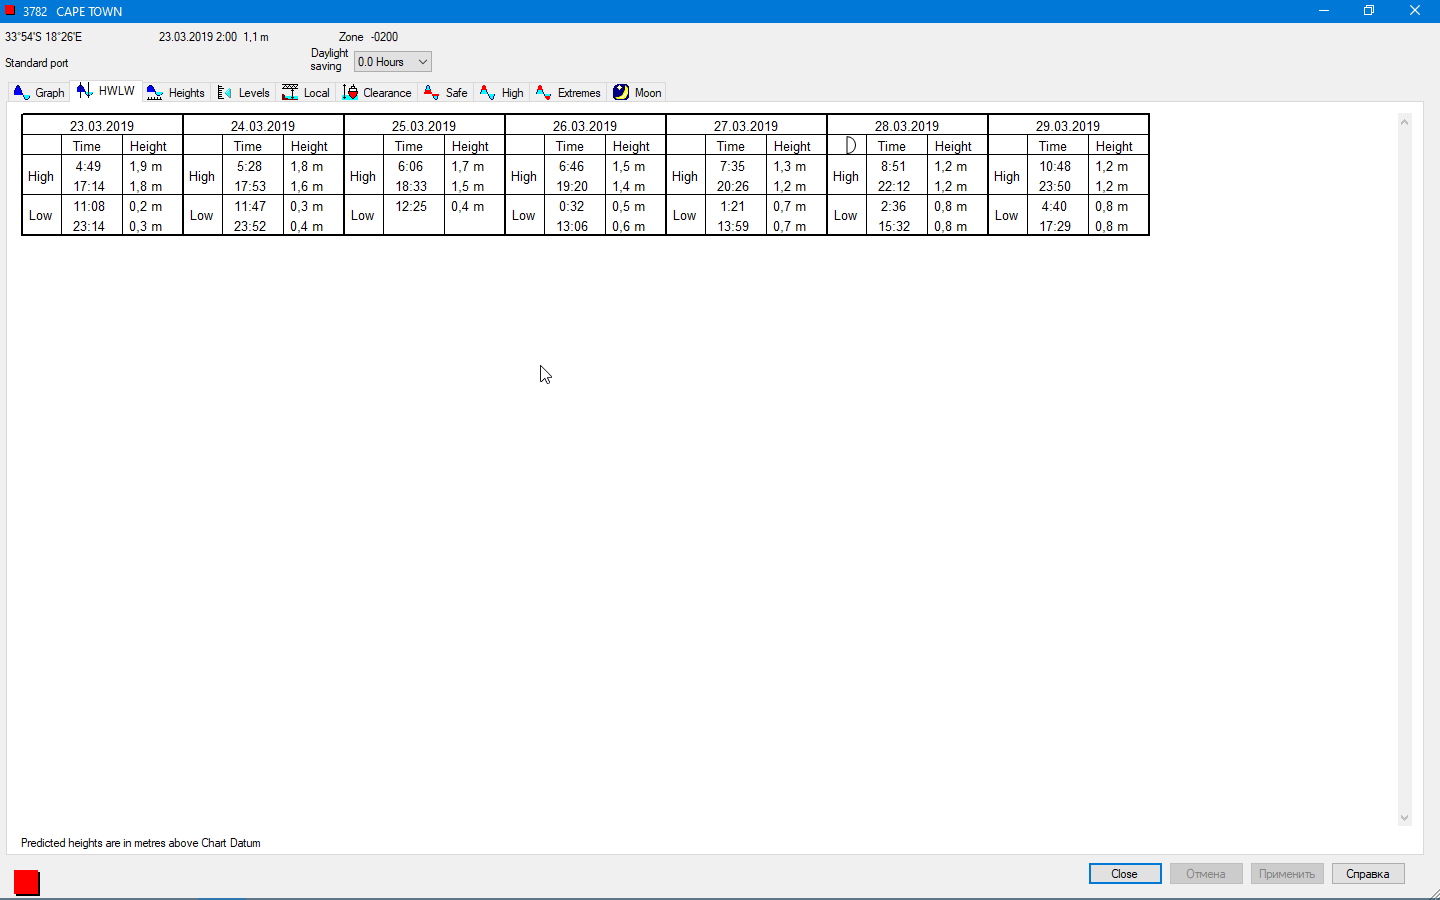
Pic. 6.2 – Cape Town Tide Table
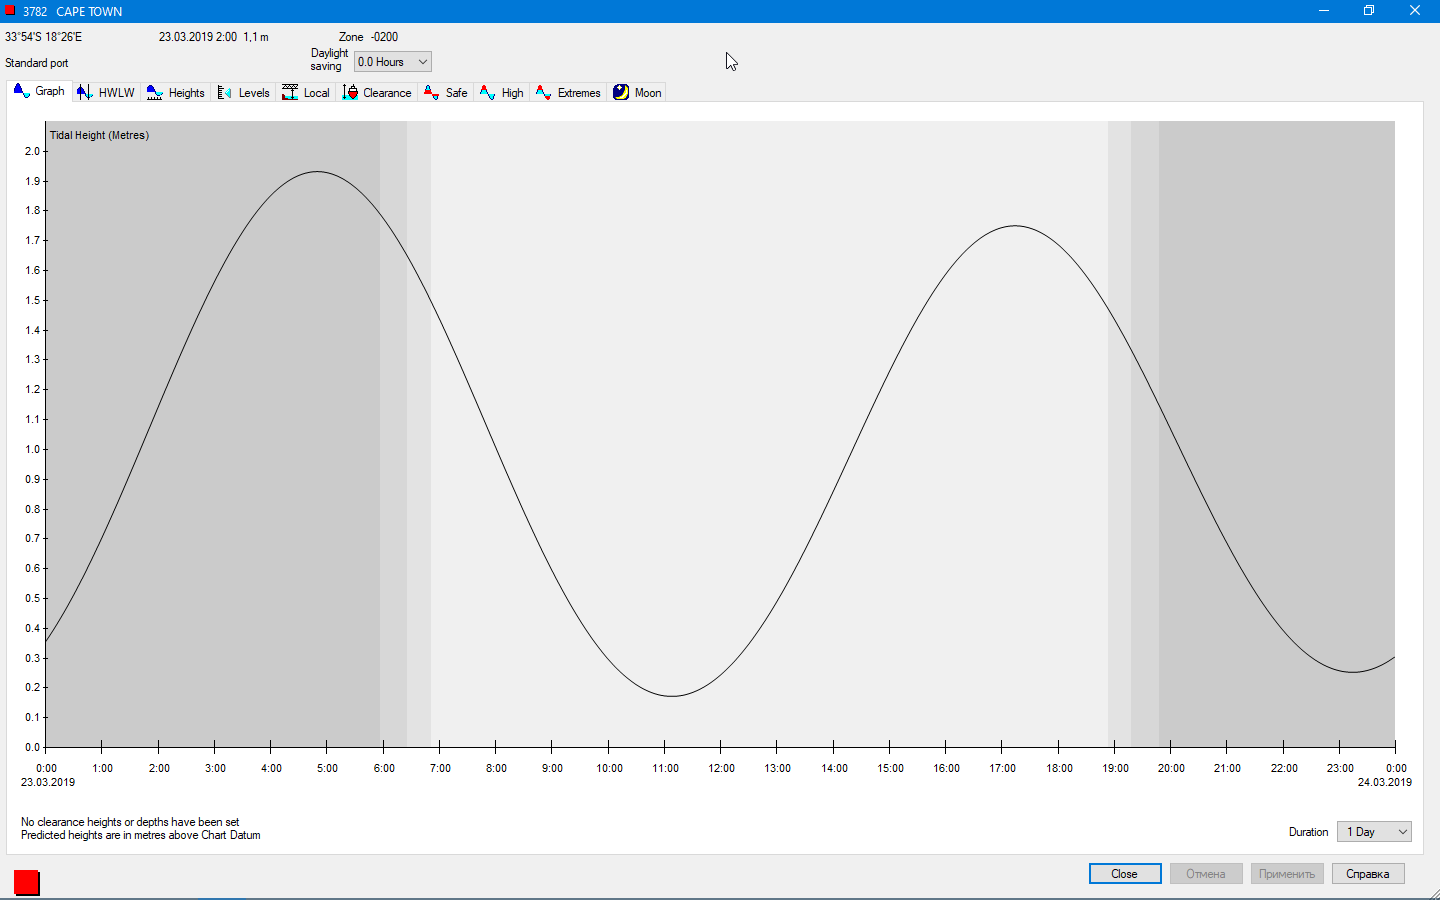
Pic. 6.3 – Cape Town Tide Chart
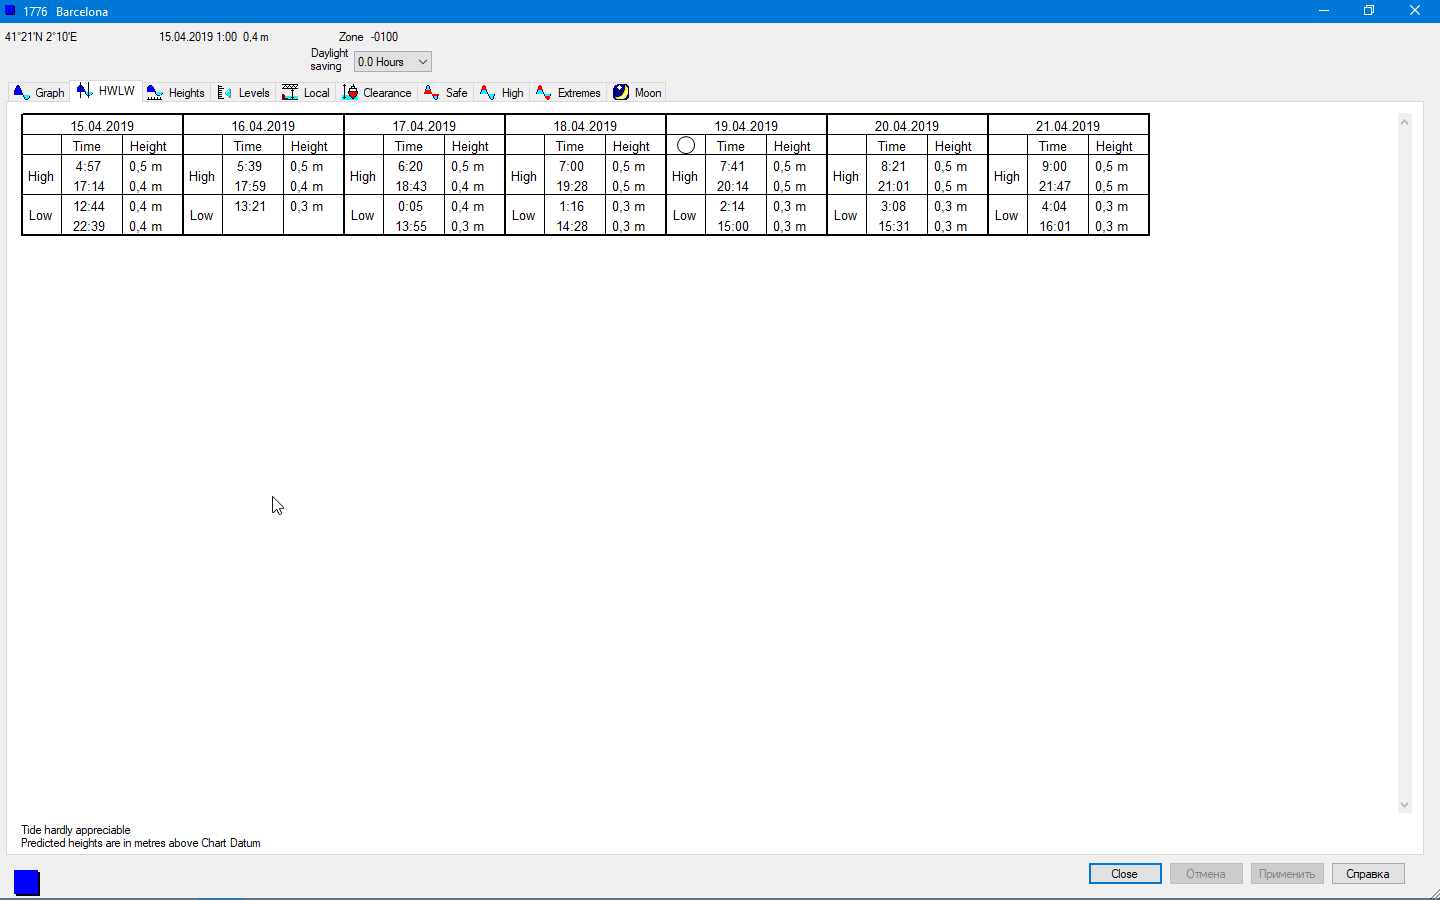
Pic. 6.4 – Barcelona Tide Table
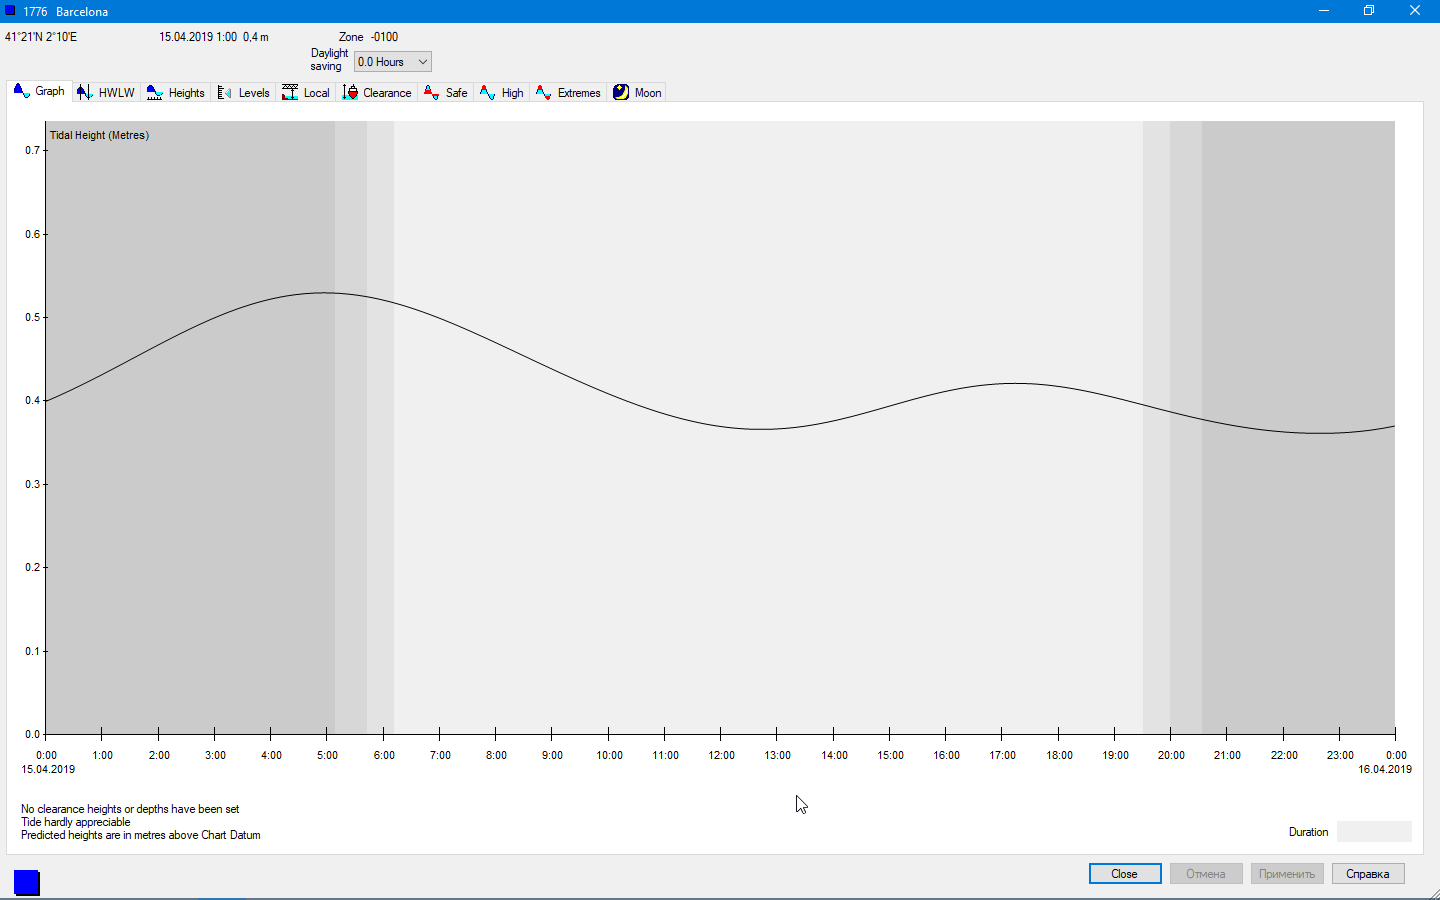
Pic. 6.5 – Barcelona Tide Chart
6.5. Under keel clearance and safe speed on shallow waters.
UKC must be > 1.
UKC = HM – TC (6.16)
HM – depth of water;
TC – draught of vessel.
HM = H0 + ∆h (6.17)
H0 – chart datum;
∆h – tidal height.
TC = T + Q + ∆TB (6.18)
T – draught of vessel on deep water;
Q – maximum theoretical possible hull subsidence;
∆TB – increase of draught due to swell.
∆TB = 0.6 * hB (6.19)
hB – maximum height of swell.
UKC Cape Town
∆TB = 0.6 * hB = 0.6 * 2 = 1.2 (6.20)
TC = T + Q + ∆TB = 6.114 + 1.328 + 1.2 = 8.642 (6.21)
HM = H0 + ∆h = 15.7 + 0.4 = 16.1 (6.22)
UKC = HM – TC = 16.1 – 8.642 = 7.458 (6.23)
UKC Barcelona
∆TB = 0.6 * hB = 0.6 * 1 = 0.6 (6.24)
TC = T + Q + ∆TB = 6.114 + 1.328 + 0.6 = 8.042 (6.25)
HM = H0 + ∆h = 10.3 + 0.4 = 10.7 (6.26)
UKC = HM – TC = 10.7 – 8.042 = 2.658 (6.27)
6.6. Assessment of the accuracy of observations and the choice of method for determining the position of the vessel.
Determining the position by 2 bearings
R95% = 0.06 * DAV (nm) (6.28)
DAV – average distance to landmarks.
Determining the position by 2 distances
R95% = 0.03 * SC (nm) (6.29)
SC – scale of Radar
Determining the position by 1 bearing and 1 distance
R95% = 0.04 * SC (nm) (6.30)
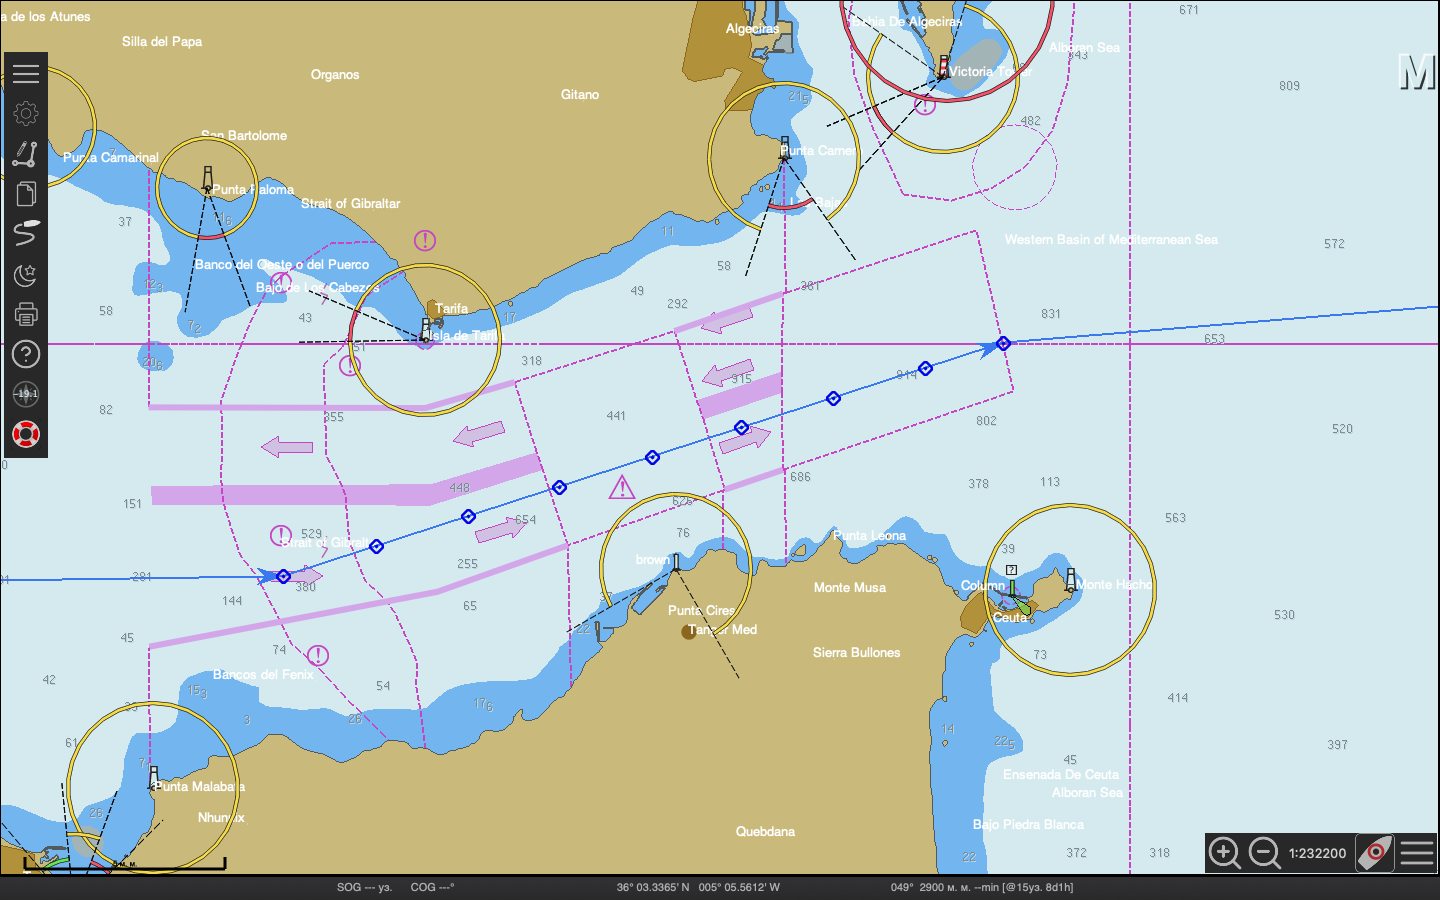
Pic. 6.6 – Passage through Strait of Gibraltar
Table 6.4 – Determine the position by 2 bearings
|
Waypoint |
Landmark |
D, nm |
Landmark |
D, nm |
DAV, nm |
R 95%, nm |
|
|
016 |
Punto Malabata |
6,1 |
Punta Maroqqui |
6,9 |
6,5 |
0,39 |
|
|
017 |
Punta Maroqqui |
5,3 |
Punto Cires |
7,5 |
6,4 |
0,38 |
|
|
018 |
Punta Maroqqui |
4,5 |
Punto Cires |
5,4 |
5 |
0,3 |
|
|
019 |
Punta Maroqqui |
4,9 |
Punto Cires |
3,5 |
4,2 |
0,25 |
|
|
020 |
Punta Maroqqui |
6,3 |
Punto Cires |
2,8 |
4,6 |
0,28 |
|
|
021 |
Punto Carnero |
6,8 |
Punto Cires |
3,9 |
5,4 |
0,32 |
|
|
022 |
Punto Carnero |
6,1 |
Monte Hacho |
7,6 |
6,9 |
0,41 |
|
|
023 |
Punto Carnero |
6,3 |
Monte Hacho |
6,6 |
6,5 |
0,39 |
|
|
024 |
Victoria Tower |
6,7 |
Monte Hacho |
6,4 |
6,6 |
0,4 |
|
|
Average R 95% |
0,35 |
||||||
Table 6.5 – Determine the position by 2 distances
|
Waypoint |
Landmark |
D, nm |
Landmark |
D, nm |
SC |
R 95%, nm |
|
|
016 |
Punto Malabata |
6,1 |
Punta Maroqqui |
6,9 |
7 |
0,21 |
|
|
017 |
Punta Maroqqui |
5,3 |
Punto Cires |
7,5 |
8 |
0,24 |
|
|
018 |
Punta Maroqqui |
4,5 |
Punto Cires |
5,4 |
6 |
0,18 |
|
|
019 |
Punta Maroqqui |
4,9 |
Punto Cires |
3,5 |
5 |
0,15 |
|
|
020 |
Punta Maroqqui |
6,3 |
Punto Cires |
2,8 |
7 |
0,21 |
|
|
021 |
Punto Carnero |
6,8 |
Punto Cires |
3,9 |
7 |
0,21 |
|
|
022 |
Punto Carnero |
6,1 |
Monte Hacho |
7,6 |
8 |
0,24 |
|
|
023 |
Punto Carnero |
6,3 |
Monte Hacho |
6,6 |
7 |
0,21 |
|
|
024 |
Victoria Tower |
6,7 |
Monte Hacho |
6,4 |
7 |
0,21 |
|
|
Average R 95% |
0,21 |
||||||
Table 6.6 – Determine the position by 1 bearing and 1 distance
|
Waypoint |
Landmark |
D, nm |
SC |
R 95%, nm |
|
|
016 |
Punto Malabata |
6,1 |
7 |
0,28 |
|
|
017 |
Punta Maroqqui |
5,3 |
6 |
0,24 |
|
|
018 |
Punta Maroqqui |
4,5 |
5 |
0,2 |
|
|
019 |
Punto Cires |
3,5 |
4 |
0,16 |
|
|
020 |
Punto Cires |
2,8 |
3 |
0,12 |
|
|
021 |
Punto Cires |
3,9 |
4 |
0,16 |
|
|
022 |
Punto Carnero |
6,1 |
7 |
0,28 |
|
|
023 |
Punto Carnero |
6,3 |
7 |
0,28 |
|
|
024 |
Monte Hacho |
6,4 |
7 |
0,28 |
|
|
Average R 95% |
0,22 |
||||
Analysis of the tables shows that the spare method of observations at a selected navigation line is optimal according to the accuracy criteria is determining of the position by 2 distances.