
- •Table of Contents
- •Mastering UML with Rational Rose 2002
- •Chapter 1: Introduction to UML
- •Encapsulation
- •Inheritance
- •Polymorphism
- •What Is Visual Modeling?
- •Systems of Graphical Notation
- •Booch Notation
- •Object Management Technology (OMT)
- •Unified Modeling Language (UML)
- •Understanding UML Diagrams
- •Business Use Case Diagrams
- •Use Case Diagrams
- •Activity Diagrams
- •Sequence Diagrams
- •Collaboration Diagrams
- •Class Diagrams
- •Statechart Diagrams
- •Component Diagrams
- •Deployment Diagrams
- •Visual Modeling and the Software Development Process
- •Inception
- •Elaboration
- •Construction
- •Transition
- •Summary
- •Chapter 2: A Tour of Rose
- •What Is Rose?
- •Getting Around in Rose
- •Parts of the Screen
- •Exploring Four Views in a Rose Model
- •Use Case View
- •Logical View
- •Component View
- •Deployment View
- •Working with Rose
- •Creating Models
- •Saving Models
- •Exporting and Importing Models
- •Publishing Models to the Web
- •Working with Controlled Units
- •Using the Model Integrator
- •Working with Notes
- •Working with Packages
- •Adding Files and URLs to Rose Model Elements
- •Adding and Deleting Diagrams
- •Setting Global Options
- •Working with Fonts
- •Working with Colors
- •Summary
- •Chapter 3: Business Modeling
- •Introduction to Business Modeling
- •Why Model the Business?
- •Do I Need to Do Business Modeling?
- •Business Modeling in an Iterative Process
- •Business Actors
- •Business Workers
- •Business Use Cases
- •Business Use Case Diagrams
- •Activity Diagrams
- •Business Entities
- •Organization Unit
- •Where Do I Start?
- •Identifying the Business Actors
- •Identifying the Business Workers
- •Identifying the Business Use Cases
- •Showing the Interactions
- •Documenting the Details
- •Creating Business Use Case Diagrams
- •Deleting Business Use Case Diagrams
- •The Use Case Diagram Toolbar
- •Adding Business Use Cases
- •Business Use Case Specifications
- •Assigning a Priority to a Business Use Case
- •Viewing Diagrams for a Business Use Case
- •Viewing Relationships for a Business Use Case
- •Working with Business Actors
- •Adding Business Actors
- •Adding Actor Specifications
- •Assigning an Actor Stereotype
- •Setting Business Actor Multiplicity
- •Viewing Relationships for a Business Actor
- •Working with Relationships
- •Association Relationship
- •Generalization Relationship
- •Working with Organization Units
- •Adding Organization Units
- •Deleting Organization Units
- •Activity Diagrams
- •Adding an Activity Diagram
- •Adding Details to an Activity Diagram
- •Summary
- •Chapter 4: Use Cases and Actors
- •Use Case Modeling Concepts
- •Actors
- •Use Cases
- •Traceability
- •Flow of Events
- •Relationships
- •Use Case Diagrams
- •Activity Diagrams
- •Activity
- •Start and End States
- •Objects and Object Flows
- •Transitions
- •Synchronization
- •Working with Use Cases in Rational Rose
- •The Use Case Diagram Toolbar
- •Creating Use Case Diagrams
- •Deleting Use Case Diagrams
- •Adding Use Cases
- •Deleting Use Cases
- •Use Case Specifications
- •Naming a Use Case
- •Viewing Participants of a Use Case
- •Assigning a Use Case Stereotype
- •Assigning a Priority to a Use Case
- •Creating an Abstract Use Case
- •Viewing Diagrams for a Use Case
- •Viewing Relationships for a Use Case
- •Working with Actors
- •Adding Actors
- •Deleting Actors
- •Actor Specifications
- •Naming Actors
- •Assigning an Actor Stereotype
- •Setting Actor Multiplicity
- •Creating an Abstract Actor
- •Viewing Relationships for an Actor
- •Viewing an Actor's Instances
- •Working with Relationships
- •Association Relationship
- •Includes Relationship
- •Extends Relationship
- •Generalization Relationship
- •Working with Activity Diagrams
- •The Activity Diagram Toolbar
- •Creating Activity Diagrams
- •Deleting Activity Diagrams
- •Exercise
- •Problem Statement
- •Create a Use Case Diagram
- •Summary
- •Chapter 5: Object Interaction
- •Interaction Diagrams
- •What Is an Object?
- •What Is a Class?
- •Where Do I Start?
- •Finding Objects
- •Finding the Actor
- •Using Interaction Diagrams
- •Sequence Diagrams
- •The Sequence Diagram Toolbar
- •Collaboration Diagrams
- •The Collaboration Diagram Toolbar
- •Working with Actors on an Interaction Diagram
- •Working with Objects
- •Adding Objects to an Interaction Diagram
- •Deleting Objects from an Interaction Diagram
- •Setting Object Specifications
- •Naming an Object
- •Mapping an Object to a Class
- •Setting Object Persistence
- •Using Multiple Instances of an Object
- •Working with Messages
- •Adding Messages to an Interaction Diagram
- •Adding Messages to a Sequence Diagram
- •Deleting Messages from a Sequence Diagram
- •Reordering Messages in a Sequence Diagram
- •Message Numbering in a Sequence Diagram
- •Viewing the Focus of Control in a Sequence Diagram
- •Adding Messages to a Collaboration Diagram
- •Deleting Messages from a Collaboration Diagram
- •Message Numbering in a Collaboration Diagram
- •Adding Data Flows to a Collaboration Diagram
- •Setting Message Specifications
- •Naming a Message
- •Mapping a Message to an Operation
- •Setting Message Synchronization Options
- •Setting Message Frequency
- •End of a Lifeline
- •Working with Scripts
- •Switching Between Sequence and Collaboration Diagrams
- •Exercise
- •Problem Statement
- •Create Interaction Diagrams
- •Summary
- •Chapter 6: Classes and Packages
- •Logical View of a Rose Model
- •Class Diagrams
- •What Is a Class?
- •Finding Classes
- •Creating Class Diagrams
- •Deleting Class Diagrams
- •Organizing Items on a Class Diagram
- •Using the Class Diagram Toolbar
- •Working with Classes
- •Adding Classes
- •Class Stereotypes
- •Analysis Stereotypes
- •Class Types
- •Interfaces
- •Web Modeling Stereotypes
- •Other Language Stereotypes
- •Class Specifications
- •Naming a Class
- •Setting Class Visibility
- •Setting Class Multiplicity
- •Setting Storage Requirements for a Class
- •Setting Class Persistence
- •Setting Class Concurrency
- •Creating an Abstract Class
- •Viewing Class Attributes
- •Viewing Class Operations
- •Viewing Class Relationships
- •Using Nested Classes
- •Viewing the Interaction Diagrams That Contain a Class
- •Setting Java Class Specifications
- •Setting CORBA Class Specifications
- •Working with Packages
- •Adding Packages
- •Deleting Packages
- •Exercise
- •Problem Statement
- •Creating a Class Diagram
- •Summary
- •Chapter 7: Attributes and Operations
- •Working with Attributes
- •Finding Attributes
- •Adding Attributes
- •Deleting Attributes
- •Setting Attribute Specifications
- •Setting the Attribute Containment
- •Making an Attribute Static
- •Specifying a Derived Attribute
- •Working with Operations
- •Finding Operations
- •Adding Operations
- •Deleting Operations
- •Setting Operation Specifications
- •Adding Arguments to an Operation
- •Specifying the Operation Protocol
- •Specifying the Operation Qualifications
- •Specifying the Operation Exceptions
- •Specifying the Operation Size
- •Specifying the Operation Time
- •Specifying the Operation Concurrency
- •Specifying the Operation Preconditions
- •Specifying the Operation Postconditions
- •Specifying the Operation Semantics
- •Displaying Attributes and Operations on Class Diagrams
- •Showing Attributes
- •Showing Operations
- •Showing Visibility
- •Showing Stereotypes
- •Mapping Operations to Messages
- •Mapping an Operation to a Message on an Interaction Diagram
- •Exercise
- •Problem Statement
- •Add Attributes and Operations
- •Summary
- •Chapter 8: Relationships
- •Relationships
- •Types of Relationships
- •Finding Relationships
- •Associations
- •Using Web Association Stereotypes
- •Creating Associations
- •Deleting Associations
- •Dependencies
- •Creating Dependencies
- •Deleting Dependencies
- •Package Dependencies
- •Creating Package Dependencies
- •Deleting Package Dependencies
- •Aggregations
- •Creating Aggregations
- •Deleting Aggregations
- •Generalizations
- •Creating Generalizations
- •Deleting Generalizations
- •Working with Relationships
- •Setting Multiplicity
- •Using Relationship Names
- •Using Stereotypes
- •Using Roles
- •Setting Export Control
- •Using Static Relationships
- •Using Friend Relationships
- •Setting Containment
- •Using Qualifiers
- •Using Link Elements
- •Using Constraints
- •Exercise
- •Problem Statement
- •Adding Relationships
- •Summary
- •Chapter 9: Object Behavior
- •Statechart Diagrams
- •Creating a Statechart Diagram
- •Adding States
- •Adding State Details
- •Adding Transitions
- •Adding Transition Details
- •Adding Special States
- •Using Nested States and State History
- •Exercise
- •Problem Statement
- •Create a Statechart Diagram
- •Summary
- •Chapter 10: Component View
- •What Is a Component?
- •Types of Components
- •Component Diagrams
- •Creating Component Diagrams
- •Adding Components
- •Adding Component Details
- •Adding Component Dependencies
- •Exercise
- •Problem Statement
- •Summary
- •Chapter 11: Deployment View
- •Deployment Diagrams
- •Opening the Deployment Diagram
- •Adding Processors
- •Adding Processor Details
- •Adding Devices
- •Adding Device Details
- •Adding Connections
- •Adding Connection Details
- •Adding Processes
- •Exercise
- •Problem Statement
- •Create Deployment Diagram
- •Summary
- •Chapter 12: Introduction to Code Generation and Reverse Engineering Using Rational Rose
- •Preparing for Code Generation
- •Step One: Check the Model
- •Step Two: Create Components
- •Step Three: Map Classes to Components
- •Step Five: Select a Class, Component, or Package
- •Step Six: Generate Code
- •What Gets Generated?
- •Introduction to Reverse Engineering Using Rational Rose
- •Model Elements Created During Reverse Engineering
- •Summary
- •Chapter 13: ANSI C++ and Visual C++ Code Generation and Reverse Engineering
- •Generating Code in ANSI C++ and Visual C++
- •Converting a C++ Model to an ANSI C++ Model
- •Class Properties
- •Attribute Properties
- •Operation Properties
- •Package (Class Category) Properties
- •Component (Module Specification) Properties
- •Role Properties
- •Generalization Properties
- •Class Model Assistant
- •Component Properties
- •Project Properties
- •Visual C++ and ATL Objects
- •Generated Code
- •Code Generated for Classes
- •Code Generated for Attributes
- •Code Generated for Operations
- •Visual C++ Code Generation
- •Reverse Engineering ANSI C++
- •Reverse Engineering Visual C++
- •Summary
- •Overview
- •Introduction to Rose J
- •Beginning a Java Project
- •Selecting a Java Framework
- •Linking to IBM VisualAge for Java
- •Linking to Microsoft Visual J++
- •Project Properties
- •Class Properties
- •Attribute Properties
- •Operation Properties
- •Module Properties
- •Role Properties
- •Generating Code
- •Generated Code
- •Classes
- •Attributes
- •Operations
- •Bidirectional Associations
- •Unidirectional Associations
- •Associations with a Multiplicity of One to Many
- •Associations with a Multiplicity of Many to Many
- •Reflexive Associations
- •Aggregations
- •Dependency Relationships
- •Generalization Relationships
- •Interfaces
- •Java Beans
- •Support for J2EE
- •EJBs
- •Servlets
- •JAR and WAR Files
- •Automated J2EE Deployment
- •Reverse Engineering
- •Summary
- •Starting a Visual Basic Project
- •Class Properties
- •Attribute Properties
- •Operation Properties
- •Module Specification Properties
- •Role Properties
- •Generalization Properties
- •Generated Code
- •Classes
- •Attributes
- •Operations
- •Bidirectional Associations
- •Unidirectional Associations
- •Associations with a Multiplicity of One to Many
- •Associations with a Multiplicity of Many to Many
- •Reflexive Associations
- •Aggregations
- •Dependency Relationships
- •Generalization Relationships
- •Reverse Engineering
- •Summary
- •Overview
- •Introduction to XML DTD
- •Elements
- •Attributes
- •Entities and Notations
- •Project Properties
- •Class Properties
- •Attribute Properties
- •Role Properties
- •Component Properties
- •Generating Code
- •Generated Code
- •Classes
- •Attributes
- •Reverse Engineering DTD
- •Summary
- •Project Properties
- •Class Properties
- •Attribute Properties
- •Operation Properties
- •Module Properties
- •Association (Role) Properties
- •Dependency Properties
- •Generated Code
- •Classes
- •Attributes
- •Operations
- •Bidirectional Associations
- •Unidirectional Associations
- •Associations with a Multiplicity of One to Many
- •Associations with a Multiplicity of Many to Many
- •Associations with Bounded Multiplicity
- •Reflexive Associations
- •Aggregations
- •Dependency Relationships
- •Generalization Relationships
- •Reverse Engineering CORBA Source Code
- •Summary
- •Chapter 18: Rose Data Modeler
- •Object Models and Data Models
- •Creating a Data Model
- •Logic in a Data Model
- •Adding a Database
- •Adding Tablespaces
- •Adding a Schema
- •Creating a Data Model Diagram
- •Creating Domain Packages and Domains
- •Adding Tables
- •Adding Columns
- •Setting a Primary Key
- •Adding Constraints
- •Adding Triggers
- •Adding Indexes
- •Adding Stored Procedures
- •Adding Relationships
- •Adding Referential Integrity Rules
- •Working with Views
- •Generating an Object Model from a Data Model
- •Generating a Data Model from an Object Model
- •Generating a Database from a Data Model
- •Updating an Existing Database
- •Reverse Engineering a Database
- •Summary
- •Chapter 19: Web Modeling
- •Modeling a Web Application
- •Web Class Stereotypes
- •Relationships
- •Reverse Engineering a Web Application
- •Generating Code for a Web Application
- •Summary
- •Appendix: Getting Started with UML
- •Building a Business Use Case Diagram
- •Building a Workflow (Activity) Diagram
- •Building a Use Case Diagram
- •Building an Interaction Diagram
- •Building a Class Diagram
- •Web Modeling
- •Adding Class Relationships
- •Building a Statechart Diagram
- •Building a Component Diagram
- •Building a Deployment Diagram

Chapter 1: Introduction to UML
Sequence Diagrams
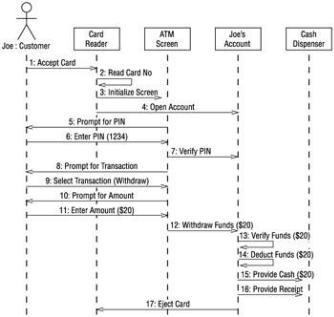
Sequence diagrams are used to show the flow of functionality through a use case. For example, the Withdraw Money use case has several possible sequences, such as withdrawing money, attempting to withdraw without available funds, attempting to withdraw with the wrong PIN, and several others. The normal scenario of withdrawing $20 (without any problems such as entering the wrong PIN or insufficient funds in the account) is shown in Figure 1.11.
Figure 1.11: Sequence diagram for Joe withdrawing $20
This Sequence diagram shows the flow of processing through the Withdraw Money use case. Any actors involved are shown at the top of the diagram; the customer actor is shown in the above example. The objects that the system needs in order to perform the Withdraw Money use case are also shown at the top of the diagram. Each arrow represents a message passed between actor and object or object and object to perform the needed functionality. One other note about Sequence diagrams—they display objects, not classes. Classes represent types of objects, as we'll discuss later in Chapter 5, "Object Interaction." Objects are specific; instead of just customer, the Sequence diagram shows Joe.
The use case starts with the customer inserting his card into the card reader, an object indicated by the rectangle at the top of the diagram. Then, the card reader reads the card number, opens Joe's account object, and initializes the ATM screen. The screen prompts Joe for his PIN. He enters 1234. The screen verifies the PIN with the account object and they match. The screen presents Joe with his options, and he chooses withdraw. The screen then prompts Joe for the amount to withdraw. He chooses $20. Then, the screen withdraws the funds from the account. This initiates a series of processes that the account object performs. First, Joe's account verifies that the account contains at least $20. Then, it deducts the funds from the account. Next, it instructs the cash dispenser to provide $20 in cash. Joe's account also instructs the dispenser to provide a receipt. Lastly, it instructs the card reader to eject the card.
This Sequence diagram illustrated the entire flow of processing for the Withdraw Money use case by showing a specific example of Joe withdrawing $20 from his account. Users can look at these diagrams to see the specifics of their business processing. Analysts see the flow of processing in the Sequence diagrams. Developers see objects that need to be developed and operations for those objects. Quality assurance
16

Chapter 1: Introduction to UML
engineers can see the details of the process and develop test cases based on the processing. Sequence diagrams are therefore useful for all stakeholders in the project.
Collaboration Diagrams
Collaboration diagrams show exactly the same information as the Sequence diagrams. However, Collaboration diagrams show this information in a different way and with a different purpose. The Sequence diagram illustrated in Figure 1.11 is shown in Figure 1.12 as a Collaboration diagram.
Figure 1.12: Collaboration diagram for Joe withdrawing $20
In this Collaboration diagram, the objects are represented as rectangles and the actors are stick figures, as before. Whereas the Sequence diagram illustrates the objects and actor interactions over time, the Collaboration diagram shows the objects and actor interactions without reference to time. For example, in this diagram, we see that the card reader instructs Joe's account to open and Joe's account instructs the card reader to eject the card. Also, objects that directly communicate with each other are shown with lines drawn between them. If the ATM screen and cash dispenser directly communicated with one another, a line would be drawn between them. The absence of a line means that no communication occurs directly between those two objects.
Collaboration diagrams, therefore, show the same information as Sequence diagrams, but people look at Collaboration diagrams for different reasons. Quality assurance engineers and system architects look at these to see the distribution of processing between objects. Suppose that the Collaboration diagram was shaped like a star, with several objects communicating with a central object. A system architect may conclude that the system is too dependent on the central object and redesign the objects to distribute the processing power more evenly. This type of interaction would have been difficult to see in a Sequence diagram.
Class Diagrams
Class diagrams show the interactions between classes in the system. Classes can be seen as the blueprint for objects, as we'll discuss in Chapter 5. Joe's account, for example, is an object. An account is a blueprint for Joe's checking account; an account is a class. Classes contain information and behavior that acts on that information. The Account class contains the customer's PIN and behavior to check the PIN. A class on a Class diagram is created for each type of object in a Sequence or Collaboration diagram. The Class diagram for the system's Withdraw Money use case is illustrated in Figure 1.13.
17

Chapter 1: Introduction to UML
Figure 1.13: Class diagram for the ATM system's Withdraw Money use case
The Class diagram above shows the relationships between the classes that implement the Withdraw Money use case. This is done with four classes: Card Reader, Account, ATM Screen, and Cash Dispenser. Each class on a Class diagram is represented by a rectangle divided into three sections. The first section shows the class name. The second section shows the attributes the class contains. An attribute is a piece of information that is associated with a class. For example, the Account class contains three attributes: Account Number, PIN, and Balance. The last section contains the operations of the class. An operation is some behavior that the class will provide. The Account class contains four operations: Open, Withdraw Funds, Deduct Funds, and Verify Funds.
The lines connecting classes show the communication relationships between the classes. For instance, the Account class is connected with the ATM Screen class because the two directly communicate with each other. The Card Reader is not connected to the Cash Dispenser because the two do not communicate. Another point of interest is that some attributes and operations have small padlocks to the left of them. The padlock indicates a private attribute or operation. Private attributes and operations can only be accessed from within the class that contains them. The Account Number, PIN, and Balance are all private attributes of the Account class. In addition, the Deduct Funds and Verify Funds operations are private to the Account class.
Developers use Class diagrams to actually develop the classes. Tools such as Rose generate skeletal code for classes, then developers flesh out the details in the language of their choice. Analysts use Class diagrams to show the details of the system. Architects also look at Class diagrams to see the design of the system. If one class contains too much functionality, an architect can see this in the Class diagram and split out the functionality into multiple classes. Should no relationship exist between classes that communicate with each other, an architect or developer can see this too. Class diagrams should be created to show the classes that work together in each use case, and comprehensive diagrams containing whole systems or subsystems can be created as well.
Statechart Diagrams
Statechart diagrams provide a way to model the various states in which an object can exist. While the Class diagrams show a static picture of the classes and their relationships, Statechart diagrams are used to model the more dynamic behavior of a system. These types of diagrams are extensively used in building real−time systems. Rose can even generate the full code for a real−time system from the Statechart diagrams.
A Statechart diagram shows the behavior of an object. For example, a bank account can exist in several different states. It can be open, closed, or overdrawn. An account may behave differently when it is in each of
18

Chapter 1: Introduction to UML
these states. Statechart diagrams are used to show this information. Figure 1.14 shows an example of a Statechart diagram for a bank account.
Figure 1.14: Statechart diagram for the Account class
In this diagram, we can see the states in which an account can exist. We can also see how an account moves from one state to another. For example, when an account is open and the customer requests the account's closure, the account moves to the closed state. The customer's request is called the event and the event is what causes a transition from one state to another.
If the account is open and the customer makes a withdrawal, the account may move to the overdrawn state. This will only happen if the balance of the account is less than zero. We show this by placing [Balance < 0] on the diagram. A condition enclosed in square brackets is called a guard condition, and controls when a transition can or cannot occur.
There are two special states—the start state and the stop state. The start state is represented by a black dot on the diagram, and indicates what state the object is in when it is first created. The stop state is represented by a bull's−eye, and shows what state the object is in just before it is destroyed. On a Statechart diagram, there is one and only one start state. On the other hand, you can have no stop state, or there can be as many stop states as you need.
Certain things may happen when the object is inside a particular state. In our example, when an account is overdrawn, a notice is sent to the customer. Processes that occur while an object is in a certain state are called actions.
Statechart diagrams aren't created for every class; they are used only for very complex classes. If an object of the class can exist in several states, and behaves very differently in each of the states, you may want to create a Statechart diagram for it. Many projects won't need these diagrams at all. If they are created, developers will use them when developing the classes.
Statechart diagrams are created for documentation only. When you generate code from your Rose model, no code will be generated from the information on the Statechart diagrams. However, Rose add−ins are available for real−time systems that can generate executable code based on Statechart diagrams.
Component Diagrams
Component diagrams show you a physical view of your model, as well as the software components in your system and the relationships between them. There are two types of components on the diagram: executable
19

Chapter 1: Introduction to UML
components and code libraries.
In Rose, each of the classes in the model is mapped to a source code component. Once the components have been created, they are added to the Component diagram. Dependencies are then drawn between the components. Component dependencies show the compile−time and run−time dependencies between the components. Figure 1.15 illustrates one of the Component diagrams for the ATM system.
Figure 1.15: Component diagram for the ATM client
This Component diagram shows the client components in the ATM system. In this case, the team decided to build the system using C++. Each class has its own header and body file, so each class is mapped to its own components in the diagram. For example, the ATM Screen class is mapped to the ATM Screen component.
The ATM Screen class is also mapped to a second ATM Screen component. These two components represent the header and body of the ATM Screen class. The shaded component is called a package body. It represents the body file (.cpp) of the ATM Screen class in C++. The unshaded component is called a package specification. The package specification represents the header (.h) file of the C++ class. The component called ATM.exe is a task specification and represents a thread of processing. In this case, the thread of processing is the executable program.
Components are connected by dashed lines showing the dependency relationships between them. For example, the Card Reader class is dependent upon the ATM Screen class. This means that the ATM Screen class must be available in order for the Card Reader class to compile. Once all of the classes have been compiled, then the executable called ATMClient.exe can be created.
The ATM example has two threads of processing and therefore two executables. One executable comprises the ATM client, including the Cash Dispenser, Card Reader, and ATM Screen. The second executable comprises the ATM server, including the Account component. The Component diagram for the ATM server is shown in Figure 1.16.
Figure 1.16: Component diagram for the ATM server
20