

DB European Building Construction 2019 Outlook_watermark
.pdfEuropean Building & Construction
vk.com/id446425943
Deutsche Bank Research
Europe |
|
Industry |
|
Date |
|
|
|||
|
|
European Building & |
|
3 December 2018 |
|
|
|
|
|
Building & Construction |
|
Construction |
|
Recommendation |
|
|
Change |
||
Building Materials |
|
|
|
|
|
|
|
|
|
|
|
|
|
|
2019 Outlook: Upgrade LafargeHolcim to Buy, top-pick with Sika
With this note, we transfer primary coverage of CRH and Saint Gobain from Glynis Johnson, and Geberit, Kingspan, Sika and Tarkett from Priyal Mulji to Xavier Marchand with immediate effect.
LafargeHolcim and Sika top-picks; downgrading Heidelberg to Hold
We upgrade LafargeHolcim to Buy: driven by EM improvement (c55% of Group Sales) and self-help, our FY 19E EBITDA forecasts are c2.5-3% above consensus. We also like Sika for its sector-leading profit growth in 2019E and itshigh exposure to the more late-cycle and resilient renovation segment. As concerns are mounting on the longevity of the construction cycle in DM, we downgrade to Hold stocks with high DM newbuild exposure (Heidelberg, Kingspan and Titan). Valuation suggests that a macro slowdown has already been priced infor most stocksweremain positiveonSaintGobainwhich we believeis the key value play.
What's new in the report?
In this report we have addressed key questions from investors: has the weather indeed impacted US volumes in 2018? Is the US housing slowdown a temporary or a structural issue? Could productivitya increase compensatefor a labor shortage in the US? Will renovation in Europe mitigate a newbuild residential slowdown? Has EM profitability finally troughed? Finally, will there be some price vs. cost improvement in 2019? Is a sharp macro slowdown already priced in?
Preference for renovation in DM and select EM exposure
With newbuild lead indicators clearly weakening across DM, we prefer the more late-cycle and resilient renovation segment: this drives our preference for Sika and Saint Gobain while we are more cautious on Kingspan (highest exposure to newbuild activities in DM) butalso CRH and Titan. After six years of capacity utilization decrease, we see finally improving momentum in EM: demand should benefit with a lag from the commodities price increase while capacity additions are slowing down: key for LafargeHolcim.
Sector trades well below mid-cycle level: Saint Gobain is the value play
After the 2018 de-rating, the sector now trades at 13.7x 2019E P/E, c.8% below mid-cycle level. We believe Saint Gobain is the key value play: it trades at 8.9x 2019E P/E, i.e. 28% below mid-cycle and c19% above the historical trough level. After YTD strong performance, Kingspan's valuation discount vs. peer group (Sika and Geberit) has faded and is now back to pre-Brexit level, which could leave it vulnerable to any negative news on the UK market. Valuation and Risks
Xavier Marchand Research Analyst +44-20-754-51400
Viraj Joshi
Research Associate
Key Changes |
|
|
Company |
Target Price |
Rating |
BZU.MI |
25.50 to 21.00 |
- |
CRH.I |
34.80 to 28.00 |
- |
CX.N |
8.40 to 6.00 |
- |
GEBN.S |
443.00 to |
- |
|
430.00 |
|
HEIG.DE |
75.00 to 72.00 |
Buy to Hold |
KSP.I |
46.50 to 45.00 |
Buy to Hold |
LHN.S |
48.00 to 54.00 |
Hold to Buy |
SGOB.PA |
55.80 to 43.00 |
- |
SIKA.S |
168.00 to |
- |
|
160.00 |
|
TKTT.PA |
24.70 to 20.50 |
- |
TTNr.AT |
26.00 to 21.00 |
Buy to Hold |
Source: Deutsche Bank |
|
|
|
||
|
|
|
Top picks |
|
|
LafargeHolcim (LHN.S),CHF44.82 |
Buy |
|
Sika (SIKA.S),CHF121.30 |
Buy |
|
Saint Gobain (SGOB.PA),EUR32.94 |
Buy |
|
Source: Deutsche Bank |
|
|
Deutsche Bank AG/London
Distributed on: 03/12/2018 03:00:00 GMT
Deutsche Bank does and seeks to do business with companies covered in its research reports. Thus, investors should be aware that the firm may have a conflict of interest that could a ect the objectivity of this report. Investors should consider this report as only a single factor in making their investment decision. DISCLOSURES AND ANALYST CERTIFICATIONS ARE LOCATED IN APPENDIX 1. MCI (P) 091/04/2018.
7T2se3r0Ot6kwoPa

vk.com/id446425943 |
|
3 December 2018 |
|
Building Materials |
|
European Building & Construction |
|
Table Of Contents |
|
Key themes......................................................................... |
3 |
Top picks & key recommendation changes........................ |
4 |
What happened in 2018?................................................... |
7 |
Prefer renovation in DM and select EM............................ |
10 |
The US: Robust growth in 2019 but housing risks are mounting.................... |
11 |
Europe: New-build weakening but renovation more resilient.......................... |
19 |
Emerging Markets: More upside than downside potential.............................. |
23 |
Companies' exposure by region....................................................................... |
27 |
Price vs. costs to remain an issue in H1 19...................... |
29 |
At spot price, FX to be a tailwind on EURO stocks.......... |
36 |
DB forecasts vs. consensus.............................................. |
37 |
Valuation - Sector trades well below mid-cycle................ |
38 |
Company Section (A-Z)..................................................... |
41 |
Buzzi Unicem (BUY)......................................................................................... |
42 |
Cemex (BUY)..................................................................................................... |
45 |
CRH (HOLD)...................................................................................................... |
48 |
Geberit (HOLD)................................................................................................. |
53 |
HeidelbergCement (Downgrade to HOLD)....................................................... |
56 |
Kingspan (Downgrade to HOLD)...................................................................... |
60 |
LafargeHolcim (Upgrade to BUY)..................................................................... |
64 |
Saint Gobain (BUY)........................................................................................... |
69 |
Sika (BUY)......................................................................................................... |
73 |
Tarkett (HOLD).................................................................................................. |
77 |
Titan Cement (Downgrade to HOLD)............................................................... |
80 |
Valuation and Risks.......................................................... |
83 |
Page 2 |
Deutsche Bank AG/London |

vk.com/id446425943
Deutsche |
Key themes |
|
|
|
|
Bank |
■ |
Sector performance has been historically well correlated to European PMI evolution |
AG/London |
■ |
The US growth should show no sign of moderation in 2019 |
|
||
|
■ |
3-6% volume upside on US footprints in case of weather normalization |
|
■ |
But concerns are mounting on the sustainability of US housing |
|
■ |
Labour shortage could constrain US construction growth pattern |
|
■ |
European residential new-build data have weakened through 2018 |
|
■ |
Europe renovation should be more resilient than residential new-build |
|
■ |
Improving demand growth profile in 2019 in EM |
|
■ |
More upside than downside on LafargeHolcim and Heidelberg EM footprints. |
|
■ |
Exposure to DM renovation and EM could help mitigate a macro slowdown. |
|
■ |
Price vs. cost to remain an issue in H1 19: self-help and op leverage to be key |
|
■ |
LafargeHolcim to benefit from self-help in 2019. |
|
■ |
Disconnection of stocks' P/E vs. PMI suggests a sharp slowdown is already priced in |
3 Page
Building European |
2018 December 3 Materials Building |
Construction & |
|

vk.com/id446425943
4 Page |
|
Top picks & key recommendation changes |
|
||
|
|
Top picks |
|
|
LafargeHolcim (upgrade to Buy) - EM improvement drives upside to consensus |
|
|
While EM exposure has long been a worry for investors, our bottom-up analysis shows now more upside than downside potential on LafargeHolcim EM |
|
|
portfolio. For the first time since 2012, we forecast a capacity utilization improvement in EM, driven by better demand growth (helped by a lag from higher |
|
|
commodities prices) and the moderation of new supply (due to more normalized prices / margin conditions in EM). Reflecting this, we have factored in a |
|
|
modest +3% lfl EBITDA improvement in EM in 2019 – however, this, combined with DM improvement and the benefit of the cost savings (CHF250m assumed, |
|
|
i.e. c4% of FY 19E EBITDA assumed) is enough to bring our FY 19E EBITDA forecasts >2.5% above consensus. With easy comps for the next three sets |
|
|
of results, we see potential for an earnings upgrade. Trading at 11.8x 2019E P/E, 4.5% dividend yield and 7% FCF yield, we believe there is value in the |
|
|
stock. Upgrade to Buy. |
|
|
Sika (Buy) - Sector-leading EBIT growth in 2019 and robust business model for any macro slowdown |
|
|
Led by continued top-line growth, raw materials' costs moderation and high operational leverage, we forecast Sika to deliver the best top-line and EBIT growth |
|
|
in 2019 across the sector (respectively, +5% and +15%). We also see Sika business model as very resilient to a potential downturn: it combines the lowest |
|
|
exposure across the sector to the very cyclical new-build segment in DM, an increasing geographical diversification and a proven track record of market |
|
|
outperformance through increased products penetration. Following recent macro concerns, Sika trades now at 13.9x 2019E EV/EBITDA and 4.6% FCF yield, |
|
|
which is, in our view, a compelling entry point for a quality growth stock: Buy. |
|
|
Saint Gobain (Buy) - Recession scenario already priced in |
|
|
Since the start of the year, Saint Gobain's share price has declined by 27% as the stock has been hit by the rollover of new residential construction data |
|
|
in Europe (especially in France) as well as the fade in European PMI. Yet, with its strong exposure to the more late-cycle and resilient renovation segment |
|
|
and its increasing exposure to EM, we believe the stock should be less a ected than others by the slowdown in European new-build data. In addition, with |
|
|
strong pricing momentum and easy comps in H1, we see limited risks to consensus. Saint Gobain trades at 8.9x 2019 P/E and 5.8x 2019E EV/EBITDA, levels |
|
|
which have been seen historically only during the severe recession periods of 2008 and 2012. As such, we believe a recession scenario is already priced in |
|
|
and see a favourable risk-reward. Buy. |
|
|
Buzzi (Buy) - Self-help and markets restructuring to provide most of 2019E EBITDA growth |
|
|
While since 2012, Buzzi’s EBITDA growth has been mainly driven by the US market recovery, we see now >80% of EBITDA growth excl. FX impact in 2019E |
|
|
coming from Italy and Germany. With conservative volume assumptions in these two countries (respectively -3% and 0%), the improvement comes exclusively |
|
|
from self-help and the positive impact from restructuring on prices. In the US, we include in our forecasts another year of margin decrease for 2019E - we |
|
|
believe this could prove conservative as the Ash Grove acquisition by CRH should have a positive impact on the Mississippi region cement prices (>70% of |
|
|
Buzzi US cement sales). In spite of these prudent assumptions, DB FY 19E EBITDA forecasts are in line with consensus. With potential upside to our forecasts |
|
|
and consensus and attractive valuation (5.1x 2019E EV/EBITDA, e.g. 25-30% discount vs. cement peers), we see value in the stock. Buy. |
AG/London Bank Deutsche |
|
|
Building European |
2018 December 3 Materials Building |
Construction & |
|

vk.com/id446425943
Deutsche |
Other key recommendation changes |
|
|
||
|
HeidelbergCement (downgrade to Hold) - Lack of short-term catalysts |
|
Bank |
While we have barely changed our EBITDA forecasts for2019, we downgrade Heidelberg to Hold as, in ourview, the stock lacks short-termcatalysts. |
|
After a recent profit warning and a probable 7-10% EBITDA miss vs. initial guidance in 2018, 2019E guidance will be taken very cautiously. In addition, our |
||
|
||
AG/London |
detailed US weather analysis on the Heidelberg footprint suggests Q1 19 comps are not as easy as it seems and finally we believe evidence of improved |
|
price vs. cost should not be seen before Q3 19. In the absence of short-term catalysts andin spite of attractive valuation (c10% FCF yield in 2019E, the |
||
|
||
|
highest among large-cap European peers), we believe the stock will be vulnerable to any negative macro news. Downgrade to Hold. |
|
|
Kingspan (downgrade to Hold) - Promising structural growth story but fairly valued |
|
|
Kingspan has been YTD the best performed across the sector (+2% vs. -23% for sector average). This is due notably to a better pricing power vs. sectors’ |
|
|
other companies, positive M&A contribution as well as reassuring comments made during the course of the yearon the UK market. While the stockhas |
|
|
since Brexit consistently traded at a 20-30% discount vs. sector’s peers (Geberit and Sika),after this year's strong performance, the discount has faded to |
|
|
c10%, in line with pre Brexit levels. In our view, this could leave the stock vulnerable to any negative comment on the UK market. In addition, Kingspan has |
|
|
the sector’s highest exposureto new-build construction activity (c70% of sales) which is more cyclical than the renovation segment at a time where |
|
|
investors are increasingly cautious on the longevity of the construction cycle in Europe and North America. While we still like Kingspan proven track record |
|
|
of structural growth ahead of construction markets, we believe the risk-reward profile is now more balanced. Downgrade to HOLD. |
|
|
Titan Cement (downgrade to HOLD) - US macro risks + valuation premium |
|
|
Since July 18, Titan has overperformed other cement stocks under our coverage by >12% - as a result the stock is now more expensive vs. other cement |
|
|
stocks (7.7x 2019E EV/EBITDA vs. 5.1-7.0x for others). In addition, across ourcoverage, Titan is the most leveraged stock to the US(c75-80% of Titan |
|
|
EBITDA growth in 2019E) while our analysis on US housing a ordability suggests now more downside than upside to residential forecasts. With increasing |
|
|
risks on the US residential cycle and a more expensive valuation vs. the sector, we downgrade Titan to HOLD. |
5 Page
Building European |
2018 December 3 Materials Building |
Construction & |
|

vk.com/id446425943
6Page |
Summary of changes in DB estimates |
|
|
|
|
|
|
|
|
|
|
||||||
|
|
|
|
|
|
|
|
|
|
|
|||||||
|
■ |
Following disappointing Q3 results in the sector and more cautious volumes / margins assumptions for 2019, we have in general cut our 2019E |
|||||||||||||||
|
|
EBITDA forecasts by c3-4% |
|
|
|
|
|
|
|
|
|
|
|
|
|||
|
■ |
The cuts are the highest for Tarkett (Q3 below DB expectations, margin squeeze expected to persist in H1 19) and Titan Cement (Q3 below DB |
|||||||||||||||
|
|
expectations due to weather impact in the US, more cautious assumptions in Egypt and the US for 2019E). |
|
|
|
|
|||||||||||
|
■ |
LafargeHolcim modest Recurring EBITDA cut for 2019E (c1%) reflects the change in scope due to Holcim Indonesia divestment (c1.8% FY 19E EBITDA |
|||||||||||||||
|
|
impact) |
|
|
|
|
|
|
|
|
|
|
|
|
|
|
|
|
■ |
Conversely, following a robust Q3 we have upgraded Kingspan 2019E EBITA forecasts by 2.5%. |
|
|
|
|
|
||||||||||
|
■ |
In spite of the recent Swiss Franc appreciation vs. Euro we upgrade Sika EBIT forecasts by c3% in 2019 to reflect the stock's strong operational |
|||||||||||||||
|
|
leverage and expected improved gross margin. |
|
|
|
|
|
|
|
|
|
|
|||||
|
|
|
|
|
|
|
|
|
|
|
|
|
|
|
|||
|
Figure 1: Changes in forecasts, target prices and recommendations |
|
|
|
|
|
|
|
|
|
|||||||
|
|
|
|
|
|
|
|
|
|
2019E |
|
|
2020E |
|
|
||
|
Company |
|
New DB |
% change |
|
New DB Rating |
Key operating metric* |
Key operating |
% change |
|
Adj. basic EPS |
% change |
Key operating |
% change |
Adj. basic EPS |
% change |
|
|
|
Target Price |
|
metric* |
|
metric* |
|
||||||||||
|
|
|
|
|
|
|
|
|
|
|
|
|
|
|
|||
|
Buzzi Unicem |
21.0 |
-17.6% |
|
Buy |
Recurring EBITDA |
617 |
-6.4% |
|
1.8 |
1.0% |
667 |
-7.1% |
2.1 |
1.5% |
|
|
|
Cemex |
|
6.0 |
-28.6% |
|
Buy |
EBITDA |
2,720 |
-5.1% |
|
0.5 |
-14.9% |
2,935 |
-5.3% |
0.6 |
-12.1% |
|
|
CRH |
|
28.0 |
-19.5% |
|
Hold |
EBITDA |
3,761 |
-2.2% |
|
2.1 |
-4.4% |
4,203 |
0.0% |
2.5 |
-1.4% |
|
|
Geberit |
|
430.0 |
-2.9% |
|
Hold |
EBITDA |
885 |
-3.1% |
|
17.3 |
-3.6% |
914 |
-2.8% |
18.0 |
-3.3% |
|
|
HeidelbergCement |
72.0 |
-4.0% |
|
Hold |
EBITDA |
3,218 |
1.1% |
|
6.6 |
-4.9% |
3,433 |
2.5% |
6.6 |
-13.7% |
|
|
|
Kingspan |
|
45.0 |
-3.2% |
|
Hold |
EBITA |
496 |
2.5% |
|
2.1 |
3.5% |
535 |
4.9% |
2.3 |
6.0% |
|
|
LafargeHolcim |
54.0 |
12.5% |
|
Buy |
Recurring EBITDA |
6,391 |
-1.3% |
|
3.8 |
-0.3% |
6,793 |
-1.4% |
4.3 |
-1.6% |
|
|
|
Saint Gobain |
43.0 |
-22.9% |
|
Buy |
EBIT |
3,353 |
-3.4% |
|
3.7 |
-0.2% |
3,604 |
-5.4% |
4.1 |
-2.9% |
|
|
|
Sika |
|
160.0 |
-4.8% |
|
Buy |
EBIT |
1,145 |
2.9% |
|
5.9 |
4.3% |
1,263 |
7.6% |
6.5 |
9.2% |
|
|
Tarkett |
|
20.5 |
-17.0% |
|
Hold |
EBITDA |
295 |
-11.6% |
|
1.6 |
-19.6% |
317 |
-11.7% |
1.8 |
-18.8% |
|
|
Titan Cement |
21.0 |
-19.2% |
|
Hold |
EBITDA |
299 |
-10.5% |
|
1.2 |
-30.1% |
332 |
-8.9% |
1.6 |
-27.8% |
|
|
|
Source: Deutsche Bank estimates, Companies data |
|
|
|
|
|
|
|
|
|
|
|
|
||||
|
|
|
|
|
|
|
|
|
|
|
|
|
|||||
|
|
|
|
|
|
|
|
|
|
|
|
|
|
|
|
|
|
AG/London Bank Deutsche
Building European |
2018 December 3 Materials Building |
Construction & |
|
vk.com/id446425943
Deutsche |
What happened in 2018? |
|
|
|
|
|
|
|
|
|
|
|
|
|
|
|
|
|
|
|||||||||||||
|
|
|
|
|
|
|
|
|
|
|
|
|
|
|
|
|
|
|
|
|
|
|
|
|
|
|
|
|
|
|
|
|
Bank |
Sector has underperformed the market by 13% YTD |
|
|
|
|
|
|
|
|
|
|
|
|
|
|
|
|
|
|
|||||||||||||
|
|
|
|
|
|
|
|
|
|
|
|
|
|
|
|
|
|
|
||||||||||||||
AG/London |
■ |
Like most cyclical sectors, Building & Construction has underperformed the market in 2018 (-13% YTD). This is only the second time since the US |
||||||||||||||||||||||||||||||
|
recovery in 2012. |
|
|
|
|
|
|
|
|
|
|
|
|
|
|
|
|
|
|
|
|
|
|
|
|
|
|
|
||||
|
|
|
|
|
|
|
|
|
|
|
|
|
|
|
|
|
|
|
|
|
|
|
|
|
|
|
|
|
||||
|
■ |
However, the stocks in our sector with a more structural growth element (Geberit, Kingspan & Sika) which are characterized by a better pricing power |
||||||||||||||||||||||||||||||
|
|
and a superior organic growth driven by the increase of penetration rate have once again outperformed the market in 2018. |
|
|
|
|
||||||||||||||||||||||||||
|
■ |
In the rest of the report, 'structural growth stocks' refer to Geberit, Kingspan & Sika while 'cyclical growth stocks' refer to Buzzi, Cemex, CRH, |
||||||||||||||||||||||||||||||
|
|
HeidelbergCement, LafargeHolcim, Titan, Saint Gobain and Tarkett. |
|
|
|
|
|
|
|
|
|
|
|
|
|
|
|
|
|
|
||||||||||||
|
Figure 2: Sector performance vs. STOXX 600 since 2006 |
|
|
|
Figure 3: Performance by sub-sector since 2016 |
|
|
|
|
|
|
|||||||||||||||||||||
|
30% |
|
|
|
|
|
|
|
|
|
|
|
|
|
180 |
|
|
|
|
|
|
|
|
|
|
|
|
|
|
|
|
|
|
25% |
|
|
|
|
|
|
|
|
|
24% |
|
|
|
|
|
|
|
|
|
|
|
|
|
|
|
|
|
|
|
|
|
|
|
|
|
|
|
|
|
|
|
|
|
|
160 |
|
|
|
|
|
|
|
|
|
|
|
|
|
|
|
|
|
||
|
25% |
|
|
|
|
|
|
|
|
|
|
|
|
|
|
|
|
|
|
|
|
|
|
|
|
|
|
|
|
|
|
|
|
20% |
|
|
|
14% |
|
|
14% |
|
|
|
|
|
|
|
|
|
|
|
|
|
|
|
|
|
|
|
|
|
|
|
159 |
|
|
|
|
|
|
|
|
|
|
|
|
140 |
|
|
|
|
|
|
|
|
|
|
|
|
|
|
|
|
|
|||
|
15% |
|
|
|
|
|
|
|
12% |
|
|
|
|
|
|
|
|
|
|
|
|
|
|
|
|
|
|
|
|
|||
|
|
|
|
|
|
|
|
10% |
|
|
|
|
|
|
|
|
|
|
|
|
|
|
|
|
|
|
|
|
|
113 |
||
|
10% |
|
|
|
|
|
|
|
|
|
|
|
|
|
120 |
|
|
|
|
|
|
|
|
|
|
|
|
|
|
|
|
|
|
|
|
|
|
|
|
|
|
|
|
|
|
|
|
|
|
|
|
|
|
|
|
|
|
|
|
|
|
|
|
||
|
5% |
|
|
|
|
|
|
|
|
|
|
|
2% |
|
100 |
|
|
|
|
|
|
|
|
|
|
|
|
|
|
|
|
98 |
|
|
|
|
|
|
|
|
|
|
|
|
|
|
|
|
|
|
|
|
|
|
|
|
|
|
|
|
|
|
|||
|
0% |
|
|
|
|
|
|
|
|
|
|
|
|
|
|
|
|
|
|
|
|
|
|
|
|
|
|
|
|
|
||
|
|
|
|
|
|
|
|
|
|
|
|
|
|
|
|
|
|
|
|
|
|
|
|
|
|
|
|
|
|
|
|
|
|
-5% |
|
|
|
|
|
|
|
|
|
|
|
|
|
80 |
-Mar16 |
-May16 |
-Jul16 |
-Sep16 |
-Nov16 |
-Jan17 |
-Mar17 |
-May17 |
-Jul17 |
-Sep17 |
-Nov17 |
-Jan18 |
-Mar18 |
-May18 |
-Jul18 |
-Sep18 |
-Nov18 |
|
-10% |
|
|
|
|
|
|
|
|
-7% |
|
|
|
|
-Jan16 |
|||||||||||||||||
|
|
|
|
-9% |
|
-9% |
|
|
|
|
|
-13% |
|
|
|
|
|
|
|
|
|
|
|
|
|
|
|
|
|
|
||
|
-15% |
-13% |
|
|
-13% |
|
|
|
|
|
|
|
|
|
|
|
|
|
|
|
|
|
|
|
|
|
|
|||||
|
|
|
|
|
|
|
|
|
|
|
|
|
|
|
|
|
|
|
|
|
|
|
|
|
|
|
|
|
||||
|
|
2006 |
2007 |
2008 |
2009 |
2010 |
2011 |
2012 |
2013 |
2014 |
2015 |
2016 |
2017 |
2018 |
|
|
|
|
|
|
|
|
|
|
|
|
|
|
|
|
|
|
|
|
|
|
|
|
|
|
|
|
|
|
|
|
YTD |
|
Sector vs. STOXX 600 |
|
Cyclical stocks vs. STOXX 600 |
|
|
Structural stocks vs. STOXX 600 |
|||||||||||
|
Source: Deutsche Bank, Factset. YTD as of 28 Nov closing price. |
|
|
|
|
|
|
|
Source: Deutsche Bank, Factset. Rebased to 100 on 1 Jan 2016. Data labels for 28 Nov closing price. |
|
|
|
|
|||||||||||||||||||
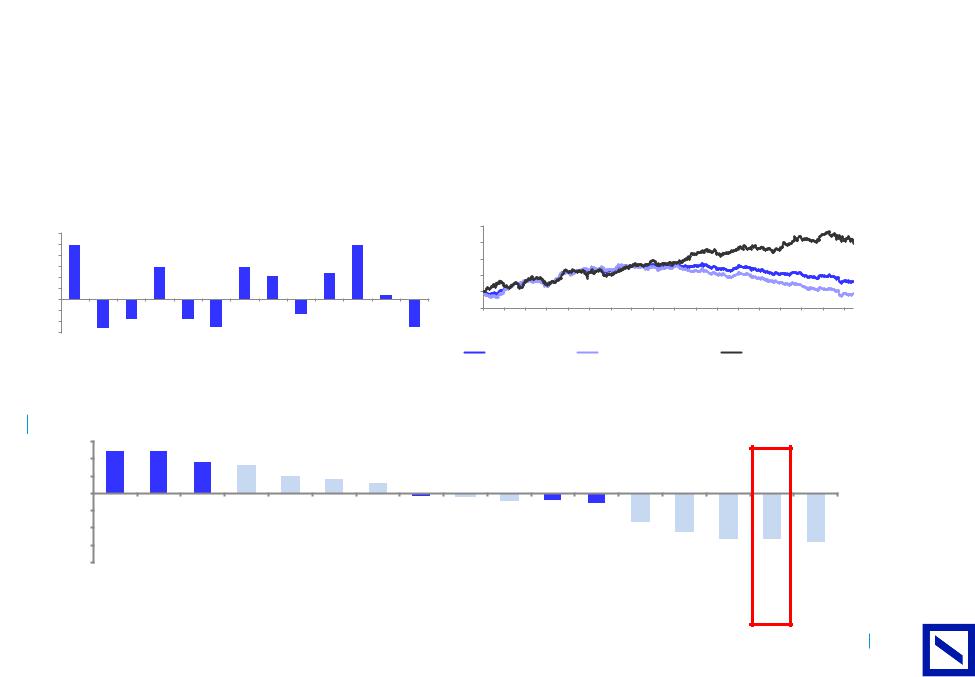
Figure 4: European sector performance relative to market YTD
15% |
12% |
12% |
9% |
|
|
|
|
|
|
|
|
|
|
|
|
|
|
|
|
8% |
|
|
|
|
|
|
|
|
|
|
|
|
|
||||
10% |
|
|
|
|
|
|
|
|
|
|
|
|
|
|
|
|||
|
|
|
|
|
|
|
|
|
|
|
|
|
|
|
|
|||
|
|
|
|
5% |
4% |
|
|
|
|
|
|
|
|
|
|
|
||
|
|
|
|
|
3% |
|
|
|
|
|
|
|
|
|
|
|||
5% |
|
|
|
|
|
|
|
|
|
|
|
|
|
|
|
|||
|
|
|
|
|
|
|
|
|
|
|
|
|
|
|
|
|||
|
|
|
|
|
|
|
|
|
|
|
|
|
|
|
|
|
||
0% |
|
|
|
|
|
|
|
|
|
|
|
|
|
|
|
|
|
|
-5% |
|
|
|
|
|
|
|
-1% |
-1% |
-2% |
-2% |
-3% |
|
|
|
|
|
|
|
|
|
|
|
|
|
|
|
|
|
|
|
|
|
||||
-10% |
|
|
|
|
|
|
|
|
|
|
|
|
|
|
|
|
||
|
|
|
|
|
|
|
|
|
|
|
|
-8% |
|
|
|
|
||
-15% |
|
|
|
|
|
|
|
|
|
|
|
|
|
|
|
|
||
|
|
|
|
|
|
|
|
|
|
|
|
|
-11% |
-13% |
-13% |
|
||
-20% |
|
|
|
|
|
|
|
|
|
|
|
|
|
|
-14% |
|||
|
|
|
|
|
|
|
|
|
|
|
|
|
|
|
|
|||
Pharma |
P&H goods |
Utilities |
Energy |
Cons dur |
Software |
Insurance |
Real estate |
Cap goods |
Chemicals |
Food & bev |
Telecoms |
Mining |
Airlines |
Autos |
Constr mat |
Banks |
||
|
Source: Deutsche Bank, Factset
7 Page
Building European |
2018 December 3 Materials Building |
Construction & |
|
vk.com/id446425943
8Page |
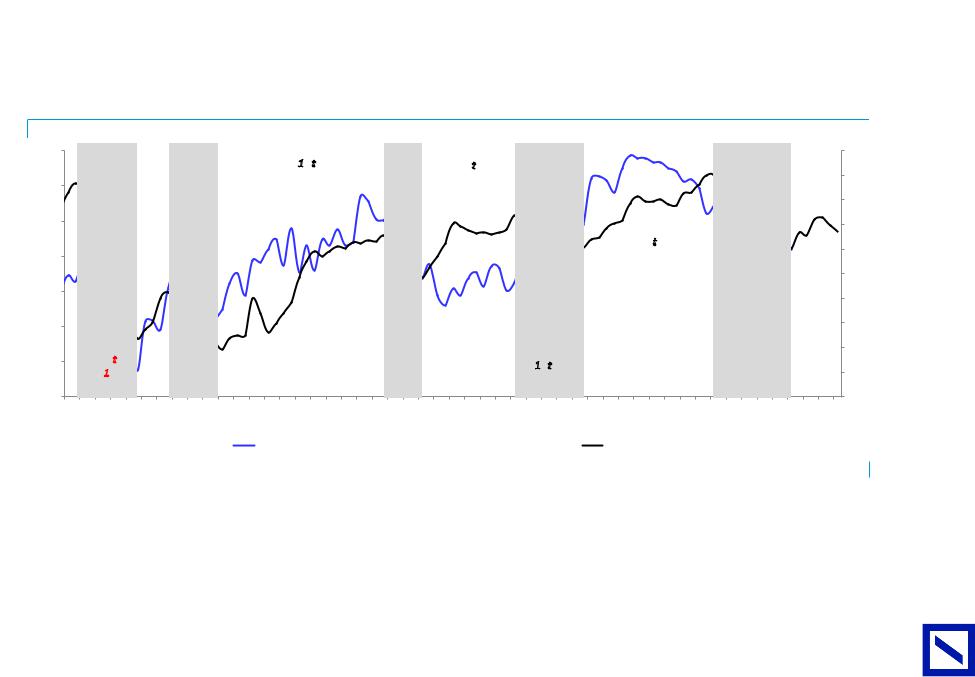
Sector performance has been historically well correlated to European PMI evolution |
|
|
|
|
|
|
||||||||
|
|
|
|
|
|
|
|||||||||
|
■ |
Since the peak of European PMI seen in Feb. 18, the sector has underperformed by c13% |
|
|
|
|
|
|
|
|
|||||
|
■ |
This is in the range of what we have observed in the past when European PMI has peaked. |
|
|
|
|
|
|
|
|
|||||
|
■ |
The only occurrence since 2011 where a negative momentum in European PMI did not result into a sector underperformance was in H1 16. This can |
|||||||||||||
|
|
however be explained by the low magnitude of the PMI decrease as well as by the discussions on US infra ahead of the elections. |
|
|
|
||||||||||
|
Figure 5: Sector performance has been historically correlated to European PMI evolution |
|
|
|
|
|
|
|
|
||||||
|
140 |
|
|
|
|
|
|
|
|
|
|
|
|
|
60 |
|
|
|
Nov 11 |
Sept 12 to June |
Nov 14 to Dec |
|
|
|
|
|
|
|
|
|
|
|
|
|
|
|
|
|
|
|
|
|
|
|
|||
|
|
|
14: +27% |
|
|
|
|
|
|
|
|
|
|
58 |
|
|
|
|
to Feb |
|
15: +2% |
|
|
|
|
|
|
|
|
||
|
130 |
|
|
|
|
|
|
|
|
|
|
|
|
||
|
|
|
|
|
|
|
|
|
|
|
|
|
|
||
|
|
12: |
|
|
|
|
|
|
|
|
|
|
|
|
|
|
|
|
|
|
|
|
|
|
|
|
|
|
|
56 |
|
|
|
|
+36% |
|
|
|
|
|
|
|
|
|
|
|
|
|
|
|
|
|
|
|
|
|
|
|
|
|
|
|
|
|
120 |
|
|
|
|
|
|
|
|
|
|
|
|
|
54 |
|
|
|
|
|
|
|
|
|
|
|
|
|
|
|
|
|
|
|
|
|
|
|
|
|
Aug 16 to Jan |
|
|
|
|
|
52 |
|
110 |
|
|
|
|
|
|
|
18: +8% |
|
|
|
|
|
|
|
|
|
|
|
|
|
|
|
|
|
|
|
|
||
|
|
|
|
|
|
|
|
|
|
|
|
|
|
|
50 |
|
100 |
|
|
|
|
|
|
|
|
|
|
|
|
|
48 |
|
|
|
|
|
|
|
|
|
|
|
|
|
|
|
|
|
90 |
|
|
|
|
|
|
|
|
|
|
|
|
|
46 |
|
|
|
|
|
|
|
|
|
|
|
|
|
|
|
|
|
|
|
|
|
|
|
|
|
|
|
|
|
|
|
44 |
|
80 |
Feb 11 to |
|
July to Nov 14: |
|
Dec 15 to Aug |
|
|
|
|
Feb to Nov 18: |
|
|
|
|
|
|
Oct 12: |
Feb to Sept |
|
|
|
|
|
|
|
42 |
||||
|
|
-14% |
|
|
16: +9% |
|
|
|
|
|
|
||||
|
|
-25% |
12: -12% |
|
|
|
|
|
|
-13% |
|
|
|
||
|
|
|
|
|
|
|
|
|
|
|
|
|
|||
|
70 |
Mar-11 May-11 Jul-11 Sep-11 |
Nov-11 Jan-12 Mar-12 May-12 Jul-12 Sep-12 |
Nov-12 Jan-13 Mar-13 May-13 Jul-13 Sep-13 Nov-13 Jan-14 Mar-14 May-14 Jul-14 Sep-14 Nov-14 |
|
Mar-15 May-15 Jul-15 Sep-15 |
Nov-15 Jan-16 Mar-16 May-16 Jul-16 |
|
Nov-16 Jan-17 Mar-17 May-17 Jul-17 |
|
|
Jan-18 Mar-18 May-18 Jul-18 Sep-18 Nov-18 |
|
|
40 |
|
Jan-11 |
Jan-15 |
Sep-16 |
Sep-17 |
Nov-17 |
Jan-19 |
Mar-19 |
May-19 |
|||||||
|
|
|
|
Sector performance vs. STOXX 600 |
|
|
|
|
European PMI |
|
|
|
|
|
|
Source: Deutsche Bank, Factset, Haver. DBe for PMI from Nov. 2018 till May 2019.
AG/London Bank Deutsche
Building European |
2018 December 3 Materials Building |
Construction & |
|
vk.com/id446425943
Deutsche |
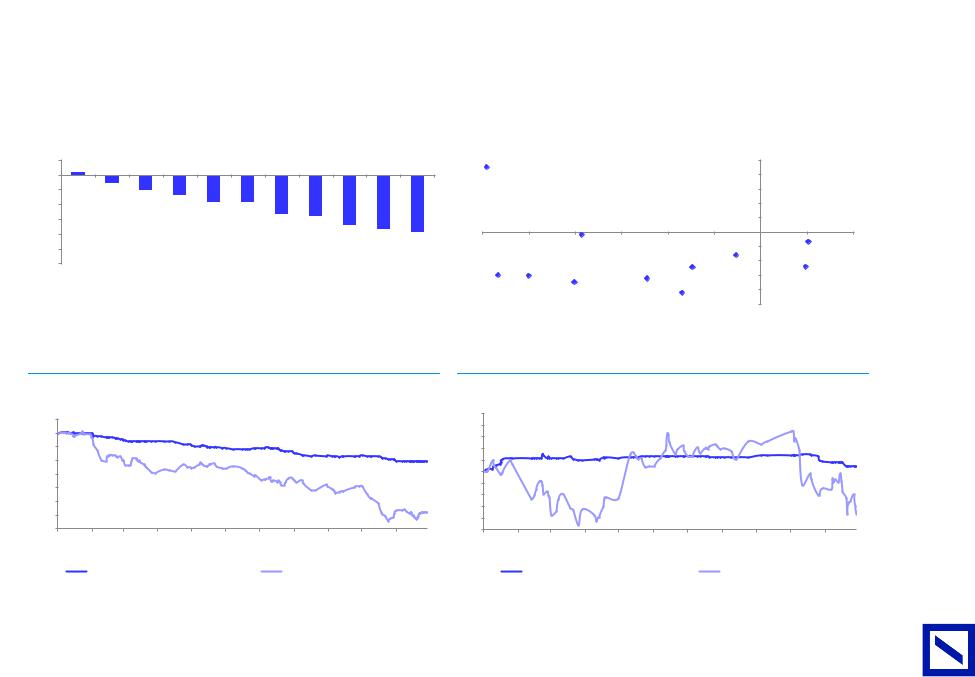
2018 - Another year of consensus downgrades |
|
|
|
|
|
|
|
|
|
|
|
|
|
|
|||||||||||
|
|
|
|
|
|
|
|
|
|
|
|
|
|
|
||||||||||||
Bank |
■ |
To the exception of Kingspan, all stocks are down YTD, driven by cuts in consensus EPS and / or PE derating |
|
|
|
|
|
|||||||||||||||||||
■ |
Once again, cyclical stocks have seen higher consensus downgrades vs. structural growth stocks (Kingspan, Geberit, Sika) - this mainly reflects a |
|||||||||||||||||||||||||
|
||||||||||||||||||||||||||
AG/London |
|
better pricing power and cost inflation management for the latter. |
|
|
|
|
|
|
|
|
|
|
|
|
|
|||||||||||
■ |
Saint Gobain YTD share price performance is however more attributable to the derating of the stock on negative macro indicators notably in France, |
|||||||||||||||||||||||||
|
||||||||||||||||||||||||||
|
|
rather than consensus downgrades. |
|
|
|
|
|
|
|
|
|
|
|
|
|
|
|
|
|
|
||||||
|
Figure 6: YTD share price performance by stock |
|
|
|
|
Figure 7: Consensus EPS vs. P/E evolution since the start of the year |
||||||||||||||||||||
|
10% |
2% |
|
|
|
|
|
|
|
|
|
|
|
|
|
|
|
|
|
|
|
|
25% |
|
|
|
|
|
|
|
|
|
|
|
|
|
|
|
|
|
|
|
|
|
|
|
|
|
|
|
|
||
|
0% |
|
|
|
|
|
|
|
|
|
|
|
|
|
Titan |
|
|
|
|
|
|
|
20% |
|
|
|
|
-10% |
|
-6% |
|
|
|
|
|
|
|
|
|
|
|
|
|
|
|
|
|
|
|
15% |
|
|
|
|
|
|
-10% |
|
|
|
|
|
|
|
|
|
|
|
|
|
|
|
|
|
|
|
|
|
||
|
-20% |
|
|
-14% |
|
|
|
|
|
|
|
|
|
|
|
|
|
|
|
|
|
10% |
|
|
||
|
|
|
|
-18% |
-19% |
|
|
|
|
|
|
|
|
|
|
|
|
|
|
|
|
|
||||
|
-30% |
|
|
|
|
|
|
|
|
|
downgrade |
|
|
|
|
|
|
|
|
|
5% |
|
|
|||
|
|
|
|
|
|
|
-26% |
-28% |
|
|
|
|
|
|
|
|
|
|
|
|
|
|
||||
|
|
|
|
|
|
|
|
|
|
|
|
|
|
|
|
|
|
|
|
|
|
|
|
|||
|
|
|
|
|
|
|
|
|
|
|
|
|
|
|
|
|
|
|
|
|
|
0% |
|
|
||
|
-40% |
|
|
|
|
|
|
|
|
-34% |
-36% |
|
|
|
|
|
|
|
|
|
|
|
|
|
||
|
|
|
|
|
|
|
|
|
-39% |
|
-30% |
-25% |
|
-20% |
-15% |
-10% |
|
-5% |
-5% 0% |
5% |
10% |
|||||
|
|
|
|
|
|
|
|
|
|
|
|
|
|
|||||||||||||
|
-50% |
|
|
|
|
|
|
|
|
|
|
|
|
|
||||||||||||
|
|
|
|
|
|
|
|
|
|
|
|
|
|
|
|
LafargeHolcim |
|
|
|
Geberit |
|
Kingspan |
||||
|
-60% |
|
|
|
|
|
|
|
|
|
|
|
EPS |
|
|
|
|
|
|
|
|
-10% |
|
|
||
|
|
|
|
|
|
|
|
|
|
|
|
|
Tarkett |
|
|
|
|
|
|
|
|
|
||||
|
Kingspan |
Sika |
Geberit |
Titan |
LafargeHolcim |
CRH |
Buzzi |
GobainSaint |
Heidelberg |
Cemex |
Tarkett |
|
|
|
|
|
|
|
|
|
|
|
||||
|
|
|
|
|
|
|
CRH |
Implied P/E evolution |
|
|
||||||||||||||||
|
|
|
|
|
|
|
|
|
|
|
|
|
|
|
|
|
|
|
Buzzi |
|
-15% |
Sika |
|
|||
|
|
|
|
|
|
|
|
|
|
|
|
|
|
|
|
Cemex |
|
|
|
|
|
|
|
|||
|
|
|
|
|
|
|
|
|
|
|
|
|
|
|
|
Heidelberg |
|
|
|
|
-20% |
|
|
|||
|
|
|
|
|
|
|
|
|
|
|
|
|
|
|
|
|
|
|
|
|
|
|
||||
|
|
|
|
|
|
|
|
|
|
|
|
|
|
|
|
|
|
|
|
|
|
|
|
|||
|
|
|
|
|
|
|
|
|
|
|
|
|
|
|
|
|
|
|
|
Saint Gobain |
-25% |
|
|
|||
|
|
|
|
|
|
|
|
|
|
|
|
|
|
|
|
|
|
|
|
|
|
|
|
|
||
|
Source: Deutsche Bank, Factset. Note: YTD as of 28 Nov closing price. |
|
|
|
|
|
Source: Deutsche Bank. Bloomberg Finance LP, Factset. Consensus and P/E as of 28 Nov. |
|
|
|
||||||||||||||||
|
Figure 8: EBITDA consensus evolution vs. share price evolution - |
|
Figure 9: EBITDA consensus evolution vs. share price evolution - |
|
||||||||||||||||||||||
|
Cyclical stocks |
|
|
|
|
|
|
|
|
|
Structural stocks |
|
|
|
|
|
|
|
|
|||||||
|
105 |
|
|
|
|
|
|
|
|
|
|
|
110 |
|
|
|
|
|
|
|
|
|
|
|
||
|
|
|
|
|
|
|
|
|
|
|
|
108 |
|
|
|
|
|
|
|
|
|
|
|
|||
|
100 |
|
|
|
|
|
|
|
|
|
|
|
|
|
|
|
|
|
|
|
|
|
|
|||
|
|
|
|
|
|
|
|
|
|
|
|
106 |
|
|
|
|
|
|
|
|
|
|
|
|||
|
|
|
|
|
|
|
|
|
|
|
|
|
|
|
|
|
|
|
|
|
|
|
|
|||
|
95 |
|
|
|
|
|
|
|
|
|
|
90 |
104 |
|
|
|
|
|
|
|
|
|
|
|
||
|
90 |
|
|
|
|
|
|
|
|
|
|
102 |
|
|
|
|
|
|
|
|
|
|
101 |
|||
|
|
|
|
|
|
|
|
|
|
|
|
|
|
|
|
|
|
|
|
|
|
|||||
|
|
|
|
|
|
|
|
|
|
|
|
|
|
|
|
|
|
|
|
|
|
|
||||
|
85 |
|
|
|
|
|
|
|
|
|
|
|
100 |
|
|
|
|
|
|
|
|
|
|
|
||
|
|
|
|
|
|
|
|
|
|
|
|
|
|
|
|
|
|
|
|
|
|
|
|
|
||
|
80 |
|
|
|
|
|
|
|
|
|
|
|
98 |
|
|
|
|
|
|
|
|
|
|
|
||
|
|
|
|
|
|
|
|
|
|
|
|
96 |
|
|
|
|
|
|
|
|
|
|
|
|||
|
75 |
|
|
|
|
|
|
|
|
|
|
|
|
|
|
|
|
|
|
|
|
|
|
|||
|
|
|
|
|
|
|
|
|
|
|
71 |
94 |
|
|
|
|
|
|
|
|
|
|
|
|||
|
|
|
|
|
|
|
|
|
|
|
|
|
|
|
|
|
|
|
|
|
|
|
||||
|
70 |
|
|
|
|
|
|
|
|
|
|
|
92 |
|
|
|
|
|
|
|
|
|
|
93 |
||
|
|
|
|
|
|
|
|
|
|
|
|
|
|
|
|
|
|
|
|
|
|
|
||||
|
65 |
|
|
|
|
|
|
|
|
|
|
|
|
|
|
|
|
|
|
|
|
|
|
|
||
|
Feb-18 |
Mar-18 |
Apr-18 |
May-18 |
|
Jul-18 |
Aug-18 |
Sep-18 |
Oct-18 |
|
Nov-18 |
90 |
|
|
|
|
|
|
|
|
|
|
|
|||
|
Jan-18 |
Jun-18 |
|
|
|
Jan-18 |
Feb-18 |
Mar-18 |
Apr-18 |
May-18 |
Jun-18 |
Jul-18 |
Aug-18 |
Sep-18 |
Oct-18 |
Nov-18 |
||||||||||
|
|
Average FY 18E EBITDA consensus |
|
Average share price evolution |
|
|
|
|
Average FY 18E EBITDA consensus |
|
Average share price evolution |
|||||||||||||||
|
Source: Deutsche Bank. Bloomberg Finance LP. Note: Rebased to 100 on 1 Jan 2018. Data labels for 28 Nov closing. |
|
Source: Deutsche Bank. Bloomberg Finance LP. Note: Rebased to 100 on 1 Jan 2018. Data labels for 28 Nov closing. |
|
||||||||||||||||||||||
9 Page |
|
|
|
|
|
|
|
|
|
|
|
|
|
|
|
|
|
|
|
|
|
|
|
|
|
|
Building European |
2018 December 3 Materials Building |
Construction & |
|

vk.com/id446425943
Page |
Prefer renovation in DM and select EM |
10 |
|
■In general, growth has peaked in 2017-18 on our companies' footprints as GDP growth is expected to moderate in 2019, driven by a slowdown in the US and Western Europe.
■With new residential indicators clearly weakening in DM (building permits in Europe, housing a ordability in the US), we have a preference for the more late-cycle and more resilient renovation segment. This is key for Saint Gobain (c65% of W. Europe exposure is renovation) but also Sika (c80% renovation in DM).
■We are conversely more cautious on Kingspan, which has the highest exposure to the more cyclical newbuild activities. Our analysis also suggests that housing a ordability in the US is more a structural than a temporary issue (negative for Titan and CRH).
■Finally, after a six years negative Supply / Demand cycle in Emerging Markets, we believe capacity utilization improvement and margins could finally improve in 2019E: demand should benefit with a lag from the commodities prices increases seen since H2 16 while supply has started to moderate reflecing more normalized prices / margins in most EM.
Figure 10: GDP growth evolution based on companies' footprint
|
Buzzi |
Cemex |
CRH |
Geberit |
Heidelberg |
Kingspan |
LafargeHolcim |
Saint Gobain |
Sika |
Tarkett |
Titan |
2016 |
1.6% |
2.5% |
1.8% |
2.2% |
2.4% |
1.9% |
3.1% |
1.9% |
2.3% |
1.3% |
1.9% |
2017 |
2.3% |
2.5% |
2.4% |
2.5% |
2.9% |
2.1% |
3.4% |
2.6% |
2.8% |
2.3% |
2.4% |
2018E |
2.3% |
2.7% |
2.5% |
2.4% |
3.0% |
2.2% |
3.4% |
2.4% |
2.8% |
2.4% |
3.1% |
2019E |
2.1% |
2.7% |
2.2% |
2.1% |
2.8% |
2.0% |
3.4% |
2.3% |
2.6% |
2.2% |
2.9% |
|
|
|
|
|
|
|
|
|
|
|
|
Source: Deutsche Bank estimates, IMF, Company data
AG/London Bank Deutsche
Building European |
2018 December 3 Materials Building |
Construction & |
|