

DB European Building Construction 2019 Outlook_watermark
.pdfvk.com/id4464259433 December 2018
Building Materials
European Building & Construction
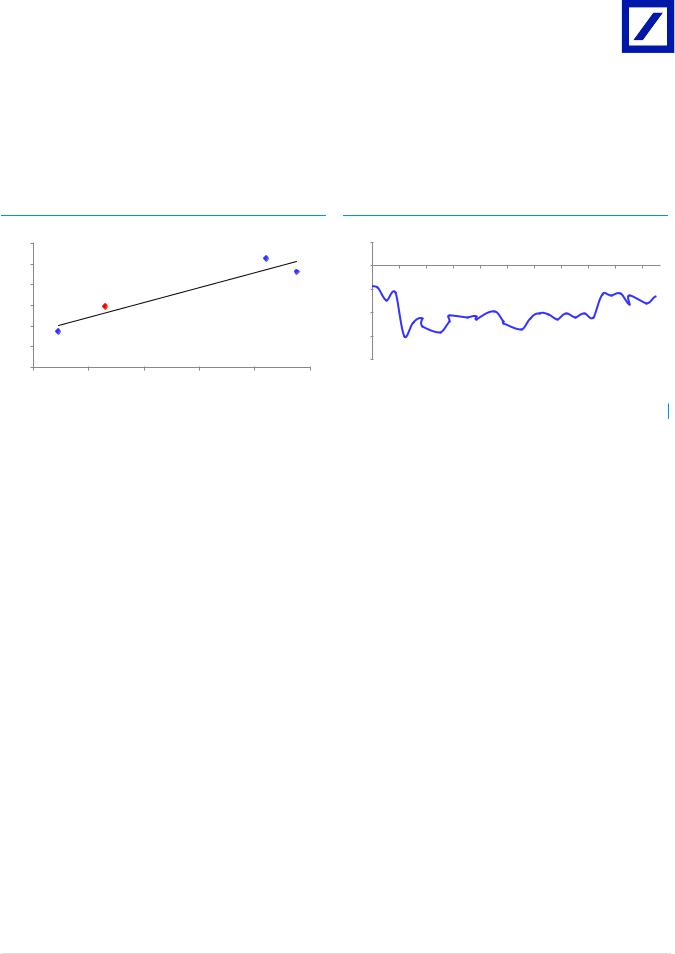
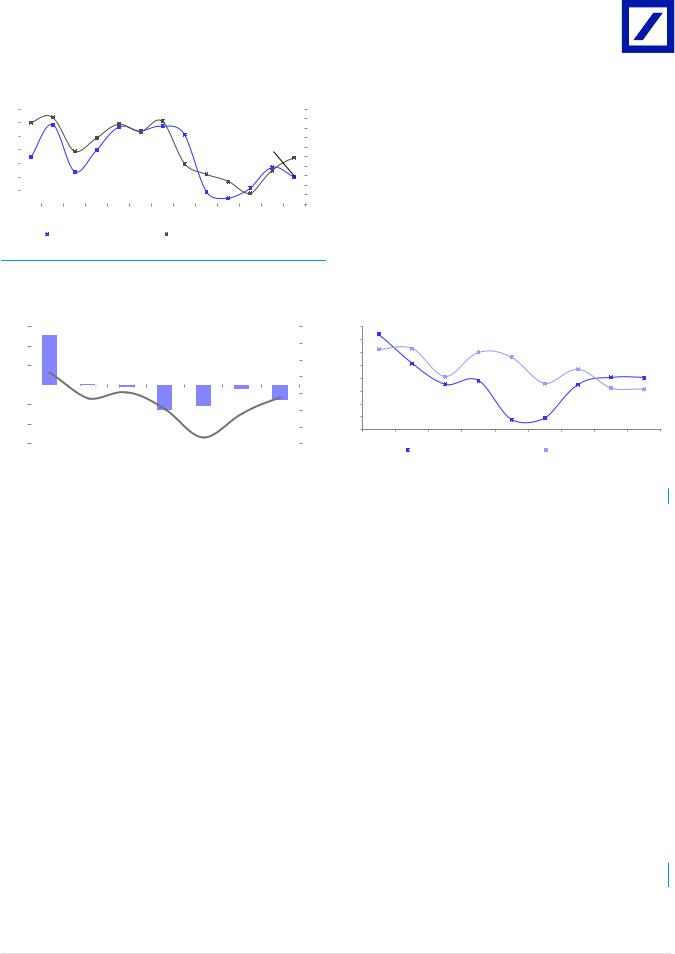
We remain confident on Kingspan ability to grow above construction markets Our 10y analysis based on Kingspan performance by market suggests that the
company has outperformed the construction markets by c3-4% on average over the cycle: c2.5% in high penetration rates markets (UK, half of Europe) and c6-7% in low penetration rates markets (Americas, other half of Europe). With new acquisitions shifting Kingspan portfolio more and more towards low penetration geographies (Americas, South Europe) we believe Kingpsan is in a good position to continue to outperform its underlying markets over the next years.
Figure 121: Kingspan overperformance vs. underlying markets
30% |
|
|
|
|
|
|
25% |
|
|
|
|
|
|
20% |
|
|
|
|
|
|
15% |
|
|
|
|
|
|
10% |
|
|
|
|
|
|
5% |
|
|
|
|
|
|
0% |
|
|
|
|
|
|
-5% |
|
|
|
|
|
|
-10% |
|
|
|
|
|
|
-15% |
|
|
|
|
|
|
-20% |
|
|
|
|
|
|
-25% |
2012 |
2013 |
|
2015 |
2016 |
|
2011 |
2014 |
2017 |
||||
|
UK |
|
US |
|
Western Europe |
|
Source: Duetsche Bank, Company data, Euroconstruct
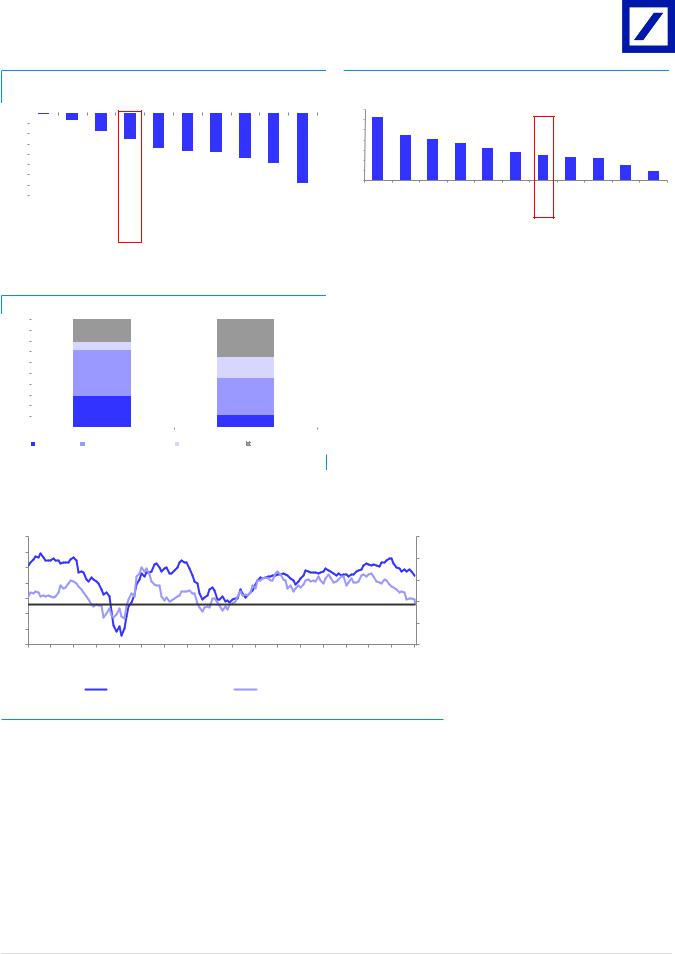
High exposure to new-build construction is however a key risk
Within the stocks under our coverage, Kingspan has the highest exposure to new-build activity (around 70%). We believe this is a key di erence vs. Kingspan construction peers which are much more leveraged towards renovation (just 28% for Geberit and 9% for Sika). The highest exposure to new-build construction has translated into more volatility across the cycle, with a more negative impact during the downturn vs. peer group’s stocks. At a time where more investors have a cautious view on the longevity of the Europe / US construction cycles, this is in our view a key risk on the stock.
Figure 122: Kingspan exposed the most to newbuild activities in DM
70% |
62% |
|
|
|
|
|
|
|
|
|
|
|
60% |
|
|
|
|
|
|
|
|
|
|
|
|
50% |
|
44% |
41% |
|
|
|
|
|
|
|
|
|
|
|
|
37% |
|
|
|
|
|
|
|
||
40% |
|
|
|
31% |
|
|
|
|
|
|
||
|
|
|
|
28% |
|
|
|
|
|
|||
|
|
|
|
|
|
|
|
|
|
|||
30% |
|
|
|
|
|
25% |
23% |
|
|
|
||
|
|
|
|
|
|
22% |
|
|
||||
|
|
|
|
|
|
|
|
|
||||
20% |
|
|
|
|
|
|
|
|
|
15% |
|
|
|
|
|
|
|
|
|
|
|
|
|
9% |
|
10% |
|
|
|
|
|
|
|
|
|
|
|
|
0% |
|
|
|
|
|
|
|
|
|
|
|
|
Kingspan |
CRH |
Buzzi |
Titan |
Heidelberg |
Geberit |
Saint Gobain |
Cemex |
LafargeHolcim |
Tarkett |
Sika |
||
|
Source: Deutsche Bank estimates, Company data
Figure 123: … Resulting in a dip in organic growth during the time of recession (2007 - 2009)
0% |
|
|
|
|
|
|
|
|
|
|
|
-5% |
|
-1% |
-4% |
|
|
|
|
|
|
|
|
-10% |
|
|
|
|
|
|
|
|
|
|
|
|
|
|
-9% |
|
|
|
|
|
|
|
|
-15% |
|
|
|
|
|
|
|
|
|
|
|
|
|
|
|
-13% |
|
|
|
|
|
|
|
|
|
|
|
|
|
|
|
|
|
|
|
-20% |
|
|
|
|
|
-17% |
-19% |
-19% |
|
|
|
-25% |
|
|
|
|
|
|
-22% |
|
|
||
|
|
|
|
|
|
|
|
-24% |
|
||
-30% |
|
|
|
|
|
|
|
|
|
|
|
|
|
|
|
|
|
|
|
|
|
|
|
-35% |
|
|
|
|
|
|
|
|
|
|
|
-40% |
|
|
|
|
|
|
|
|
|
|
-34% |
|
Sika |
Geberit |
LafargeHolcim |
Saint Gobain |
Heidelberg |
Cemex |
Titan |
Buzzi |
CRH |
Kingspan |
|
|
|
Source: Deutsche Bank estimates, Company data
Deutsche Bank AG/London |
Page 61 |
vk.com/id446425943
3 December 2018
Building Materials
European Building & Construction
Valuation discount vs. peer's group has faded in 2018 and is back to pre Brexit level
Our analysis suggests that for the first time since Brexit and after recent overperformance, Kingspan P/E is now in line with peer’s group. This leaves in our view the stock vulnerable to any UK market negative comment at a time where most peers highlight that the high level of uncertainty for UK construction. In addition, our EV/IC vs. ROCE analysis vs. peer’s group also suggests that the stock is now fairly priced.
Figure 124: Kingspan - Growth prices in
|
6 |
|
|
|
Geberit |
|
|
|
|
|
|
|
|
|
5 |
|
|
|
|
|
EV/IC |
4 |
|
|
|
Sika |
|
|
|
Kingspan |
|
|
|
|
3 |
|
|
|
|
|
|
2019E |
|
|
|
|
|
|
2 |
|
|
|
|
|
|
|
1 |
Polypipe |
|
|
|
|
|
|
|
|
|
|
|
|
0 |
|
|
|
|
|
|
15% |
17% |
19% |
21% |
23% |
25% |
2019E ROCE
Source: Deutsche Bank estimates, Company data. Note: EV calculated based on 28 Nov closing.
Figure 125: Kingspan - Trading at the pre-Brexit level
10%
0% |
|
|
|
|
|
|
|
|
|
|
-10% |
|
|
|
|
|
|
|
|
|
|
-20% |
|
|
|
|
|
|
|
|
|
|
-30% |
|
|
|
|
|
|
|
|
|
|
-40% |
|
|
|
|
|
|
|
|
|
|
Apr-16 |
Jul-16 |
Oct-16 |
Jan-17 |
Apr-17 |
Jul-17 |
Oct-17 |
Jan-18 |
Apr-18 |
Jul-18 |
Oct-18 |
Source: Deutsche Bank, Factset
Forecasts and ratios |
|
|
|
|
|
Year End Dec 31 |
2016A |
2017A |
2018E |
2019E |
2020E |
Revenue (EURm) |
3,108 |
3,668 |
4,413 |
4,775 |
4,979 |
EBITDA (EURm) |
341 |
378 |
443 |
496 |
535 |
EBITA (EURm) |
328 |
362 |
427 |
479 |
517 |
PBT DB (EURm) |
314 |
346 |
407 |
459 |
497 |
PBT stated (EURm) |
314 |
346 |
407 |
459 |
497 |
DB EPS (EUR) |
1.42 |
1.57 |
1.82 |
2.06 |
2.23 |
OLD DB EPS (EUR) |
1.42 |
1.57 |
1.77 |
1.99 |
2.10 |
% Change |
0.0% |
0.0% |
3.1% |
3.5% |
6.0% |
DB EPS growth (%) |
34.9 |
10.8 |
16.0 |
13.0 |
8.4 |
P/E (DB EPS) (x) |
16.3 |
20.0 |
20.7 |
18.3 |
16.9 |
DB EV/ DB EBITDA (x) |
13.5 |
16.2 |
17.1 |
14.8 |
13.2 |
EV/EBITA (x) |
14.0 |
16.9 |
17.8 |
15.4 |
13.7 |
DPS (EUR) |
0.34 |
0.37 |
0.43 |
0.48 |
0.52 |
Yield (%) |
1.4 |
1.2 |
1.1 |
1.3 |
1.4 |
Source: Deutsche Bank estimates, company data |
|
|
|
|
|
Page 62 |
Deutsche Bank AG/London |
vk.com/id4464259433 December 2018
Building Materials
European Building & Construction
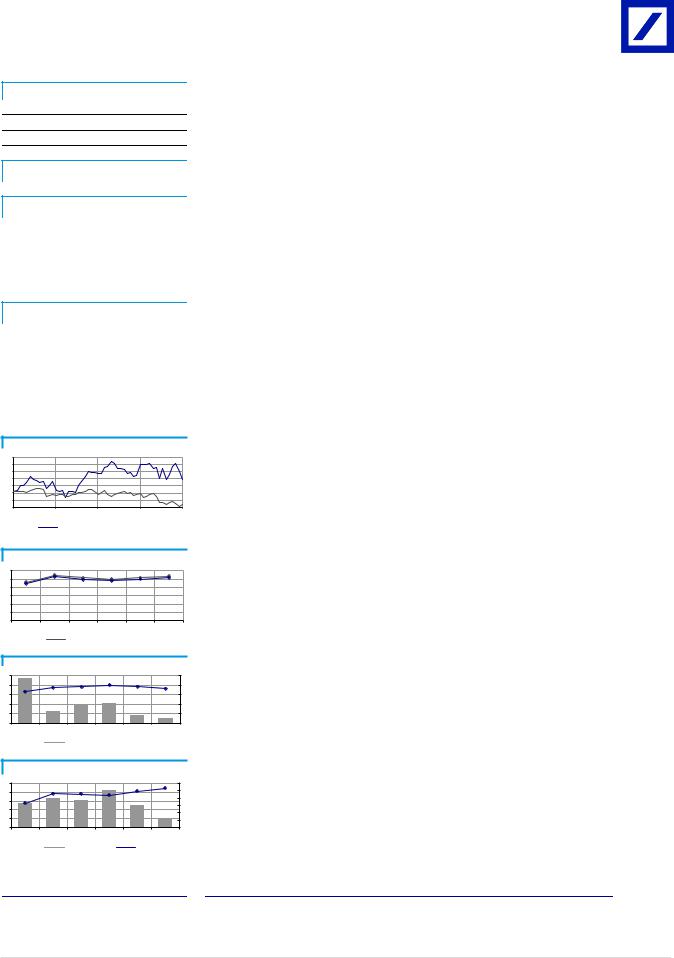
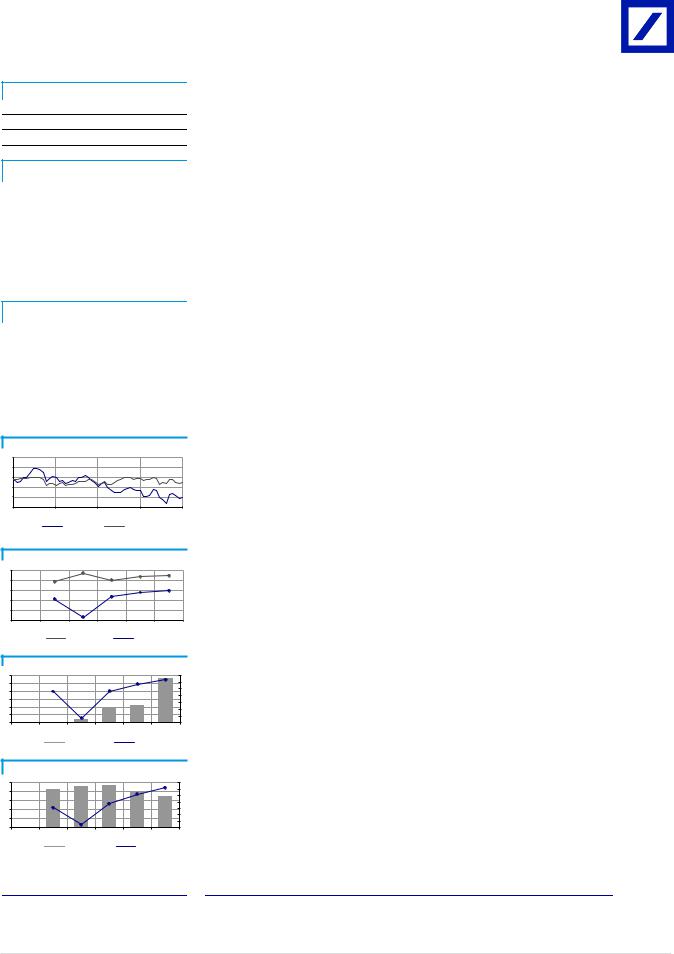
Model updated: 29 November 2018
Running the Numbers
Europe
Ireland
Building Materials
Kingspan
Reuters: KSP.I Bloomberg: KSP ID
Hold
Price (29 Nov 18) |
|
€ 37.70 |
|
|
|
Target price |
|
€ 45.00 |
|
|
|
52-week Range |
€ 32.60 |
– 43.60 |
|
|
|
Market Cap |
€ 6,743m |
|
|
US$ |
7,608m |
|
|
|
Company Profile
Kingspan is an insulation manufacturer with particular focus on panels, and so offers leverage to energy efficiency conversion. It operates globally but has a skew to developed markets where insulation tends to be outdated and more inefficient. Kingspan serves all types of end-use property with 70% of sales coming from new-build construction.
1yr Price Performance
44 |
|
|
|
42 |
|
|
|
40 |
|
|
|
38 |
|
|
|
36 |
|
|
|
34 |
|
|
|
32 |
|
|
|
30 |
|
|
|
Nov-17 |
Feb-18 |
May-18 |
Aug-18 |
KSP.I |
|
EURO STOXX PRICE (Rebased) |
Margin Trends
12 |
|
|
|
|
|
10 |
|
|
|
|
|
8 |
|
|
|
|
|
6 |
|
|
|
|
|
4 |
|
|
|
|
|
2 |
|
|
|
|
|
0 |
|
|
|
|
|
15 |
16 |
17 |
18E |
19E |
20E |
EBITDA Margin |
|
EBIT Margin |
Growth & Profitability
50 |
|
|
|
|
25 |
40 |
|
|
|
|
20 |
30 |
|
|
|
|
15 |
20 |
|
|
|
|
10 |
10 |
|
|
|
|
5 |
0 |
|
|
|
|
0 |
15 |
16 |
17 |
18E |
19E |
20E |
Sales growth (LHS) |
|
ROE (RHS) |
Solvency |
|
|
|
|
|
50 |
|
|
|
|
30 |
40 |
|
|
|
|
25 |
30 |
|
|
|
|
20 |
|
|
|
|
15 |
|
20 |
|
|
|
|
|
|
|
|
|
10 |
|
|
|
|
|
|
|
10 |
|
|
|
|
5 |
0 |
|
|
|
|
0 |
15 |
16 |
17 |
18E |
19E |
20E |
Net debt/equity (LHS) Net interest cover (RHS)
Xavier Marchand
+44(207)545-1400 xavier.marchand@db.com
Fiscal year end 31-Dec |
2015 |
2016 |
2017 |
2018E |
2019E |
2020E |
|
|
|
|
|
|
|
Financial Summary |
|
|
|
|
|
|
DB EPS (€) |
1.05 |
1.42 |
1.57 |
1.82 |
2.06 |
2.23 |
Reported EPS (€) |
1.05 |
1.42 |
1.57 |
1.82 |
2.06 |
2.23 |
DPS (€) |
0.07 |
0.34 |
0.37 |
0.43 |
0.48 |
0.52 |
BVPS (€) |
7.28 |
8.19 |
8.54 |
10.00 |
11.61 |
13.37 |
Weighted average shares (m) |
176 |
178 |
179 |
179 |
179 |
179 |
Average market cap (€m) |
3,591 |
4,113 |
5,615 |
6,743 |
6,743 |
6,743 |
Enterprise value (€m) |
3,977 |
4,591 |
6,119 |
7,585 |
7,358 |
7,053 |
|
|
|
|
|
|
|
Valuation Metrics |
|
|
|
|
|
|
P/E (DB) (x) |
19.4 |
16.3 |
20.0 |
20.7 |
18.3 |
16.9 |
P/E (Reported) (x) |
19.4 |
16.3 |
20.0 |
20.7 |
18.3 |
16.9 |
P/BV (x) |
3.34 |
3.15 |
4.26 |
3.77 |
3.25 |
2.82 |
FCF Yield (%) |
5.7 |
5.7 |
5.0 |
4.6 |
5.4 |
6.3 |
Dividend Yield (%) |
0.4 |
1.4 |
1.2 |
1.1 |
1.3 |
1.4 |
EV/Sales (x) |
1.43 |
1.48 |
1.67 |
1.72 |
1.54 |
1.42 |
EV/EBITDA (x) |
15.5 |
13.5 |
16.2 |
17.1 |
14.8 |
13.2 |
EV/EBIT (x) |
16.1 |
14.0 |
16.9 |
17.8 |
15.4 |
13.7 |
|
|
|
|
|
|
|
Income Statement (€m) |
|
|
|
|
|
|
Sales revenue |
2,774 |
3,109 |
3,668 |
4,413 |
4,775 |
4,979 |
Gross profit |
807 |
940 |
1,053 |
1,266 |
1,370 |
1,429 |
EBITDA |
256 |
341 |
378 |
443 |
496 |
535 |
Depreciation |
61 |
63 |
64 |
70 |
76 |
79 |
Amortisation |
9 |
13 |
16 |
16 |
17 |
18 |
EBIT |
247 |
328 |
362 |
427 |
479 |
517 |
Net interest income(expense) |
-15 |
-14 |
-16 |
-20 |
-20 |
-20 |
Associates/affiliates |
0 |
0 |
0 |
0 |
0 |
0 |
Exceptionals/extraordinaries |
0 |
0 |
0 |
0 |
0 |
0 |
Other pre-tax income/(expense) |
0 |
0 |
0 |
0 |
0 |
0 |
Profit before tax |
232 |
314 |
346 |
407 |
459 |
497 |
Income tax expense |
41 |
59 |
61 |
71 |
80 |
87 |
Minorities |
3 |
0 |
2 |
7 |
7 |
7 |
Other post-tax income/(expense) |
0 |
0 |
0 |
0 |
0 |
0 |
Net profit |
188 |
255 |
284 |
329 |
372 |
403 |
DB adjustments (including dilution) |
0 |
0 |
0 |
0 |
0 |
0 |
DB Net profit |
188 |
255 |
284 |
329 |
372 |
403 |
|
|
|
|
|
|
|
Cash Flow (€m) |
|
|
|
|
|
|
Cash flow from operations |
273 |
340 |
363 |
422 |
472 |
507 |
Net Capex |
-70 |
-103 |
-80 |
-110 |
-110 |
-80 |
Free cash flow |
204 |
237 |
283 |
312 |
362 |
427 |
Equity raised/(bought back) |
9 |
2 |
-1 |
0 |
0 |
0 |
Dividends paid |
-32 |
-48 |
-62 |
-68 |
-84 |
-89 |
Net inc/(dec) in borrowings |
0 |
0 |
0 |
0 |
0 |
0 |
Other investing/financing cash flows |
-439 |
-254 |
-174 |
-504 |
-30 |
0 |
Net cash flow |
-258 |
-64 |
47 |
-260 |
248 |
338 |
Change in working capital |
38 |
-53 |
-85 |
-19 |
-20 |
-32 |
|
|
|
|
|
|
|
Balance Sheet (€m) |
|
|
|
|
|
|
Cash and other liquid assets |
212 |
222 |
177 |
37 |
265 |
571 |
Tangible fixed assets |
619 |
666 |
703 |
844 |
884 |
885 |
Goodwill/intangible assets |
821 |
990 |
1,096 |
1,483 |
1,490 |
1,472 |
Associates/investments |
0 |
0 |
0 |
0 |
0 |
0 |
Other assets |
897 |
1,127 |
1,260 |
1,271 |
1,283 |
1,303 |
Total assets |
2,549 |
3,005 |
3,236 |
3,636 |
3,923 |
4,231 |
Interest bearing debt |
570 |
698 |
663 |
802 |
802 |
802 |
Other liabilities |
686 |
835 |
1,005 |
997 |
989 |
977 |
Total liabilities |
1,255 |
1,533 |
1,668 |
1,800 |
1,792 |
1,779 |
Shareholders' equity |
1,282 |
1,455 |
1,528 |
1,789 |
2,077 |
2,391 |
Minorities |
11 |
17 |
40 |
47 |
54 |
61 |
Total shareholders' equity |
1,294 |
1,472 |
1,568 |
1,836 |
2,131 |
2,452 |
Net debt |
358 |
476 |
486 |
765 |
537 |
231 |
|
|
|
|
|
|
|
Key Company Metrics |
|
|
|
|
|
|
Sales growth (%) |
46.7 |
12.0 |
18.0 |
20.3 |
8.2 |
4.3 |
DB EPS growth (%) |
71.1 |
34.9 |
10.8 |
16.0 |
13.0 |
8.4 |
EBITDA Margin (%) |
9.2 |
11.0 |
10.3 |
10.0 |
10.4 |
10.7 |
EBIT Margin (%) |
8.9 |
10.6 |
9.9 |
9.7 |
10.0 |
10.4 |
Payout ratio (%) |
6.7 |
23.3 |
23.3 |
23.3 |
23.3 |
23.3 |
ROE (%) |
16.5 |
18.7 |
19.0 |
19.8 |
19.2 |
18.0 |
Capex/sales (%) |
2.9 |
3.6 |
2.4 |
2.7 |
2.5 |
1.8 |
Capex/depreciation (x) |
1.1 |
1.5 |
1.1 |
1.4 |
1.3 |
0.9 |
Net debt/equity (%) |
27.6 |
32.4 |
31.0 |
41.7 |
25.2 |
9.4 |
Net interest cover (x) |
16.7 |
23.0 |
22.8 |
21.9 |
24.5 |
26.5 |
Source: Company data, Deutsche Bank estimates
Deutsche Bank AG/London |
Page 63 |
vk.com/id446425943
3 December 2018
Building Materials
European Building & Construction
Rating |
|
Company |
|
|
Research Analyst |
|
|
|
|
|
|
||||
Buy |
|
LafargeHolcim |
|
|
|||
|
|
|
|
|
Xavier Marchand |
|
|
|
|
|
|
+44-20-754-51400 |
|
||
Europe |
|
|
|
|
xavier.marchand@db.com |
|
|
Switzerland |
|
|
|
|
|
|
|
Building & Construction |
|
|
|
|
Price at 28 Nov 2018 (CHF) |
44.82 |
|
|
Reuters |
Bloomberg |
|
|
|
|
|
|
|
Price Target (CHF) |
54.00 |
||||
Building Materials |
|
|
|
|
|||
|
LHN.S |
LHN SW |
|
|
|
|
|
|
|
52-week range (CHF) |
59.70 - 41.14 |
||||
|
|
|
|||||
|
|
|
|
|
|
|
|
|
|
|
|
|
|
|
|
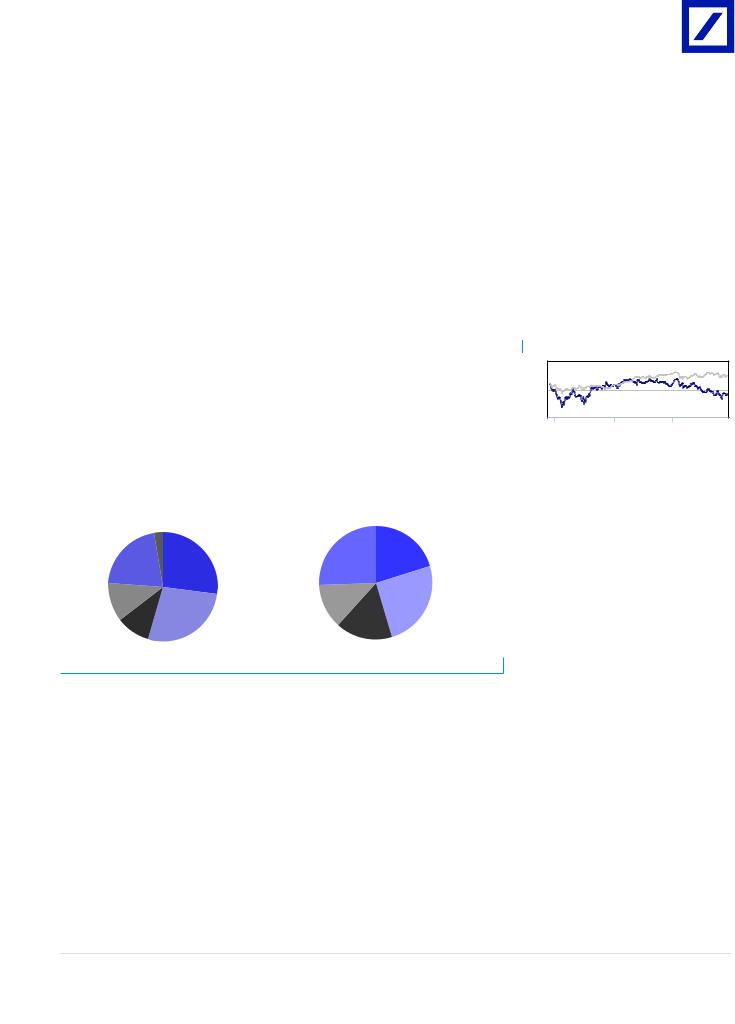
LafargeHolcim (Upgrade to BUY)
EM improvement drives upside to consensus
While EM exposure has long been a worry for investors, our bottom-up analysis shows now more upside than downside potential on LafargeHolcim EM portfolio. For the first time since 2012, we forecast a capacity utilization improvement in EM driven by a better demand growth (helped with a lag by higher commodities prices) and the moderation of new supply (due to more normalized prices / margins conditions in EM). Reflecting this, we have factored a modest +3% lfl EBITDA improvement in EM in 2019 – however this combined with DM improvement and the benefit of the costs savings (CHF250m assumed, i.e. c4% of FY 19E EBITDA assumed) is enough to bring our FY 19E EBITDA forecasts >2.5% above consensus. With easy comps for the next three sets of results, we see potential for earnings upgrade. Trading at 11.8x 2019E P/E, 4.5% dividend yield and 7% FCF yield, we believe there is value in the stock. Upgrade to BUY.
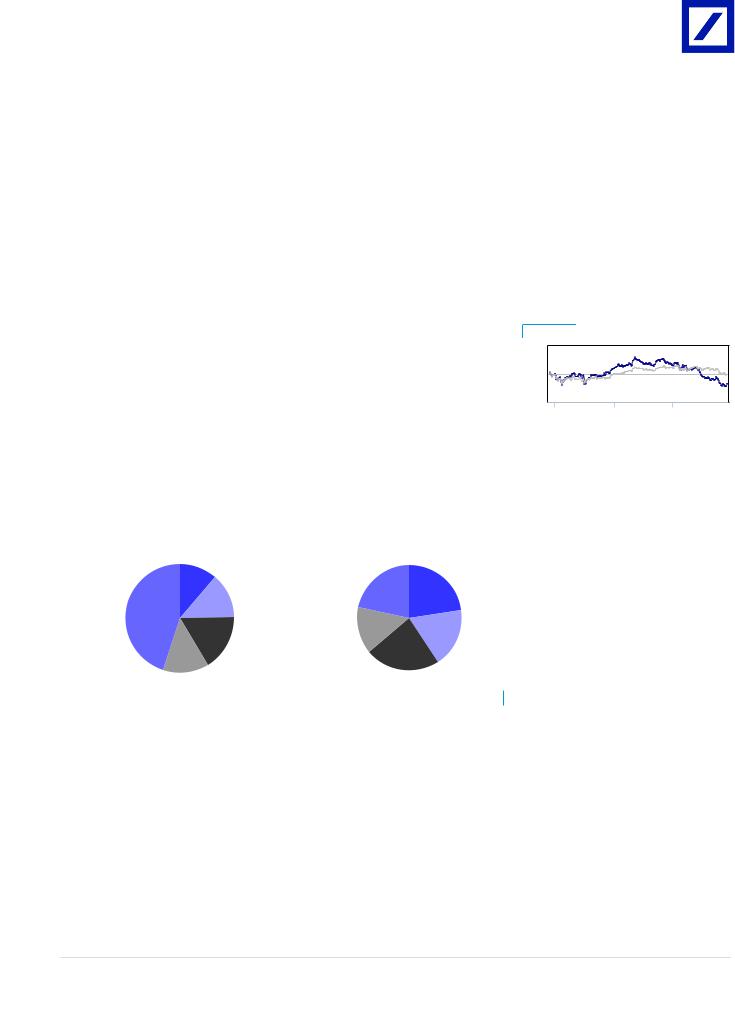
LafargeHolcim at a glance
Figure 126: 2018E Sales and EBITDA* by geography
North |
Corp |
|
North |
|
|
3% |
Asia |
Asia |
|||
America |
America |
||||
|
|||||
|
Pacific |
Pacific |
|||
22% |
|
26% |
|||
|
27% |
20% |
|||
|
|
|
|||
Mid-East |
|
|
Mid-East |
|
|
|
|
Africa |
|
||
Africa |
|
|
|
||
|
|
13% |
|
||
11% |
|
|
|
||
|
|
|
|
||
Latin |
|
Europe |
Latin |
Europe |
|
America |
|
27% |
America |
25% |
|
10% |
|
|
16% |
|
Source: Deutsche Bank, Company data. Note: *Total not equal to 100% due to Group / Corp activities.
Key changes |
|
|
TP |
48.00 to 54.00 ↑ |
12.5% |
Rating |
Hold to Buy ↑ |
|
Source: Deutsche Bank |
|
|
Price/price relative
75 |
|
|
50 |
|
|
25 |
|
|
2016 |
2017 |
2018 |
|
|
LafargeHolcim |
|
SPI Swiss Performance IX (Rebased) |
||
|
|
|
||||
Performance |
1m |
3m |
12m |
|||
(%) |
|
|
|
|
|
|
Absolute |
3.9 |
-7.6 |
-17.2 |
|||
SPI Swiss |
1.9 |
-4.0 |
-2.6 |
|||
Performance |
|
|
|
|||
IX |
|
|
|
|||
Source: Deutsche Bank |
|
|
|
|||
|
|
|
|
|||
Key indicators (FY1) |
|
|
|
|||
ROE (%) |
|
|
5.3 |
|||
Net debt/equity (%) |
|
|
47.1 |
|||
Book value/share (CHF) |
|
46.3 |
||||
Price/book (x) |
|
|
1.0 |
|||
Net interest cover (x) |
|
3.7 |
||||
EBIT margin (%) |
|
|
11.9 |
|||
Source: Deutsche Bank |
|
|
|
|||
|
|
|
||||
Stock & option liquidity data |
|
|
||||
Market cap (CHF)(m) |
|
26,767.0 |
||||
Shares outstanding (m) |
|
597 |
||||
Free float (%) |
|
|
– |
|||
Option volume (und. shrs., 1M avg.) |
– |
|||||
Source: Deutsche Bank |
|
|
|
|||
Page 64 |
Deutsche Bank AG/London |
vk.com/id4464259433 December 2018
Building Materials
European Building & Construction
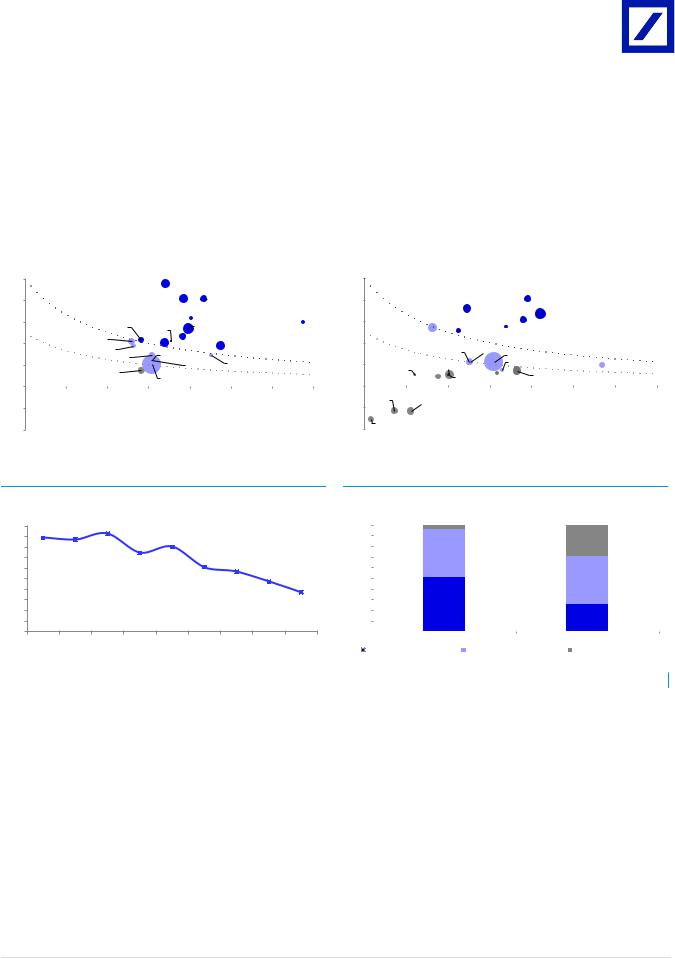
LafargeHolcim EM portfolio now largely de-risked
Reflecting six years of prices and margins erosion, we believe LafargeHolcim EM portfolio is now largely de-risked. Our analysis shows that in 2014, more than 50% of LafargeHolcim EM portfolio was over-earning (ROCE for a new project >10%) – this has now decreased to only 25% with limited risks of prices and profitability as no projects from new entrants has been recorded in these countries. In addition, we estimate that now 30% of LafargeHolcim EM portfolio is under-earning, with a significant upside potential either through consolidation or capacity utilization improvement.
Figure 127:ROCE for a new project in LafargeHolcim EM - 2014 conditions
50% |
|
NOPAT / SALES |
|
|
|
Algeria |
|
|
|
|
|
|
|
|
|
|
|
|
|
|
|
|
|
||
|
|
51% OF EM |
|
|
|
|
|
|
|
|
|
|
40% |
|
|
|
Nigeria |
|
|
Morocco |
|
|
|
|
|
|
|
|
|
|
|
|
|
|
||||
|
|
|
|
|
|
|
Costa Rica |
|
|
Colombia |
||
30% |
|
|
|
|
|
|
Mexico |
|
|
|
|
|
|
|
|
South Africa |
Tanzania |
|
|
|
|
|
|
||
|
|
45% OF EM |
|
|
Ecuador |
|
|
|
|
|
||
|
|
|
Brazil |
|
|
|
|
|
|
|
|
|
20% |
|
|
|
Indonesia |
|
|
|
|
|
|||
|
|
|
|
Philippines |
|
|
|
|
||||
|
|
|
Lebanon |
|
|
|
|
|
|
ROCE = 10% |
||
|
|
|
Egypt |
Iraq |
|
|
|
|
|
|
|
|
10% |
|
|
|
|
|
|
Malaysia |
Bangladesh |
|
|
|
|
|
|
|
|
|
|
|
|
|
|
|
||
|
|
|
Argentina |
|
|
|
|
|
|
|
|
|
|
|
|
|
India |
|
|
|
|
|
ROCE = 5% |
||
0% |
|
|
|
|
|
|
|
|
|
|
|
|
|
|
|
|
|
|
|
|
|
|
|
|
|
0.2 |
0.3 |
0.4 |
0.5 |
|
0.6 |
0.7 |
0.8 |
0.9 |
||||
|
4% OF EM SALES |
|
|
|
|
|
|
|
|
|
|
|
-10% |
|
|
|
|
|
|
|
|
|
|
|
|
|
|
|
|
|
|
|
|
|
SALES / CE |
|||
-20%
Figure 128:ROCE for a new project in LafargeHolcim EM - 2018 conditions
50% |
|
NOPAT / SALES |
|
|
|
|
|
|
|
|
|
|
||
|
25% OF EM SALES |
|
|
|
|
|
|
|
|
|
|
|||
|
|
|
|
|
|
|
|
|
|
|
|
|||
40% |
|
|
|
|
|
|
Nigeria |
|
Morocco |
|
|
|
|
|
|
|
|
|
|
|
|
|
|
|
|
|
|
|
|
|
|
|
|
|
|
|
|
|
Mexico |
|
|
|
|
|
30% |
|
|
|
|
|
Lebanon |
|
|
|
|
|
|
|
|
|
|
|
Algeria |
|
|
|
Ecuador |
|
|
|
|
|
||
|
|
|
|
|
|
|
Costa Rica |
|
|
|
|
|
||
|
|
|
|
|
|
|
|
|
|
|
|
|
|
|
|
|
45% OF EM SALES |
|
|
|
|
|
|
|
|
|
|
||
20% |
|
|
|
|
|
|
|
|
|
|
|
|
|
|
|
|
|
|
|
Iraq |
Argentina |
|
|
|
|
|
|
||
|
|
|
|
|
|
India |
|
|
|
|
|
|
||
|
|
30% OF EM SALES |
|
|
|
|
|
|
ROCE = 10% |
|
|
|||
|
|
|
|
|
Colombia |
|
|
|
|
|||||
10% |
|
|
|
|
|
|
|
|
|
|
|
|||
|
|
|
|
Zambia |
|
|
|
Kenya |
||||||
|
|
|
|
|
|
|
|
|
||||||
|
|
Indonesia |
|
Tanzania |
|
Philippines |
|
|
ROCE = 5% |
|
||||
|
|
|
|
|
|
|
|
|
|
|||||
|
|
|
South Africa |
Bangladesh |
|
|
|
|
|
|||||
|
|
|
|
|
|
|
|
|
|
|
||||
0% |
|
|
|
|
|
|
|
|
|
|
|
|||
0.2 |
0.3 |
|
0.4 |
|
|
0.5 |
0.6 |
0.7 |
0.8 |
0.9 |
||||
|
|
|
|
|||||||||||
|
|
Brazil |
Malaysia |
|
|
|
|
|
|
|
SALES / CE |
|||
-10% |
|
|
|
|
|
|
|
|
|
|
|
|
|
|
-20% |
|
Egypt |
|
|
|
|
|
|
|
|
|
|
|
|
|
|
|
|
|
|
|
|
|
|
|
|
|
|
|
Source: Deutsche Bank estimates, Company data. Note: Bubble size indicates % sales from the country. |
Source: Deutsche Bank estimates, Company data. Note: Bubble size indicates % sales from the country. |
|
|
|
|
Figure 129: Average ROCE evolution for a new project in Lafargeholcim EM
14% |
|
|
|
|
|
|
|
|
13% |
|
|
|
|
|
|
|
|
12% |
|
|
|
|
|
|
|
|
11% |
|
|
|
|
|
|
|
|
10% |
|
|
|
|
|
|
|
|
9% |
|
|
|
|
|
|
|
|
8% |
|
|
|
|
|
|
|
|
7% |
|
|
|
|
|
|
|
|
6% |
|
|
|
|
|
|
|
|
5% |
|
|
|
|
|
|
|
|
4% |
|
|
|
|
|
|
|
|
2010 |
2011 |
2012 |
2013 |
2014 |
2015 |
2016 |
2017 |
2018E |
Source: Deutsche Bank estimates, Company data
Figure 130: Share of LafargeHolcim sales by type of EM (2018 vs. 2014)
100% |
|
|
4% |
|
|
|
90% |
|
|
|
|
30% |
|
80% |
|
|
|
|
|
|
|
|
|
|
|
|
|
70% |
|
|
45% |
|
|
|
|
|
|
|
|
|
|
60% |
|
|
|
|
|
|
50% |
|
|
|
|
45% |
|
40% |
|
|
|
|
|
|
30% |
|
|
51% |
|
|
|
20% |
|
|
|
|
|
|
10% |
|
|
|
|
25% |
|
|
|
|
|
|
|
|
0% |
|
|
|
|
|
|
|
|
|
2014 |
|
2018 |
|
Over-earning (ROCE > 10%) |
Equilibrium (ROCE btw 5-10%) |
Under-earning (ROCE <5%) |
||||
Source: Deutsche Bank estimates, Company data
Supply / Demand balance in EM should improve in 2019
After 6 years of continued capacity utilization decrease and lfl EBITDA deterioriation in Emerging Markets, we believe 2019 should mark an inflection point in EM. The demand profile should benefit from the positive impact of higher commodities prices on the economies while capacity additions have also slowed down reflecting a more normalized level of profitability in most EM markets. Reflecting this, for the first time since 2013, we expect a capacity utilization improvement on LafargeHolcim EM portfolio in 2019, with a positive impact on profits generation.
Deutsche Bank AG/London |
Page 65 |
vk.com/id446425943
3 December 2018
Building Materials
European Building & Construction
Figure 131: Oil prices vs. demand growth evolution in |
|
Figure 132: LafargeHolcim EM demand growth profile |
LHN oil exporting countries |
|
|
|
|
|
110 |
|
|
|
|
|
|
|
|
|
|
|
|
|
|
|
|
|
|
100 |
|
|
|
|
|
|
|
|
|
|
|
|
|
|
|
|
|
|
90 |
|
|
|
|
|
|
|
|
|
|
|
|
|
|
|
|
|
|
|
|
|
|
|
|
|
|
|
|
|
|
|
|
|
Bloomberg consensus |
|
||
80 |
|
|
|
|
|
|
|
|
|
|
|
|
|
|
|
$60/bbl |
|
|
70 |
|
|
|
|
|
|
|
|
|
|
|
|
|
|
|
|
|
|
60 |
|
|
|
|
|
|
|
|
|
|
|
|
|
|
|
|
|
|
50 |
|
|
|
|
|
|
|
|
|
|
|
|
|
|
|
|
|
|
40 |
|
|
|
|
|
|
|
|
|
|
|
|
|
|
|
|
|
|
2007 |
2008 |
2009 |
2010 |
2011 |
2012 |
2013 |
2014 |
2015 |
2016 |
2017 |
2018E |
2019E |
||||||
|
|
|
|
|
|
Brent crude ($/bbl, lhs) |
|
|
|
|
Cement demand growth oil exp. (%, rhs) |
|||||||
|
|
|
|
|
|
|
|
|
||||||||||
Source: Deutsche Bank estimates, Bloomberg Finance LP
12% |
|
|
2013 |
2014 |
2015 |
2016 |
2017 |
2018E |
2019E |
10% |
|
Cement demand Oil exporting |
9.5% |
0.5% |
-1.7% |
-3.2% |
-5.7% |
-0.9% |
1.8% |
|
|
||||||||
8% |
|
Cement demand non-oil exporting |
3.4% |
4.7% |
6.0% |
2.4% |
3.6% |
5.3% |
5.0% |
|
|
||||||||
6% |
|
EM Cement demand growth |
5.1% |
3.5% |
3.8% |
0.8% |
0.9% |
3.5% |
4.1% |
|
|
||||||||
4% |
|
GDP Oil exporting |
4.4% |
4.1% |
2.3% |
1.5% |
1.8% |
2.3% |
3.0% |
|
|
||||||||
2% |
|
GDP non oil exporting |
5.0% |
5.0% |
5.6% |
4.9% |
5.1% |
5.0% |
5.2% |
|
|
||||||||
0% |
|
EM GDP |
4.8% |
4.7% |
4.7% |
3.9% |
4.1% |
4.3% |
4.6% |
-2% |
|
||||||||
|
|
|
|
|
|
|
|
|
|
-4% |
|
|
|
|
|
|
|
|
|
-6% |
|
|
|
|
|
|
|
|
|
-8% |
|
|
|
|
|
|
|
|
|
|
Source: Deutsche Bank estimates, Company data, Bloomberg Finance LP |
|
|
|
|||||
|
|
|
|
||||||
|
|
|
|
|
|
|
|
|
|
Figure 133: LafargeHolcim EM lfl EBITDA growth vs. capacity utilization evolution
15% |
|
|
|
|
|
|
|
|
|
|
|
|
|
|
|
|
|
|
|
350 |
|||
|
|
|
|
|
|
|
|
|
|
|
|
|
|
|
|
|
|
||||||
10% |
|
|
|
|
|
|
|
|
|
|
|
|
|
|
|
|
|
|
|
|
|
250 |
|
|
|
|
|
|
|
|
|
|
|
|
|
|
|
|
|
|
|
|
|||||
|
|
|
|
|
|
|
|
|
|
|
|
|
|
|
|
|
|
|
|
|
|
|
|
5% |
|
|
|
|
|
|
|
|
|
|
|
|
|
|
|
|
|
|
|
150 |
|||
|
|
|
|
|
|
|
|
|
|
|
|
|
|
|
|
|
|
|
|
|
|
|
|
|
|
|
|
|
|
|
|
|
|
|
|
|
|
|
|
|
|
|
|
50 |
|||
0% |
|
|
|
|
|
|
|
|
|
|
|
|
|
|
|
|
|
|
|
|
|
|
|
-5% |
|
|
|
|
|
|
|
|
|
|
|
|
|
|
|
|
|
|
|
|
|
-50 |
|
|
|
|
|
|
|
|
|
|
|
|
|
|
|
|
|
|
|
|
|
|
-150 |
||
|
|
|
|
|
|
|
|
|
|
|
|
|
|
|
|
|
|
|
|
|
|||
|
|
|
|
|
|
|
|
|
|
|
|
|
|
|
|
|
|
|
|||||
-10% |
|
|
|
|
|
|
|
|
|
|
|
|
|
|
|
|
|
|
|
||||
|
|
|
|
|
|
|
|
|
|
|
|
|
|
|
|
|
|
|
|
|
-250 |
||
|
|
|
|
|
|
|
|
|
|
|
|
|
|
|
|
|
|
|
|
||||
-15% |
|
|
|
|
|
|
|
|
|
|
|
|
|
|
|
|
|
|
|
-350 |
|||
|
|
|
|
|
|
|
|
|
|
|
|
|
|
|
|
|
|
|
|
||||
2012 |
2013 |
2014 |
2015 |
2016 |
2017 |
2018E |
|||||||||||||||||

 lfl EBITDA growth in EM (%,lhs)
 YoY capacity utilization change in EM (bps,rhs)
Source: Deutsche Bank estimates, Company data, Excl. Huaxin improvement for 2018E
Figure 134: LHN supply/demand evolution in EM
8%
7%
6%
5%
4%
3%
2%
1%
0%
2012 |
2013 |
2014 |
2015 |
2016 |
2017 |
2018E |
2019E |
2020E |
||||||
|
|
|
|
YoY Demand growth % |
|
|
|
|
|
YoY Supply growth % |
|
|||
|
|
|
|
|
|
|
|
|
||||||
Source: Deutsche Bank estimates, Company data, Bloomberg Finance LP
FY 19E DB EBITDA forecasts c2.5-3% above consensus
We estimate consensus includes 5.6% lfl EBITDA growth for FY 19E, just above company’s target for 2019E of ‘at least 5% lfl EBITDA growth’. This means that excluding the costs savings (estimated at CHF250m for FY 19E – eg c4% of FY 19E EBITDA), consensus includes only c1% lfl EBITDA growth for FY 19E. This is in our view very conservative as Emerging Markets should finally improve (we conservatively forecast c3% lfl EBITDA growth excl. costs savings) while DM should benefit from a better price vs. cost environment in 2019 (5% lfl EBITDA growth forecasted in 2019E excl. costs savings). With three sets of results with easy comps (Q4 18 to Q2 19), we see room for consensus earnings upgrades on the stock.
Figure 135: LHN DB estimates vs. consensus
|
DB ests |
Consensus |
FY 18E EBITDA |
6,055 |
6,050 |
Scope Impact |
-115 |
0 |
FY 18E lfl EBITDA |
5,940 |
6,050 |
FY 19E lfl EBITDA |
6,442 |
6,391 |
FX impact |
-51 |
-51 |
FY 19E EBITDA |
6,391 |
6,340 |
lfl EBITDA growth |
8.5% |
5.6% |
lfl EBITDA growth excl. SG&A savings |
4.2% |
1.5% |
Source: Deutsche Bank estimates, Factset, Bloomberg Finance LP, Consensus has yet to adjust from Holcim Indonesia divestment
Figure 136: LHN geographical EBITDA performance
|
H1 18 |
H2 18E excl. |
FY 18E excl. |
FY 19E excl. |
|
SG&A savings |
SG&A savings |
SG&A savings |
|
|
|
|||
North America |
2.0% |
2.9% |
1.4% |
4.9% |
Europe |
1.2% |
6.6% |
5.1% |
5.3% |
Asia Pacific |
17.1% |
24.7% |
22.0% |
12.8% |
Africa Med East |
-33.5% |
-5.5% |
-20.4% |
-8.7% |
Latin America |
5.2% |
-4.2% |
-0.2% |
-2.3% |
GROUP |
-1.4% |
5.4% |
2.4% |
4.2% |
Source: Deutsche Bank estimates, Company data
Page 66 |
Deutsche Bank AG/London |
vk.com/id4464259433 December 2018
Building Materials
European Building & Construction
With macro risks mounting, LafargeHolcim could benefit from its more diversified portfolio
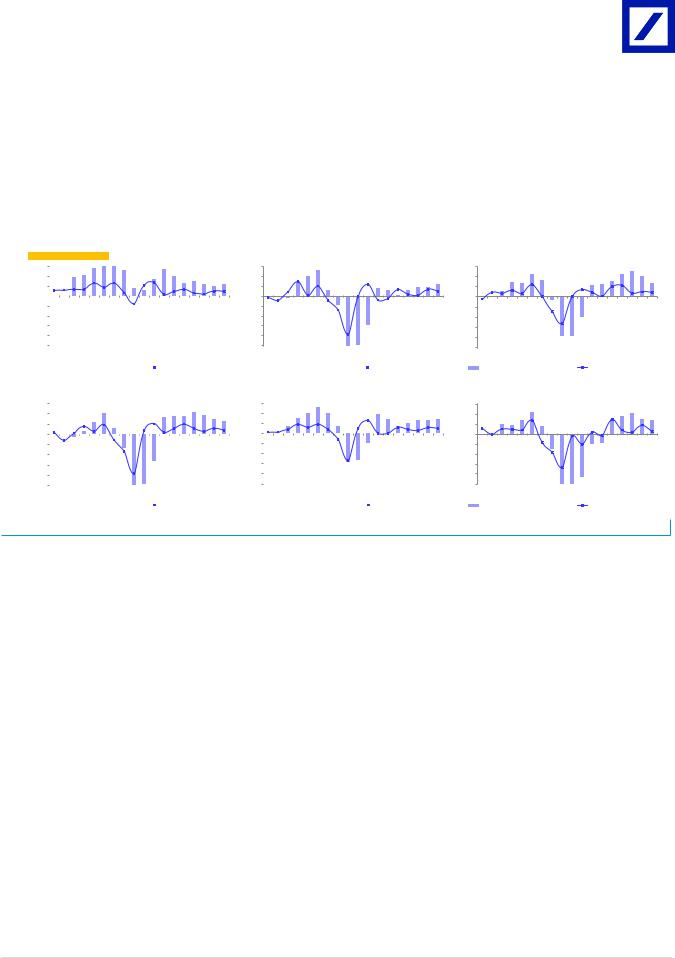
While it has been a disadvantage since the US recovery in 2012 and the timid European recovery of these last 2 years (LafargeHolcim has massively underperformed its more DM focused over this period), we believe that in a context of rising fears on DM growth, investors could see the value of a more diversified portfolio. Our analysis on the current LafargeHolcim portfolio shows that the demand profile has been much more resilient during the downturn vs. its peers (-9% volumes decrease in 2008-10 vs. -20/-30% for its peers).
Figure 137: LafargeHolcim portfolio most resilient amongst cement stocks
LafargeHolcim  Buzzi
Buzzi
15% |
|
|
|
|
|
|
|
|
|
|
|
|
|
|
|
|
|
|
|
15% |
|||
10% |
|
|
|
|
|
|
|
|
|
|
|
|
|
|
|
|
|
|
|
10% |
|||
5% |
|
|
|
|
|
|
|
|
|
|
|
|
|
|
|
|
|
|
|
5% |
|||
0% |
|
|
|
|
|
|
|
|
|
|
|
|
|
|
|
|
|
|
|
|
0% |
||
|
|
|
|
|
|
|
|
|
|
|
|
|
|
|
|
|
|
|
|
||||
-5% |
|
|
|
|
|
|
|
|
|
|
|
|
|
|
|
|
|
|
|
-5% |
|||
-10% |
|
|
|
|
|
|
|
|
|
|
|
|
|
|
|
|
|
|
|
-10% |
|||
-15% |
|
|
|
|
|
|
|
|
|
|
|
|
|
|
|
|
|
|
|
-15% |
|||
-20% |
|
|
|
|
|
|
|
|
|
|
|
|
|
|
|
|
|
|
|
-20% |
|||
-25% |
|
|
|
|
|
|
|
|
|
|
|
|
|
|
|
|
|
|
|
-25% |
|||
|
|
|
|
|
|
|
|
|
|
|
|
|
|
|
|
|
|
||||||
2001 |
2002 |
2003 |
2004 |
2005 |
2006 |
2007 |
2008 |
2009 |
2010 |
2011 |
2012 |
2013 |
2014 |
2015 |
2016 |
2017 |
2018 |
|
|
|
|||
|
|
|
3y cumulative cement demand growth |
|
|
YoY cement demand growth |
|
||||||||||||||||
|
|
|
|
|
|
||||||||||||||||||
2001 |
2002 |
2003 |
2004 |
2005 |
2006 |
2007 |
2008 |
2009 |
2010 |
2011 |
2012 |
2013 |
2014 |
2015 |
2016 |
2017 |
2018 |
3y cumulative cement demand growth |
|
|
YoY cement demand growth |
||||||||||||||
|
|
||||||||||||||||
 CRH
CRH  HeidelbergCement
15% |
|
|
|
|
|
|
|
|
|
|
|
|
|
|
|
|
|
|
15% |
|
|
|
|
|
|
|
|
|
|
|
|
|
|
|
|
|
|
|
|
|||
|
|
|
|
|
|
|
|
|
|
|
|
|
|
|
|
|
|
|
|
|
|
|
|
|
|
|
|
|
|
|
|
|
|
|
|
|
|
|||||
10% |
|
|
|
|
|
|
|
|
|
|
|
|
|
|
|
|
|
|
10% |
|
|
|
|
|
|
|
|
|
|
|
|
|
|
|
|
|
|
|
|
|||
5% |
|
|
|
|
|
|
|
|
|
|
|
|
|
|
|
|
|
|
5% |
|
|
|
|
|
|
|
|
|
|
|
|
|
|
|
|
|
|
|
|
|||
0% |
|
|
|
|
|
|
|
|
|
|
|
|
|
|
|
|
|
|
|
0% |
|
|
|
|
|
|
|
|
|
|
|
|
|
|
|
|
|
|
|
|
||
-5% |
|
|
|
|
|
|
|
|
|
|
|
|
|
|
|
|
|
|
-5% |
|
|
|
|
|
|
|
|
|
|
|
|
|
|
|
|
|
|
|
|
|||
-10% |
|
|
|
|
|
|
|
|
|
|
|
|
|
|
|
|
|
|
-10% |
|
|
|
|
|
|
|
|
|
|
|
|
|
|
|
|
|
|
|
|
|||
-15% |
|
|
|
|
|
|
|
|
|
|
|
|
|
|
|
|
|
|
-15% |
|
|
|
|
|
|
|
|
|
|
|
|
|
|
|
|
|
|
|
|
|||
-20% |
|
|
|
|
|
|
|
|
|
|
|
|
|
|
|
|
|
|
-20% |
|
|
|
|
|
|
|
|
|
|
|
|
|
|
|
|
|
|
|
|
|||
-25% |
|
|
|
|
|
|
|
|
|
|
|
|
|
|
|
|
|
|
-25% |
|
|
|
|
|
|
|
|
|
|
|
|
|
|
|
|
|
|
|
|
|||
|
|
|
|
|
|
|
|
|
|
|
|
|
|
|
|
|
|
2001 |
2002 |
2003 |
2004 |
2005 |
2006 |
2007 |
2008 |
2009 |
2010 |
2011 |
2012 |
2013 |
2014 |
2015 |
2016 |
2017 |
2018 |
|||||||
2001 |
2002 |
2003 |
2004 |
2005 |
2006 |
2007 |
2008 |
2009 |
2010 |
2011 |
2012 |
2013 |
2014 |
2015 |
2016 |
2017 |
2018 |
|||||||||||||||||||||||||
|
|
3y cumulative cement demand growth |
|
|
YoY cement demand growth |
|
|
|
3y cumulative cement demand growth |
|
|
YoY cement demand growth |
||||||||||||||||||||||||||||||
|
|
|
|
|
|
|
|
|||||||||||||||||||||||||||||||||||
Source: Deutsche Bank, Company data
Cemex
15% |
|
|
|
|
|
|
|
|
|
|
|
|
|
|
|
|
|
10% |
|
|
|
|
|
|
|
|
|
|
|
|
|
|
|
|
|
5% |
|
|
|
|
|
|
|
|
|
|
|
|
|
|
|
|
|
0% |
|
|
|
|
|
|
|
|
|
|
|
|
|
|
|
|
|
-5% |
|
|
|
|
|
|
|
|
|
|
|
|
|
|
|
|
|
-10% |
|
|
|
|
|
|
|
|
|
|
|
|
|
|
|
|
|
-15% |
|
|
|
|
|
|
|
|
|
|
|
|
|
|
|
|
|
-20% |
|
|
|
|
|
|
|
|
|
|
|
|
|
|
|
|
|
-25% |
|
|
|
|
|
|
|
|
|
|
|
|
|
|
|
|
|
2001 |
2002 |
2003 |
2004 |
2005 |
2006 |
2007 |
2008 |
2009 |
2010 |
2011 |
2012 |
2013 |
2014 |
2015 |
2016 |
2017 |
2018 |
3y cumulative cement demand growth |
|
|
YoY cement demand growth |
||||||||||||||
Titan
15% |
|
|
|
|
|
|
|
|
|
|
|
|
|
|
|
|
|
10% |
|
|
|
|
|
|
|
|
|
|
|
|
|
|
|
|
|
5% |
|
|
|
|
|
|
|
|
|
|
|
|
|
|
|
|
|
0% |
|
|
|
|
|
|
|
|
|
|
|
|
|
|
|
|
|
-5% |
|
|
|
|
|
|
|
|
|
|
|
|
|
|
|
|
|
-10% |
|
|
|
|
|
|
|
|
|
|
|
|
|
|
|
|
|
-15% |
|
|
|
|
|
|
|
|
|
|
|
|
|
|
|
|
|
-20% |
|
|
|
|
|
|
|
|
|
|
|
|
|
|
|
|
|
-25% |
|
|
|
|
|
|
|
|
|
|
|
|
|
|
|
|
|
2001 |
2002 |
2003 |
2004 |
2005 |
2006 |
2007 |
2008 |
2009 |
2010 |
2011 |
2012 |
2013 |
2014 |
2015 |
2016 |
2017 |
2018 |
3y cumulative cement demand growth |
|
|
YoY cement demand growth |
||||||||||||||
Forecasts and ratios |
|
|
|
|
|
Year End Dec 31 |
2016A |
2017A |
2018E |
2019E |
2020E |
Revenue (CHFm) |
26,904 |
27,022 |
27,510 |
28,099 |
29,659 |
EBITDA (CHFm) |
5,242 |
6,421 |
5,555 |
6,191 |
6,693 |
EBITA (CHFm) |
2,837 |
414 |
3,271 |
3,941 |
4,468 |
PBT DB (CHFm) |
3,338 |
173 |
2,944 |
3,448 |
3,907 |
PBT stated (CHFm) |
2,757 |
-288 |
2,444 |
3,248 |
3,807 |
DB EPS (CHF) |
3.64 |
-0.54 |
3.30 |
3.80 |
4.31 |
OLD DB EPS (CHF) |
3.64 |
-0.53 |
3.28 |
3.81 |
4.38 |
% Change |
0.0% |
1.0% |
0.6% |
-0.3% |
-1.6% |
DB EPS growth (%) |
– |
– |
– |
15.1 |
13.2 |
P/E (DB EPS) (x) |
12.9 |
– |
13.6 |
11.8 |
10.4 |
DB EV/ DB EBITDA (x) |
8.1 |
7.3 |
7.3 |
6.2 |
5.6 |
EV/EBITA (x) |
15.0 |
113.5 |
12.3 |
9.7 |
8.3 |
DPS (CHF) |
2.00 |
2.00 |
1.98 |
2.02 |
2.07 |
Yield (%) |
4.3 |
3.5 |
4.4 |
4.5 |
4.6 |
Source: Deutsche Bank estimates, company data |
|
|
|
|
|
Deutsche Bank AG/London |
Page 67 |
vk.com/id446425943
3 December 2018
Building Materials
European Building & Construction
Model updated: 29 November 2018
Running the Numbers
Europe
Switzerland
Building Materials
LafargeHolcim
|
Reuters: LHN.S |
Bloomberg: LHN SW |
|
|
|
|
Buy |
|
|
Price (29 Nov 18) |
CHF 44.82 |
|
||
|
|
|
|
Target price |
CHF 54.00 |
|
|
|
|
52-week Range |
CHF 41.14 – 59.70 |
|
|
|
|
Market Cap |
CHF 26,767m |
|
|
US$ 26,775m |
|
|
|
Company Profile
Holcim is a global leading producer of cement, ready-mix concrete and admixtures. The company generated sales of more than CHF21bn in 2010, employs around 80,000 people, and operates about 2100 production facilities in more than 70 countries across the world.
1yr Price Performance
65 |
|
|
|
60 |
|
|
|
55 |
|
|
|
50 |
|
|
|
45 |
|
|
|
40 |
|
|
|
Nov-17 |
Feb-18 |
May-18 |
Aug-18 |
|
|
LHN.S |
SPI (Rebased) |
Margin Trends
25 |
|
|
|
|
20 |
|
|
|
|
15 |
|
|
|
|
10 |
|
|
|
|
5 |
|
|
|
|
0 |
|
|
|
|
16 |
17 |
18E |
19E |
20E |
|
EBITDA Margin |
|
EBIT Margin |
|
Growth & Profitability
6 |
|
|
|
10 |
5 |
|
|
|
8 |
4 |
|
|
|
6 |
|
|
|
4 |
|
3 |
|
|
|
|
|
|
|
2 |
|
2 |
|
|
|
|
|
|
|
0 |
|
|
|
|
|
|
1 |
|
|
|
-2 |
0 |
|
|
|
-4 |
16 |
17 |
18E |
19E |
20E |
|
Sales growth (LHS) |
|
ROE (RHS) |
|
Solvency
50 |
|
|
|
7 |
40 |
|
|
|
6 |
|
|
|
5 |
|
|
|
|
|
|
30 |
|
|
|
4 |
20 |
|
|
|
3 |
10 |
|
|
|
2 |
|
|
|
1 |
|
|
|
|
|
|
0 |
|
|
|
0 |
16 |
17 |
18E |
19E |
20E |
|
Net debt/equity (LHS) |
|
Net interest cover (RHS) |
|
Xavier Marchand
+44(207)545-1400 xavier.marchand@db.com
Fiscal year end 31-Dec |
2016 |
2017 |
2018E |
2019E |
2020E |
|
|
|
|
|
|
Financial Summary |
|
|
|
|
|
DB EPS (CHF) |
3.64 |
-0.54 |
3.30 |
3.80 |
4.31 |
Reported EPS (CHF) |
2.68 |
-1.31 |
2.47 |
3.47 |
4.14 |
DPS (CHF) |
2.00 |
2.00 |
1.98 |
2.02 |
2.07 |
BVPS (CHF) |
50.89 |
46.53 |
46.32 |
47.09 |
48.54 |
Weighted average shares (m) |
606 |
597 |
597 |
597 |
597 |
Average market cap (CHFm) |
28,443 |
33,654 |
26,767 |
26,767 |
26,767 |
Enterprise value (CHFm) |
42,637 |
47,013 |
40,325 |
38,323 |
37,249 |
|
|
|
|
|
|
Valuation Metrics |
|
|
|
|
|
P/E (DB) (x) |
12.9 |
nm |
13.6 |
11.8 |
10.4 |
P/E (Reported) (x) |
17.5 |
nm |
18.2 |
12.9 |
10.8 |
P/BV (x) |
1.05 |
1.18 |
0.97 |
0.95 |
0.92 |
FCF Yield (%) |
4.5 |
3.8 |
6.0 |
7.0 |
8.7 |
Dividend Yield (%) |
4.3 |
3.5 |
4.4 |
4.5 |
4.6 |
EV/Sales (x) |
1.58 |
1.74 |
1.47 |
1.36 |
1.26 |
EV/EBITDA (x) |
8.1 |
7.3 |
7.3 |
6.2 |
5.6 |
EV/EBIT (x) |
15.0 |
113.5 |
12.3 |
9.7 |
8.3 |
|
|
|
|
|
|
Income Statement (CHFm) |
|
|
|
|
|
Sales revenue |
26,904 |
27,022 |
27,510 |
28,099 |
29,659 |
Gross profit |
11,272 |
8,674 |
11,744 |
12,805 |
13,773 |
EBITDA |
5,242 |
6,421 |
5,555 |
6,191 |
6,693 |
Depreciation |
2,405 |
6,007 |
2,285 |
2,250 |
2,225 |
Amortisation |
0 |
0 |
0 |
0 |
0 |
EBIT |
2,837 |
414 |
3,271 |
3,941 |
4,468 |
Net interest income(expense) |
-917 |
-958 |
-880 |
-750 |
-720 |
Associates/affiliates |
81 |
51 |
54 |
56 |
59 |
Exceptionals/extraordinaries |
0 |
0 |
0 |
0 |
0 |
Other pre-tax income/(expense) |
756 |
205 |
0 |
0 |
0 |
Profit before tax |
2,757 |
-288 |
2,444 |
3,248 |
3,807 |
Income tax expense |
835 |
536 |
721 |
926 |
1,085 |
Minorities |
299 |
-41 |
250 |
250 |
250 |
Other post-tax income/(expense) |
0 |
0 |
0 |
0 |
0 |
Net profit |
1,623 |
-783 |
1,473 |
2,072 |
2,472 |
DB adjustments (including dilution) |
581 |
461 |
500 |
200 |
100 |
DB Net profit |
2,204 |
-322 |
1,973 |
2,272 |
2,572 |
|
|
|
|
|
|
Cash Flow (CHFm) |
|
|
|
|
|
Cash flow from operations |
3,047 |
2,801 |
3,222 |
3,736 |
4,178 |
Net Capex |
-1,772 |
-1,522 |
-1,620 |
-1,850 |
-1,850 |
Free cash flow |
1,275 |
1,279 |
1,602 |
1,886 |
2,328 |
Equity raised/(bought back) |
5 |
-489 |
-77 |
0 |
0 |
Dividends paid |
-909 |
-1,212 |
-1,194 |
-1,184 |
-1,204 |
Net inc/(dec) in borrowings |
0 |
0 |
0 |
0 |
0 |
Other investing/financing cash flows |
2,172 |
798 |
-480 |
1,350 |
0 |
Net cash flow |
2,543 |
376 |
-149 |
2,052 |
1,124 |
Change in working capital |
-694 |
-925 |
-400 |
-400 |
-300 |
|
|
|
|
|
|
Balance Sheet (CHFm) |
|
|
|
|
|
Cash and other liquid assets |
4,923 |
4,217 |
4,187 |
4,598 |
4,822 |
Tangible fixed assets |
32,052 |
30,152 |
29,667 |
27,817 |
27,442 |
Goodwill/intangible assets |
17,264 |
15,595 |
15,595 |
15,595 |
15,595 |
Associates/investments |
4,528 |
4,234 |
4,234 |
4,234 |
4,234 |
Other assets |
10,574 |
9,175 |
9,415 |
9,655 |
9,835 |
Total assets |
69,341 |
63,373 |
63,098 |
61,899 |
61,929 |
Interest bearing debt |
19,720 |
18,622 |
18,741 |
17,100 |
16,201 |
Other liabilities |
15,004 |
13,683 |
13,523 |
13,363 |
13,243 |
Total liabilities |
34,724 |
32,305 |
32,264 |
30,463 |
29,444 |
Shareholders' equity |
30,822 |
27,787 |
27,663 |
28,124 |
28,992 |
Minorities |
3,925 |
3,188 |
3,238 |
3,288 |
3,338 |
Total shareholders' equity |
34,747 |
30,975 |
30,901 |
31,412 |
32,330 |
Net debt |
14,797 |
14,405 |
14,554 |
12,502 |
11,378 |
|
|
|
|
|
|
Key Company Metrics |
|
|
|
|
|
Sales growth (%) |
na |
0.4 |
1.8 |
2.1 |
5.6 |
DB EPS growth (%) |
na |
nm |
nm |
15.1 |
13.2 |
EBITDA Margin (%) |
19.5 |
23.8 |
20.2 |
22.0 |
22.6 |
EBIT Margin (%) |
10.5 |
1.5 |
11.9 |
14.0 |
15.1 |
Payout ratio (%) |
74.6 |
nm |
80.4 |
58.1 |
49.9 |
ROE (%) |
5.3 |
-2.7 |
5.3 |
7.4 |
8.7 |
Capex/sales (%) |
6.6 |
5.6 |
5.9 |
6.6 |
6.2 |
Capex/depreciation (x) |
0.7 |
0.3 |
0.7 |
0.8 |
0.8 |
Net debt/equity (%) |
42.6 |
46.5 |
47.1 |
39.8 |
35.2 |
Net interest cover (x) |
3.1 |
0.4 |
3.7 |
5.3 |
6.2 |
Source: Company data, Deutsche Bank estimates
Page 68 |
Deutsche Bank AG/London |
vk.com/id4464259433 December 2018
Building Materials
European Building & Construction
Rating |
|
Company |
|
|
Research Analyst |
|
|
|
|
|
|
||||
Buy |
|
Saint Gobain |
|
|
|||
|
|
|
|
|
Xavier Marchand |
|
|
|
|
|
|
+44-20-754-51400 |
|
||
Europe |
|
|
|
|
xavier.marchand@db.com |
|
|
|
|
|
|
|
|
|
|
France |
|
|
|
|
|
|
|
Building & Construction |
|
|
|
|
Price at 28 Nov 2018 (EUR) |
32.94 |
|
|
Reuters |
Bloomberg |
|
|
|
|
|
|
|
Price Target (EUR) |
43.00 |
||||
Building Materials |
|
|
|
|
|||
|
SGOB.PA |
SGO FP |
|
|
|
|
|
|
|
52-week range (EUR) |
48.54 - 30.93 |
||||
|
|
|
|||||
|
|
|
|
|
|
|
|
|
|
|
|
|
|
|
|
Saint Gobain (BUY)
With this note, we transfer primary coverage of Saint Gobain from Glynis Johnson to Xavier Marchand with immediate effect.
Recession scenario already priced in
Since the start of the year, Saint Gobain share price has declined by 27% as the stock has been hit by the roll-over of new resi construction data in Europe (especially in France) as well as the fade in European PMI. Yet, with its strong exposure to the more late-cycle and more resilient renovation segment and its increasing exposure to EM, we believe the stock should be less a ected than others by the slowdown of European new-build data. In addition, with strong pricing momentum and easy comps in H1, we see limited risks to consensus. Saint Gobain trades at 8.9x 2019 P/E and 5.8x 2019E EV/EBITDA, levels which have been seen historically only during the severe recession periods of 2008 and 2012. As such, we believe a recession scenario is already priced in and see a favourable risk-reward. BUY.
Saint Gobain at a glance
Figure 138: 2018E Sales* and EBITDA by division
|
High Perf |
Building Dist |
High Perf |
|
|
Materials |
|||
Building Dist |
22% |
Materials |
||
11% |
||||
45% |
|
23% |
||
|
|
|||
|
Flat Glass |
|
|
|
|
13% |
|
|
|
|
|
Exterior |
|
|
|
|
Solutions |
|
|
|
|
14% |
|
|
Exterior |
Interior |
Interior |
Flat Glass |
|
Solutions |
Solutions |
|||
18% |
||||
14% |
17% |
Solutions |
||
|
||||
|
|
23% |
|
Source: Deutsche Bank, Company data. Note: Total not equal to 100% due to Group / Corp activities.
Key changes |
|
TP |
55.80 to 43.00 ↓ -22.9% |
Source: Deutsche Bank |
|
Price/price relative
60 |
|
|
40 |
|
|
20 |
|
|
2016 |
2017 |
2018 |
|
|
Saint Gobain |
|
|
|
DJ (.STOXXE) (Rebased) |
|
|
|
|
|
|
|||
Performance |
1m |
3m |
12m |
||||
(%) |
|
|
|
|
|
|
|
Absolute |
2.9 |
|
-9.9 |
-32.1 |
|||
DJ |
0.9 |
|
-9.3 |
-10.6 |
|||
(.STOXXE) |
|
|
|
|
|
||
Source: Deutsche Bank |
|
|
|
|
|
||
|
|
|
|
|
|
||
Key indicators (FY1) |
|
|
|
|
|
||
ROE (%) |
|
|
|
|
12.3 |
||
Net debt/equity (%) |
|
|
|
|
38.1 |
||
Book value/share (EUR) |
|
34.6 |
|||||
Price/book (x) |
|
|
|
|
1.0 |
||
Net interest cover (x) |
|
– |
|||||
EBIT margin (%) |
|
|
|
|
7.5 |
||
Source: Deutsche Bank |
|
|
|
|
|
||
|
|
||||||
Stock & option liquidity data |
|
||||||
Market cap (EUR)(m) |
|
18,011.6 |
|||||
Shares outstanding (m) |
|
547 |
|||||
Source: Deutsche Bank |
|
|
|
|
|
||
Stock & option liquidity data |
|
Free float (%) |
– |
Option volume (und. shrs., 1M avg.) |
83,400 |
|
|
Source: Deutsche Bank |
|
Deutsche Bank AG/London |
Page 69 |
vk.com/id446425943
3 December 2018
Building Materials
European Building & Construction
Figure 139: 2007 - 2009 Organic sales growth
0% |
|
|
|
|
|
|
|
|
|
|
|
-5% |
|
-1% |
-4% |
|
|
|
|
|
|
|
|
-10% |
|
|
|
|
|
|
|
|
|
|
|
|
|
|
-9% |
|
|
|
|
|
|
|
|
-15% |
|
|
|
|
|
|
|
|
|
|
|
|
|
|
|
-13% |
|
|
|
|
|
|
|
|
|
|
|
|
|
|
|
|
|
|
|
-20% |
|
|
|
|
|
-17% |
-19% |
-19% |
|
|
|
|
|
|
|
|
|
|
|
|
|||
-25% |
|
|
|
|
|
|
-22% |
|
|
||
|
|
|
|
|
|
|
|
-24% |
|
||
-30% |
|
|
|
|
|
|
|
|
|
|
|
|
|
|
|
|
|
|
|
|
|
|
|
-35% |
|
|
|
|
|
|
|
|
|
|
|
-40% |
|
|
|
|
|
|
|
|
|
|
-34% |
|
Sika |
Geberit |
LafargeHolcim |
Saint Gobain |
Heidelberg |
Cemex |
Titan |
Buzzi |
CRH |
Kingspan |
|
|
|
Source: Deutsche Bank, Company data
Figure 141: Evolution of operating income by geography
100% |
|
|
|
|
|
|
|
|
90% |
|
|
21% |
|
|
|
|
|
80% |
|
|
|
|
|
|
35% |
|
70% |
|
|
8% |
|
|
|
|
|
|
|
|
|
|
|
|
|
|
60% |
|
|
|
|
|
|
|
|
|
|
|
|
|
|
20% |
|
|
50% |
|
|
42% |
|
|
|
|
|
|
|
|
|
|
|
|
||
40% |
|
|
|
|
|
|
|
|
30% |
|
|
|
|
|
|
34% |
|
|
|
|
|
|
|
|
|
|
20% |
|
|
|
|
|
|
|
|
10% |
|
|
29% |
|
|
|
|
|
|
|
|
|
|
|
11% |
|
|
0% |
|
|
|
|
|
|
|
|
|
|
|
|
|
|
|
|
|
|
|
|
2008 |
|
|
|
2017 |
|
|
|
France |
Other Western Europe |
North America |
Asia & Emerging |
|||
Source: Deutsche Bank, Company data
Figure 140: Saint Gobain has relatively lower exposure to new-build vs. peers in W Europe & N America
70% |
62% |
|
|
|
|
|
|
|
|
|
|
60% |
|
|
|
|
|
50% |
44% |
41% |
|
|
|
|
|
|
|
|
|
40% |
|
37% |
|
|
|
|
31% |
|
|
|
|
|
|
|
|
|
|
30% |
|
28% |
25% |
|
|
|
|
23% |
22% |
||
|
|
|
|
||
20% |
|
|
|
|
15% |
|
|
|
|
|
9% |
10% |
|
|
|
|
|
0%
Kingspan |
CRH |
Buzzi |
Titan |
Heidelberg |
Geberit |
Saint Gobain |
Cemex |
LafargeHolcim |
Tarkett |
Sika |
Source: Deutsche Bank estimates, Company data
Figure 142: SGO 12m forward P/E has disconnected vs. European PMI since H2 17
65 |
|
|
|
|
|
|
|
|
|
|
|
|
|
|
|
|
25 |
60 |
|
|
|
|
|
|
|
|
|
|
|
|
|
|
|
|
20 |
|
|
|
|
|
|
|
|
|
|
|
|
|
|
|
|
|
|
55 |
|
|
|
|
|
|
|
|
|
|
|
|
|
|
|
|
|
50 |
|
|
|
|
|
|
|
|
|
|
|
|
|
|
|
|
15 |
|
|
|
|
|
|
|
|
|
|
|
|
|
|
|
|
|
|
45 |
|
|
|
|
|
|
|
|
|
|
|
|
|
|
|
|
10 |
|
|
|
|
|
|
|
|
|
|
|
|
|
|
|
|
|
|
40 |
|
|
|
|
|
|
|
|
|
|
|
|
|
|
|
|
|
35 |
|
|
|
|
|
|
|
|
|
|
|
|
|
|
|
|
5 |
|
|
|
|
|
|
|
|
|
|
|
|
|
|
|
|
|
|
30 |
Oct-06 |
Jul-07 |
Apr-08 |
|
|
|
Apr-11 |
|
Oct-12 |
|
Apr-14 |
|
Oct-15 |
|
Apr-17 |
|
0 |
Jan-06 |
Jan-09 |
Oct-09 |
Jul-10 |
Jan-12 |
Jul-13 |
Jan-15 |
Jul-16 |
Jan-18 |
Oct-18 |
||||||||
|
|
|
|
Europe PMI |
|
|
|
|
|
SGO 12m forward P/E (rhs) |
|
|
|||||
Source: Deutsche Bank, Factset
Page 70 |
Deutsche Bank AG/London |