

DB European Building Construction 2019 Outlook_watermark
.pdfvk.com/id446425943
Deutsche |
The US: Robust growth in 2019 but housing risks are mounting |
|
US construction still below mid-cycle level |
||
Bank |
■ |
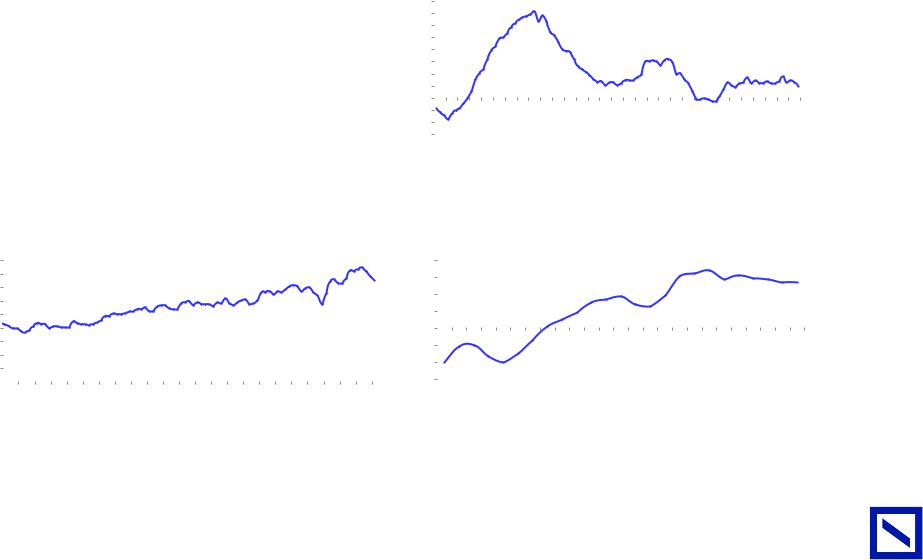
Mainly driven by the residential segment which is still 20% below mid-cycle level and more than 40% below peak levels, US construction market |
|
||
AG/London |
|
is below the long-term average. |
|
Titan Cement has the highest upside potential to mid-cycle due to its Florida exposure while Buzzi is the closest to mid-cycle (however still below) |
|
|
■ |
When taking into account the population growth, we believe 2018 cement demand is c15% below mid-cycle level. |
|
■ |
|
|
|
due to Texas. |
Figure 11: US cement demand vs. population evolution |
|
|
|
|
|
|
|
Figure 12: US cement demand per capita evolution |
|
|
|
|
|
|
|
|
||||||||||||||||||||||||||||||||||||||
140 |
|
|
|
|
|
|
|
|
|
|
|
|
|
|
|
|
|
|
|
|
|
|
|
|
323 |
|
350 |
450 |
|
|
|
|
|
|
|
|
|
|
|
|
|
|
|
|
|
|
|
|
|
|
|
|
|
|
|
|
|
|
|
|
|
|
|
|
|
|
|
|
|
|
|
|
|
|
|
|
|
|
|
|
|
|
|
|
|
|
|
|
|
|
|
|
|
|
|
|
|
|
|
|
|
|
|
|
|
|
|
|
|
120 |
|
|
|
|
|
|
|
|
|
|
|
|
|
|
|
|
|
|
|
|
|
|
|
|
|
|
300 |
|
|
|
|
|
|
|
|
|
|
|
|
|
|
|
|
|
|
|
|
|
|
|
|
|
|
|
|
|
|
|
|
|
|
|
|
|
|
|
|
|
|
|
|
|
|
|
|
|
|
|
|
|
|
|
400 |
|
|
|
|
|
|
|
|
|
|
|
|
|
|
|
|
|
|
|
|
|
|
|
|
|
|
100 |
|
|
|
|
|
|
|
|
|
|
|
|
|
|
|
|
|
|
|
|
|
|
|
|
94.3 |
250 |
|
|
|
|
|
|
|
|
|
|
|
|
|
|
|
|
|
|
|
378 |
|
Long-term average: |
||||||
|
|
|
|
|
|
|
|
|
|
|
|
|
|
|
|
|
|
|
|
|
|
|
|
|
|
|
|
|
|
|
|
|
|
|
|
|
|
|
|
|
|
|
|
|
|
|
|
|
|
|||||
80 |
|
|
|
|
|
|
|
|
|
|
|
|
|
|
|
|
|
|
|
|
|
|
|
|
|
|
200 |
350 |
|
|
|
|
|
|
|
|
|
|
|
|
|
|
|
|
|
|
|
|
|
|
328 kg / inh. |
|||
|
|
|
|
|
|
|
|
|
|
|
|
|
|
|
|
|
|
|
|
|
|
|
|
|
|
|
|
|
|
|
|
|
|
|
|
|
|
|
|
|
|
|
|
|
|
|
|
|
|
|
|
|||
|
|
|
|
|
|
|
|
|
|
|
|
|
|
|
|
|
|
|
|
|
|
|
|
|
|
|
|
|
|
|
|
|
|
|
|
|
|
|
|
|
|
|
|
|
|
|
|
|
|
|
|
|
||
60 |
|
|
|
|
|
|
|
|
|
|
|
|
|
|
|
|
|
|
|
|
|
|
|
|
|
|
150 |
|
|
|
|
|
|
|
|
|
|
|
|
|
|
|
|
|
|
|
|
|
|
|
|
|
|
292 |
|
|
|
|
|
|
|
|
|
|
|
|
|
|
|
|
|
|
|
|
|
|
|
|
|
|
300 |
|
|
|
|
|
|
|
|
|
|
|
|
|
|
|
|
|
|
|
|
|
|
|
|
|
|
||
|
|
|
|
|
|
|
|
|
|
|
|
|
|
|
|
|
|
|
|
|
|
|
|
|
|
|
|
|
|
|
299 |
|
|
|
|
|
|
|
|
|
|
|
|
|
|
|
|
|
|
|
|
|
||
40 |
|
|
|
|
|
|
|
|
|
|
|
|
|
|
|
|
|
|
|
|
|
|
|
|
|
|
100 |
|
|
|
|
|
|
|
|
|
|
|
|
|
|
|
|
|
|
|
|
|
|
|
|
|
||
|
|
|
|
|
|
|
|
|
|
|
|
|
|
|
|
|
|
|
|
|
|
|
|
|
|
|
|
|
|
|
|
|
|
|
|
|
|
|
281 |
|
|
|
|
|
|
|
|
|
|
|
|
|
||
|
|
|
|
|
|
|
|
|
|
|
|
|
|
|
|
|
|
|
|
|
|
|
|
|
|
|
|
|
|
|
|
|
|
|
|
|
|
|
|
|
|
|
|
|
|
|
|
|
|
|
|
|
|
|
20 |
|
|
|
|
|
|
|
|
|
|
|
|
|
|
|
|
|
|
|
|
|
|
|
|
|
|
50 |
250 |
|
|
|
|
|
|
|
|
|
|
|
|
|
|
|
|
|
|
|
|
|
|
|
|
|
|
|
|
|
|
|
|
|
|
|
|
|
|
|
|
|
|
|
|
|
|
|
|
|
|
|
|
|
|
|
|
|
|
|
|
|
|
|
|
|
|
|
|
|
|
|
|
|
|
|
|
|
|
|
||
0 |
|
|
|
|
|
|
|
|
|
|
|
|
|
|
|
|
|
|
|
|
|
|
|
|
|
|
0 |
|
|
|
|
|
|
|
|
233 |
|
|
|
|
|
|
|
|
|
|
|
|
|
228 |
|
|
|
|
|
|
|
|
|
|
|
|
|
|
|
|
|
|
|
|
|
|
|
|
|
|
|
|
|
|
200 |
|
|
|
|
|
|
|
|
|
|
|
|
|
|
|
|
|
|
|
|
|
|
|
|
|
|
||
1965 |
1967 |
1969 |
1971 |
1973 |
1975 |
1977 |
1979 |
1981 |
1983 |
1985 |
1987 |
1989 |
1991 |
1993 |
1995 |
1997 |
1999 |
2001 |
2003 |
2005 |
2007 |
2009 |
2011 |
2013 |
2015 |
2017 |
|
|
|
|
|
|
|
|
|
|
|
|
|
|
|
|
|
|
|
|
|
|
|
|
|
|
|
|
|
1965 |
1967 |
1969 |
1971 |
1973 |
1975 |
1977 |
1979 |
1981 |
1983 |
1985 |
1987 |
1989 |
1991 |
1993 |
1995 |
1997 |
1999 |
2001 |
2003 |
2005 |
2007 |
2009 |
2011 |
2013 |
2015 |
2017 |
|||||||||||||||||||||||||||
|
|
|
|
US cement demand (lhs) |
US Population (rhs) |
|
|
|
|
|
US cement demand per cap |
1965-2017 average |
|
|
|
|
|
|
|
|
|||||
Source: Deutsche Bank, US Census, US PCA |
|
Source: Deutsche Bank, US Census, US PCA |
|
|||||||||
|
|
|||||||||||
|
|
|
|
|
|
|
|
|
|
|
|
|
Figure 13: US housing starts (SAAR '000) |
|
Figure 14: Demand evolution per capita on companies' footprint |
|
|
|
2,500 |
|
|
|
|
|
|
|
|
|
|
|
|
|
|
|
|
|
|
|
|
|
|
|
|
|
|
|
|
|
|
|
2018 vs 1965- |
2018 vs. |
Peak vs. 2018 |
|
|
|
|
|
|
|
|
|
|
|
|
|
|
|
|
|
|
|
|
|
|
|
|
|
|
|
|
|
|
|
|
|
2018 average |
trough |
||
2,000 |
|
|
|
|
|
|
|
|
|
|
|
|
|
|
|
|
|
|
|
|
|
|
|
|
|
|
|
|
|
|
|
|
|
||
|
|
|
|
|
|
|
|
|
|
|
|
|
|
|
|
|
|
|
|
|
|
|
|
Long term avg - |
|
Buzzi |
-8% |
32% |
37% |
|
|||||
|
|
|
|
|
|
|
|
|
|
|
|
|
|
|
|
|
|
|
|
|
|
|
|
|
1,433 |
|
|
|
|
|
|||||
|
|
|
|
|
|
|
|
|
|
|
|
|
|
|
|
|
|
|
|
|
|
|
|
|
|
|
|
|
|
|
|
|
|
||
1,500 |
|
|
|
|
|
|
|
|
|
|
|
|
|
|
|
|
|
|
|
|
|
|
|
|
|
|
|
|
|
|
Cemex |
-16% |
41% |
63% |
|
|
|
|
|
|
|
|
|
|
|
|
|
|
|
|
|
|
|
|
|
|
|
|
|
|
|
|
|
|
|
|
|
||||
1,000 |
|
|
|
|
|
|
|
|
|
|
|
|
|
|
|
|
|
|
|
|
|
|
|
|
|
|
|
1203 |
|
CRH (Heavyside) |
-15% |
21% |
46% |
|
|
500 |
|
|
|
|
|
|
|
|
|
|
|
|
|
|
|
|
|
|
|
|
|
|
|
|
|
|
|
|
|
|
Heidelberg |
-13% |
27% |
45% |
|
|
|
|
|
|
|
|
|
|
|
|
|
|
|
|
|
|
|
|
|
|
|
|
|
|
|
|
|
|
|
|
|
|
|
|
|
|
|
|
|
|
|
|
|
|
|
|
|
|
|
|
|
|
|
|
|
|
|
|
|
|
|
|
|
|
|
|
LafargeHolcim |
-14% |
22% |
45% |
|
0 |
|
|
|
|
|
|
|
|
|
|
|
|
|
|
|
|
|
|
|
|
|
|
|
|
|
|
|
|
|
|
Titan |
-21% |
46% |
94% |
|
1965 |
1967 |
1969 |
1971 |
1973 |
1975 |
1977 |
1979 |
1981 |
1983 |
1985 |
1987 |
1989 |
1991 |
1993 |
1995 |
1997 |
1999 |
2001 |
2003 |
2005 |
2007 |
2009 |
2011 |
2013 |
2015 |
2017 |
|
|
|
||||||
|
|
|
|
|
|
|
|||||||||||||||||||||||||||||
Source: Deutsche Bank, US Census |
|
|
|
|
|
|
|
|
|
|
|
|
|
|
|
|
|
|
|
|
|
|
Source:Deutsche Bank estimates, Company data |
|
|
|
|||||||||
|
|
|
|
|
|
|
|
|
|
|
|
|
|
|
|
|
|
|
|
|
|
|
|
|
|||||||||||
|
|
|
|
|
|
|
|
|
|
|
|
|
|
|
|
|
|
|
|
|
|
|
|
|
|
|
|
|
|
|
|
|
|
|
|
11 Page
Building European |
2018 December 3 Materials Building |
Construction & |
|
vk.com/id446425943
12Page |
|
The US growth should show no sign of moderation in 2019 |
|
|
|
|
|
|
|
|
|
|
|
|
|
|
||||||||||||
|
■ |
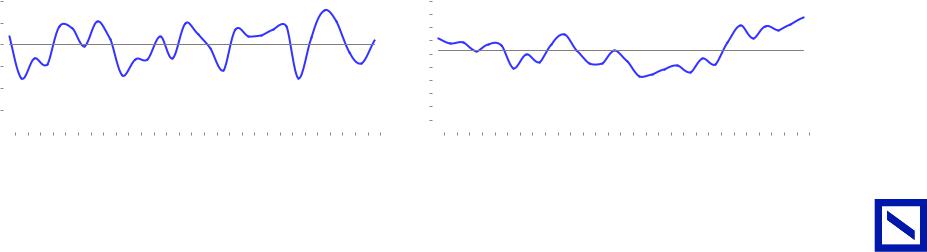
All leading indicators point at a continued cement demand growth in 2019: building permits are up 6% YoY YTD, Dodge Momentum Index on non |
||||||||||||||||||||||||||
|
|
|
|
|
residential buildings is also up c15-20% YoY while 12m trailing highways awards are up 14% in Sept 18. |
|
|
|
|
|
|
|
|
|
|
|
||||||||||||
|
|
■ |
PCA (the reference for cement consultants in the US) shares this optimism for 2019E, with cement demand growth forecasts of 2.6%. |
|
|
|
|
|||||||||||||||||||||
|
|
|
|
|
|
|
|
|
|
|
|
|
|
|
|
|
|
|
||||||||||
|
|
Figure 15: PCA US cement forecasts for 2019E - 20E |
|
|
|
|
Figure 16: YoY change in 9m trailing US building permits |
|
|
|
|
|
|
|
||||||||||||||
|
|
|
|
|
|
|
|
|
|
|
|
40% |
|
|
|
|
|
|
|
|
|
|
|
|
|
|
|
|
|
|
FALL 2018 |
2017 |
2018E |
2019E |
2020E |
|
|
|
|
|
|
|
|
|
|
|
|
|
|
|
|
|
|||||
|
|
|
35% |
|
|
|
|
|
|
|
|
|
|
|
|
|
|
|
|
|||||||||
|
|
|
|
|
|
|
|
|
|
|
|
|
|
|
|
|
|
|
|
|
|
|
|
|
|
|
|
|
|
|
RESIDENTIAL |
6.8% |
3.8% |
3.1% |
1.7% |
|
30% |
|
|
|
|
|
|
|
|
|
|
|
|
|
|
|
|
||||
|
|
|
|
|
|
|
|
|
|
|
|
25% |
|
|
|
|
|
|
|
|
|
|
|
|
|
|
|
|
|
|
NON-RESI |
8.7% |
1.7% |
2.9% |
2.4% |
|
20% |
|
|
|
|
|
|
|
|
|
|
|
|
|
|
|
|
||||
|
|
INFRASTRUCTURE |
-2.0% |
2.8% |
2.2% |
1.2% |
|
15% |
|
|
|
|
|
|
|
|
|
|
|
|
|
|
|
|
||||
|
|
|
10% |
|
|
|
|
|
|
|
|
|
|
|
|
|
|
|
|
|||||||||
|
|
|
|
|
|
|
|
|
|
|
|
|
|
|
|
|
|
|
|
|
|
|
|
|
5% |
|
||
|
|
TOTAL |
|
2.4% |
2.9% |
2.6% |
1.6% |
|
5% |
|
|
|
|
|
|
|
|
|
|
|
|
|
|
|||||
|
|
|
|
|
|
|
|
|
|
|
|
|
|
|
|
|
|
|
|
|||||||||
|
|
|
|
|
|
|
|
|
|
|
|
0% |
|
|
|
|
|
|
|
|
|
|
|
|
|
|
|
|
|
|
|
|
|
|
|
|
|
|
|
|
|
|
|
|
|
|
|
|
|
|
|
|
|
|
|||
|
|
|
|
|
|
|
|
|
|
|
|
|
|
|
|
|
|
|
|
|
|
|
|
|
|
|
|
|
|
|
|
|
|
|
|
|
|
|
|
|
-5% |
|
|
|
|
|
|
|
|
|
|
|
|
|
|
|
|
|
|
|
|
|
|
|
|
|
|
|
|
-10% |
|
|
|
|
|
|
|
|
|
|
|
|
|
|
|
|
|
|
|
|
|
|
|
|
|
|
|
|
-15% |
|
|
|
|
|
|
|
|
|
|
|
|
|
|
|
|
|
|
|
|
|
|
|
|
|
|
|
|
|
|
|
|
|
|
|
|
|
|
|
|
|
|
|
|
|
|
|
|
|
|
|
|
|
|
|
|
|
Jan-11 Apr-11 Jul-11 Oct-11 Jan-12 Apr-12 Jul-12 |
Oct-12 |
Jan-13 Apr-13 Jul-13 Oct-13 Jan-14 |
Apr-14 Jul-14 Oct-14 |
Jan-15 |
Apr-15 |
Jul-15 Oct-15 Jan-16 Apr-16 Jul-16 Oct-16 |
Jan-17 |
Apr-17 Jul-17 |
Oct-17 |
Jan-18 |
Apr-18 |
Jul-18 Oct-18 |
||||
|
|
Source: Deutsche Bank, US PCA |
|
|
|
|
|
|
Source: Deutsche Bank, Factset |
|
|
|
|
|
|
|
|
|
|
|
|
|
|
|||||
|
|
|
|
|
|
|
|
|
|
|
|
|
|
|
|
|
|
|
|
|
|
|||||||
|
|
|
|
|
|
|
|
|
|
|
|
|
|
|
|
|
|
|||||||||||
|
|
|
|
|
|
|
|
|
|
|
|
|
|
|
|
|
|
|||||||||||
|
|
Figure 17: Dodge Momentum Index (Commercial + Institutional |
|
|
|
Figure 18: YoY change in 12m trailing highway awards |
|
|
|
|
|
|
|
|
||||||||||||||
|
|
Building) |
|
|
|
|
|
|
|
|
|
|
|
|
|
|
|
|
|
|
|
|
|
|
|
|||
|
180 |
|
|
|
|
|
|
|
|
|
20% |
|
|
|
|
|
|
|
|
|
|
|
|
|
|
|
|
|
|
|
|
|
|
|
|
|
|
|
|
|
|
|
|
|
|
|
|
|
|
|
|
|
|
|
|||
|
160 |
|
|
|
|
|
|
|
|
|
15% |
|
|
|
|
|
|
|
|
|
|
|
|
|
|
|
|
|
|
|
|
|
|
|
|
|
|
|
|
|
|
|
|
|
|
|
|
|
|
|
|
|
|
|
|
|
|
|
140 |
|
|
|
|
|
|
150.5 |
|
10% |
|
|
|
|
|
|
|
|
|
|
|
|
|
14% |
|
|||
|
|
|
|
|
|
|
|
|
|
|
|
|
|
|
|
|
|
|
|
|
|
|
|
|
|
|||
|
120 |
|
|
|
|
|
|
|
|
|
|
|
|
|
|
|
|
|
|
|
|
|
|
|
|
|
||
|
|
|
|
|
|
|
|
|
|
|
|
|
|
|
|
|
|
|
|
|
|
|
|
|
|
|
||
|
100 |
|
|
|
|
|
|
|
|
|
5% |
|
|
|
|
|
|
|
|
|
|
|
|
|
|
|
|
|
|
|
|
|
|
|
|
|
|
|
|
|
|
|
|
|
|
|
|
|
|
|
|
|
|
|
|
||
|
80 |
|
|
|
|
|
|
|
|
|
0% |
|
|
|
|
|
|
|
|
|
|
|
|
|
|
|
|
|
|
|
|
|
|
|
|
|
|
|
|
|
|
|
|
|
|
|
|
|
|
|
|
|
|
|
|||
|
60 |
|
|
|
|
|
|
|
|
|
-5% |
|
|
|
|
|
|
|
|
|
|
|
|
|
|
|
|
|
|
|
|
|
|
|
|
|
|
|
|
|
|
|
|
|
|
|
|
|
|
|
|
|
|
|
|
|
|
|
40 |
|
|
|
|
|
|
|
|
|
|
|
|
|
|
|
|
|
|
|
|
|
|
|
|
|
|
|
|
20 |
|
|
|
|
|
|
|
|
|
-10% |
|
|
|
|
|
|
|
|
|
|
|
|
|
|
|
|
|
|
|
|
|
|
|
|
|
|
|
|
|
|
|
|
|
|
|
|
|
|
|
|
|
|
|
|
||
|
0 |
|
|
|
|
|
|
|
|
|
-15% |
|
Sep-16 Oct-16 Nov-16 Dec-16 Jan-17 |
Feb-17 |
Mar-17 Apr-17 May-17 Jun-17 |
Jul-17 Aug-17 |
Sep-17 |
Oct-17 |
Nov-17 Dec-17 Jan-18 Feb-18 Mar-18 |
Apr-18 |
May-18 |
Jun-18 |
Jul-18 |
Aug-18 |
Sep-18 |
|||
|
|
|
|
|
|
|
|
|
|
|
||||||||||||||||||
|
|
|
JUN-11 OCT-11 FEB-12 JUN-12 OCT-12 FEB-13 JUN-13 OCT-13 |
FEB-14 JUN-14 OCT-14 FEB-15 |
|
OCT-16 FEB-17 JUN-17 OCT-17 FEB-18 |
JUN-18 OCT-18 |
|
||||||||||||||||||||
|
|
|
FEB-11 |
JUN-15 OCT-15 FEB-16 JUN-16 |
|
|
||||||||||||||||||||||
AG/LondonBankDeutsche |
|
Source: Deutsche Bank, Dodge Data & Analytics |
|
|
|
|
|
|
Source: Deutsche Bank, US DoT, Bloomberg Finance LP |
|
|
|
|
|
|
|
|
|
|
|
|
|||||||
|
|
|
|
|
|
|
|
|
|
|
|
|
|
|
|
|
|
|
||||||||||
|
|
|
|
|
|
|
|
|
|
|
|
|
|
|
|
|
|
|
|
|
|
|
|
|
|
|
|
|
|
|
|
|
|
|
|
|
|
|
|
|
|
|
|
|
|
|
|
|
|
|
|
|
|
|
|
|
|
Building European |
2018 December 3 Materials Building |
Construction & |
|

vk.com/id446425943
Deutsche |
2019 Growth in the US should remain dictated by the footprint |
|
|
|
|
|
|
|
|
|
|
|
|
|
|
|
|
|
|
|
|||||||||||||||||
|
|
|
|
|
|
|
|
|
|
|
|
|
|
|
|
|
|
|
|
||||||||||||||||||
Bank |
|
■ |
With US regions at di erent stages of the recovery, we believe cement demand growth will remain dictated by the footprint. |
|
|
|
|
|
|
|
|||||||||||||||||||||||||||
|
■ |
We see above average demand growth on Cemex and Titan (driven by the residential but also strong infrastructure). |
|
|
|
|
|
|
|
|
|
|
|||||||||||||||||||||||||
|
|
|
|
|
|
|
|
|
|
|
|
||||||||||||||||||||||||||
AG/London |
|
■ |
State by state building permits and highways awards analysis suggest CRH and LafargeHolcim could see demand growth below country average. |
||||||||||||||||||||||||||||||||||
|
|
|
|
|
|
|
|
|
|
|
|
|
|
|
|
|
|
|
|
|
|
|
|
|
|
|
|
|
|
|
|
|
|
|
|
|
|
|
12% |
|
10.7% |
|
|
|
|
|
|
|
|
|
|
30% |
|
|
|
|
|
|
|
|
|
|
|
|
|
|
|
|
|
|
|
|
|
||
|
|
Figure 19: YoY % YTD US building permits on companies’ US footprints |
|
Figure 20: YoY change in trailing 12m highway awards dollars |
|
|
|
|
|
||||||||||||||||||||||||||||
|
|
|
|
9.9% |
|
|
|
|
|
|
|
|
25% |
|
|
|
|
|
|
|
|
|
|
|
|
|
|
|
|
|
|
22% |
|
||||
|
|
|
|
|
|
|
|
|
|
|
|
|
|
|
|
|
|
|
|
|
|
|
|
|
|
|
|
|
|
|
|||||||
|
10% |
|
|
|
|
|
|
|
|
|
|
|
|
|
|
|
|
|
|
|
|
|
|
|
|
|
|
|
|
|
|
|
|||||
|
|
|
|
|
|
|
|
|
|
|
|
|
20% |
|
|
|
|
|
|
|
|
|
|
|
|
|
|
|
|
|
|
|
|
|
|||
|
|
|
|
|
|
|
|
|
|
|
|
|
|
|
|
|
|
|
|
|
|
|
|
|
|
|
|
|
|
|
|
|
|
|
|
||
|
8% |
|
|
|
|
6.5% |
|
|
|
|
|
|
|
15% |
|
|
|
|
|
|
|
|
|
|
|
|
|
|
|
|
|
|
|
|
|
||
|
|
|
|
|
|
|
|
5.8% |
|
|
|
|
|
|
|
|
|
|
|
|
|
|
|
|
|
|
|
|
|
|
|
|
|
|
|||
|
|
|
|
|
|
|
|
|
|
|
|
|
|
|
|
|
|
|
|
|
|
|
|
|
|
|
|
|
|
|
|
|
|
|
|
||
|
6% |
|
|
|
|
|
|
|
|
|
|
|
10% |
|
|
|
|
|
|
|
|
|
|
|
|
|
|
|
|
|
|
|
|
|
|||
|
|
|
|
|
|
|
|
4.2% |
|
|
|
|
|
|
|
|
|
|
|
|
|
|
|
|
|
|
|
|
|
|
|
|
|
||||
|
|
|
|
|
|
|
|
|
|
|
|
|
|
|
|
|
|
|
|
|
|
|
|
|
|
|
|
|
|
|
|
|
|
|
|||
|
|
|
|
|
|
|
|
|
|
|
|
|
|
5% |
|
|
|
|
|
|
|
|
|
|
|
|
|
|
|
|
|
|
5% |
|
|||
|
4% |
|
|
|
|
|
|
|
|
2.7% |
|
|
|
0% |
|
|
|
|
|
|
|
|
|
|
|
|
|
|
|
|
|
|
|
||||
|
|
|
|
|
|
|
|
|
2.4% |
|
|
|
|
|
|
|
|
|
|
|
|
|
|
|
|
|
|
|
|
|
|
||||||
|
|
|
|
|
|
|
|
|
|
|
|
|
|
|
|
|
|
|
|
|
|
|
|
|
|
|
|
|
|
|
|||||||
|
|
|
|
|
|
|
|
|
|
|
|
|
|
|
|
|
|
|
|
|
|
|
|
|
|
|
|
|
|
|
|
|
|
|
|
||
|
2% |
|
|
|
|
|
|
|
|
|
|
|
|
-5% |
|
|
|
|
|
|
|
|
|
|
|
|
|
|
|
|
|
|
|
|
|
||
|
|
|
|
|
|
|
|
|
|
|
|
|
|
|
|
|
|
|
|
|
|
|
|
|
|
|
|
|
|
|
|
|
|
|
|
||
|
|
|
|
|
|
|
|
|
|
|
|
|
|
|
-10% |
|
|
|
|
|
|
|
|
|
|
|
|
|
|
|
|
|
|
|
|
|
|
|
0% |
|
CementTitan |
Cemex |
USAverage |
Heidelberg |
CRH |
UnicemBuzzi |
LafargeHolcim |
|
|
-15% |
|
16-Sep |
16-Oct 16-Nov 16-Dec |
Jan-17 AllFeb-17otherMar-17 |
marketsApr-17 May-17 |
17-Jul 17-Aug |
17-Sep 17-Oct 17-Nov |
17-Dec |
|
VulcanFeb-18 |
marketsApr-18 |
18-Jun |
18-Jul |
18-Aug |
18-Sep |
||||||||||
|
|
|
|
|
|
|
|
||||||||||||||||||||||||||||||
|
|
|
|
|
|
-20% |
|
|
|||||||||||||||||||||||||||||
|
|
|
|
|
|
|
|
|
|
|
|
|
|
|
|
|
|
|
|
|
Jun-17 |
|
|
|
Jan-18 |
Mar-18 |
May-18 |
|
|
|
|
|
|
||||
|
|
|
|
|
|
|
|
|
|
|
|
|
|
|
|
|
|
|
|
|
|
|
|
|
|
|
|
|
|
|
|
||||||
|
|
|
|
|
|
|
|
|
|
|
|
|
|
|
|
|
|
|
|
|
|
|
|
|
|
|
|
|
|
|
|||||||
|
Source: Deutsche Bank estimates, Company data |
|
|
|
|
|
|
|
|
|
Source: Deutsche Bank, US DoT |
|
|
|
|
|
|
|
|
|
|
|
|
|
|
|
|||||||||||
|
|
|
|
|
|
|
|
|
|
|
|
|
|
|
|
|
|
|
|
|
|
|
|
|
|||||||||||||
|
|
|
|
|
|
|
|
|
|
|
|
|
|
|
|
||||||||||||||||||||||
|
|
|
|
|
|
|
|
|
|
|
|
|
|
|
|
||||||||||||||||||||||
|
|
Figure 21: ABI Index by region and regional exposure by company |
|
|
|
Figure 22: Overlap with key Vulcan states by company |
|
|
|
|
|
|
|
||||||||||||||||||||||||
|
|
|
|
|
|
|
|
|
|
|
|
|
|
|
|
|
|
|
|
|
|
|
|
|
|
|
|
|
|
|
|
|
|
|
|
||
|
|
|
|
|
ABI Index |
Buzzi |
|
Cemex |
CRH |
Heidelberg |
LafargeHolcim |
|
Titan |
|
|
|
|
LTM |
|
VMC |
|
|
|
|
|
|
|
|
|
|
|
|
|
|
|
||
|
|
North East |
|
46.6 |
6% |
0% |
15% |
26% |
12% |
|
15% |
|
|
|
|
|
awards |
revenues |
Buzzi |
Cemex |
CRH |
Heidelberg |
|
LafargeHolcim |
|
Titan |
|
||||||||||
|
|
West |
|
51.3 |
1% |
29% |
28% |
21% |
14% |
|
0% |
|
|
California |
66% |
|
17% |
0% |
|
22% |
0% |
|
15% |
|
0% |
|
|
|
0% |
|
|
||||||
|
|
South |
|
54.1 |
53% |
66% |
30% |
35% |
38% |
|
85% |
|
|
|
|
|
|
|
|
|
|
|
|||||||||||||||
|
|
|
|
|
|
Texas |
23% |
|
17% |
35% |
|
17% |
6% |
|
14% |
|
15% |
|
|
0% |
|
|
|||||||||||||||
|
|
Midwest |
|
59.7 |
39% |
5% |
27% |
18% |
36% |
|
0% |
|
|
|
|
|
|
|
|
|
|
||||||||||||||||
|
|
|
|
|
|
Tennessee |
43% |
|
10% |
6% |
|
6% |
2% |
|
0% |
|
1% |
|
|
|
0% |
|
|
||||||||||||||
|
|
Average |
|
52.9 |
55.8 |
53.6 |
53.7 |
52.6 |
54.8 |
|
53.0 |
|
|
|
|
|
|
|
|
|
|
|
|||||||||||||||
|
|
|
|
|
|
|
|
|
|
|
|
|
|
|
|
|
|
|
|
|
|
|
|
|
|
|
|
||||||||||
|
|
|
|
|
|
|
|
|
|
|
|
|
|
|
|
Virginia |
172% |
|
10% |
0% |
|
0% |
1% |
|
4% |
|
3% |
|
|
|
20% |
|
|||||
|
|
|
|
|
|
|
|
|
|
|
|
|
|
|
|
Georgia |
-45% |
|
10% |
0% |
|
6% |
0% |
|
3% |
|
3% |
|
|
|
0% |
|
|
||||
|
|
|
|
|
|
|
|
|
|
|
|
|
|
|
|
Total |
|
|
64% |
41% |
|
51% |
9% |
|
37% |
|
23% |
|
|
20% |
|
||||||
|
Source: Deutsche Bank, AIA |
|
|
|
|
|
|
|
|
|
|
Source: Deutsche Bank estimates, US DoT, Company data |
|
|
|
|
|
|
|
|
|
|
|
|
|
||||||||||||
|
|
|
|
|
|
|
|
|
|
|
|
|
|
|
|
|
|
|
|
|
|
|
|
||||||||||||||
|
|
|
|
|
|
|
|
|
|
|
|
|
|
|
|
|
|
|
|
|
|
|
|
|
|
|
|
|
|
|
|
|
|
|
|
|
|
13 Page
Building European |
2018 December 3 Materials Building |
Construction & |
|
vk.com/id446425943
14Page |
|
2017-18 weather has been exceptionally unfavourable in the US |
|
|
|
|
|
|
|
|
|
|
|
|
|
|
|
|
|
|
|
|
|
|
|
|
|
|
|
|
|
|
|||||||||||||||||||||||||||||||||||||||
|
|
|
■ |
|
Weather impact on volumes in the US has been a recurring theme in 2017 and 2018. |
|
|
|
|
|
|
|
|
|
|
|
|
|
|
|
|
|
|
|
|
|
|
|
|
|
|
|
|||||||||||||||||||||||||||||||||||||||
|
|
|
|
■ |
|
Our analysis also confirms Q1 18 has been impacted by more freezing days than Q1 17 – however this was more due to exceptionally mild weather |
|||||||||||||||||||||||||||||||||||||||||||||||||||||||||||||||||
|
|
|
|
|
|
conditions in Q1 17 rather than particulary cold weather in Q1 18. |
|
|
|
|
|
|
|
|
|
|
|
|
|
|
|
|
|
|
|
|
|
|
|
|
|
|
|
|
|
|
|
|
|
|
|
|
|||||||||||||||||||||||||||||
|
|
|
|
■ |
|
This points as comps for Q1 19 in the US not as easy as investors might believe. |
|
|
|
|
|
|
|
|
|
|
|
|
|
|
|
|
|
|
|
|
|
|
|
|
|
|
|
|
|||||||||||||||||||||||||||||||||||||
|
|
|
|
■ |
|
Our analysis on each company’s US footprint shows however that 2017 and 2018 have seen exceptionally wet weather on all companies’ US footprints |
|||||||||||||||||||||||||||||||||||||||||||||||||||||||||||||||||
|
|
|
|
|
|
(mainly in Q3). |
|
|
|
|
|
|
|
|
|
|
|
|
|
|
|
|
|
|
|
|
|
|
|
|
|
|
|
|
|
|
|
|
|
|
|
|
|
|
|
|
|
|
|
|
|
|
|
|
|
|
|
|
|
|
|
|
|
|
|||||||
|
|
|
|
|
|
|
|
|
|
|
|
|
|
|
|
|
|
|
|
|
|
|
|
|
|
|
|
|
|
|
|
|
|
|
|
|
|
|
|
||||||||||||||||||||||||||||||||
|
|
Figure 23: 2017-17 have been exceptionally wet weather years on companies' US footprints |
|
|
|
|
|
|
|
|
|
|
|
|
|
|
|
|
|
|
|
|
|
|
|
|
|
|
|
||||||||||||||||||||||||||||||||||||||||||
|
|
|
|
|
|
|
|
|
|
|
|
|
|
# of freezing days |
|
|
|
|
|
|
# of days with preci > 15 |
|
|
|
# of days with preci > 25 |
|
|
|
|
# of days with preci > 35 |
|
|
|
||||||||||||||||||||||||||||||||||||||
|
|
Company |
|
|
|
|
2018 |
|
|
2017 |
|
Avg 30y |
|
|
2018 |
|
|
2017 |
|
|
Avg 30y |
|
|
|
2018 |
|
|
2017 |
|
|
Avg 30y |
|
2018 |
|
|
2017 |
|
Avg 30y |
|
||||||||||||||||||||||||||||||||
|
|
Buzzi |
|
|
|
|
|
|
|
|
22 |
|
|
|
|
15 |
|
|
|
|
21 |
|
|
|
67 |
|
|
|
63 |
|
|
56 |
|
|
|
|
|
42 |
|
|
|
40 |
|
|
|
33 |
|
|
|
|
28 |
|
|
|
|
27 |
|
|
|
|
20 |
|
|
|
|||||||
|
|
Cemex |
|
|
|
|
|
|
|
8 |
|
|
|
|
5 |
|
|
|
|
7 |
|
|
|
67 |
|
|
|
64 |
|
|
55 |
|
|
|
|
|
41 |
|
|
|
40 |
|
|
|
30 |
|
|
|
|
24 |
|
|
|
|
25 |
|
|
|
|
17 |
|
|
|
||||||||
|
|
CRH |
|
|
|
|
|
|
|
|
32 |
|
|
|
|
27 |
|
|
|
|
31 |
|
|
|
62 |
|
|
|
61 |
|
|
49 |
|
|
|
|
|
37 |
|
|
|
38 |
|
|
|
27 |
|
|
|
|
23 |
|
|
|
|
24 |
|
|
|
|
16 |
|
|
|
|||||||
|
|
Heidelberg |
|
|
|
|
|
21 |
|
|
|
|
17 |
|
|
|
|
21 |
|
|
|
63 |
|
|
|
61 |
|
|
52 |
|
|
|
|
|
40 |
|
|
|
38 |
|
|
|
30 |
|
|
|
|
26 |
|
|
|
|
25 |
|
|
|
|
17 |
|
|
|
||||||||||
|
|
LafargeHolcim |
|
|
|
30 |
|
|
|
|
22 |
|
|
|
|
29 |
|
|
|
68 |
|
|
|
66 |
|
|
54 |
|
|
|
|
|
42 |
|
|
|
41 |
|
|
|
31 |
|
|
|
|
27 |
|
|
|
|
28 |
|
|
|
|
18 |
|
|
|
||||||||||||
|
|
Titan |
|
|
|
|
|
|
|
|
12 |
|
|
|
|
8 |
|
|
|
|
11 |
|
|
|
107 |
|
|
|
85 |
|
|
73 |
|
|
|
|
|
63 |
|
|
|
51 |
|
|
|
38 |
|
|
|
|
35 |
|
|
|
|
31 |
|
|
|
|
20 |
|
|
|
|||||||
|
|
|
|
|
|
|
|
|
|
|
|
|
|
|
|
|
|
|
|
|
|
|
|
|
|
|
|
|
|
|
|
|
|
|
|
|
|
|
|
|
|
|
|
|
|
|
|
|
|
|
|
|
|
|
|
|
|
|
|
|
|
|
|||||||||
|
|
Source: Deutsche Bank, Bloomberg Finance LP |
|
|
|
|
|
|
|
|
|
|
|
|
|
|
|
|
|
|
|
|
|
|
|
|
|
|
|
|
|
|
|
|
|
|
|
|
|
|
|
|
|
|
|
|
|
|
|
|
|
|
|
|
|
|
|
|
|
||||||||||||
|
|
|
|
|
|
|
|
|
|
|
|
|
|
|
|
|
|
|
|
|
|
|
|
|
|
|
|
|
|
|
|
|
|
|
|
|
|
|
|
|
|
|
|
|
|
|
|
|
|
|
|
|
|
|
|
|
|
|
|||||||||||||
|
|
|
|
|
|
|
|
|
|
|
|
||||||||||||||||||||||||||||||||||||||||||||||||||||||||||||
|
|
|
|
|
|
|
|
|
|
|
|
||||||||||||||||||||||||||||||||||||||||||||||||||||||||||||
|
|
Figure 24: Average # of days with Temp below 0 degree on companies' |
|
Figure 25: Average # of days with precipitations > 25mm on companies' |
|||||||||||||||||||||||||||||||||||||||||||||||||||||||||||||||||||
|
|
US footprint |
|
|
|
|
|
|
|
|
|
|
|
|
|
|
|
|
|
|
|
|
|
|
|
|
|
|
|
|
US footprint |
|
|
|
|
|
|
|
|
|
|
|
|
|
|
|
|
|
|
|
|
|
|
|
|
|
|
|
|
||||||||||||
|
30 |
|
|
|
|
|
|
|
|
|
|
|
|
|
|
|
|
|
|
|
|
|
|
|
|
|
|
|
|
|
|
|
|
|
50 |
|
|
|
|
|
|
|
|
|
|
|
|
|
|
|
|
|
|
|
|
|
|
|
|
|
|
|
|
|
|
|
|
|
|
||
|
|
|
|
|
|
|
|
|
|
|
|
|
|
|
|
|
|
|
|
|
|
|
|
|
|
|
|
|
|
|
|
|
|
|
|
45 |
|
|
|
|
|
|
|
|
|
|
|
|
|
|
|
|
|
|
|
|
|
|
|
|
|
|
|
|
|
|
|
|
|
|
|
|
25 |
|
|
|
|
|
|
|
|
|
|
|
|
|
|
|
|
|
|
|
|
|
|
|
|
|
|
|
|
|
|
|
|
|
40 |
|
|
|
|
|
|
|
|
|
|
|
|
|
|
|
|
|
|
|
|
|
|
|
|
|
|
|
|
|
|
|
|
|
|
||
|
|
|
|
|
|
|
|
|
|
|
|
|
|
|
|
|
|
|
|
|
|
|
|
|
|
|
|
|
|
|
|
|
|
|
|
|
|
|
|
|
|
|
|
|
|
|
|
|
|
|
|
|
|
|
|
|
|
|
|
|
|
|
|
|
|
|
|
|
|
||
|
20 |
|
|
|
|
|
|
|
|
|
|
|
|
|
|
|
|
|
|
|
|
|
|
|
|
|
|
|
|
|
|
|
|
|
35 |
|
|
|
|
|
|
|
|
|
|
|
|
|
|
|
|
|
|
|
|
|
|
|
|
|
|
|
|
|
|
|
|
|
|
||
|
|
|
|
|
|
|
|
|
|
|
|
|
|
|
|
|
|
|
|
|
|
|
|
|
|
|
|
|
|
|
|
|
|
|
|
|
|
|
|
|
|
|
|
|
|
|
|
|
|
|
|
|
|
|
|
|
|
|
|
|
|
|
|
|
|
|
|
|
|
||
|
|
|
|
|
|
|
|
|
|
|
|
|
|
|
|
|
|
|
|
|
|
|
|
|
|
|
|
|
|
|
|
|
|
|
|
30 |
|
|
|
|
|
|
|
|
|
|
|
|
|
|
|
|
|
|
|
|
|
|
|
|
|
|
|
|
|
|
|
|
|
|
|
|
15 |
|
|
|
|
|
|
|
|
|
|
|
|
|
|
|
|
|
|
|
|
|
|
|
|
|
|
|
|
|
|
|
|
|
25 |
|
|
|
|
|
|
|
|
|
|
|
|
|
|
|
|
|
|
|
|
|
|
|
|
|
|
|
|
|
|
|
|
|
|
||
|
|
|
|
|
|
|
|
|
|
|
|
|
|
|
|
|
|
|
|
|
|
|
|
|
|
|
|
|
|
|
|
|
|
|
|
20 |
|
|
|
|
|
|
|
|
|
|
|
|
|
|
|
|
|
|
|
|
|
|
|
|
|
|
|
|
|
|
|
|
|
|
|
|
10 |
|
|
|
|
|
|
|
|
|
|
|
|
|
|
|
|
|
|
|
|
|
|
|
|
|
|
|
|
|
|
|
|
|
15 |
|
|
|
|
|
|
|
|
|
|
|
|
|
|
|
|
|
|
|
|
|
|
|
|
|
|
|
|
|
|
|
|
|
|
||
|
|
|
|
|
|
|
|
|
|
|
|
|
|
|
|
|
|
|
|
|
|
|
|
|
|
|
|
|
|
|
|
|
|
|
|
|
|
|
|
|
|
|
|
|
|
|
|
|
|
|
|
|
|
|
|
|
|
|
|
|
|
|
|
|
|
|
|
|
|
||
|
5 |
|
|
|
|
|
|
|
|
|
|
|
|
|
|
|
|
|
|
|
|
|
|
|
|
|
|
|
|
|
|
|
|
|
10 |
|
|
|
|
|
|
|
|
|
|
|
|
|
|
|
|
|
|
|
|
|
|
|
|
|
|
|
|
|
|
|
|
|
|
||
|
|
|
|
|
|
|
|
|
|
|
|
|
|
|
|
|
|
|
|
|
|
|
|
|
|
|
|
|
|
|
|
|
|
|
|
|
|
|
|
|
|
|
|
|
|
|
|
|
|
|
|
|
|
|
|
|
|
|
|
|
|
|
|
|
|
|
|
|
|
||
Deutsche |
|
|
|
1989 |
1990 |
1991 |
1992 |
1993 |
1994 |
1995 |
1996 |
1997 |
1998 |
1999 |
2000 |
2001 |
2002 |
2003 |
2004 |
2005 |
2006 |
2007 |
2008 |
2009 |
2010 |
2011 |
2012 |
2013 |
2014 |
2015 |
2016 |
2017 |
2018 |
|
5 |
|
1989 |
1990 |
1991 |
1992 |
1993 |
1994 |
1995 |
1996 |
1997 |
1998 |
1999 |
2000 |
2001 |
2002 |
2003 |
2004 |
2005 |
2006 |
2007 |
2008 |
2009 |
2010 |
2011 |
2012 |
2013 |
2014 |
2015 |
2016 |
2017 |
2018 |
|
|
|||
0 |
|
|
0 |
|
|
|
|||||||||||||||||||||||||||||||||||||||||||||||||||||||||||||||||
AG/London Bank |
|
Source: Deutsche Bank, Bloomberg Finance LP |
|
|
|
|
|
|
|
|
|
|
|
|
|
|
|
|
|
|
|
|
|
|
Source: Deutsche Bank, Bloomberg Finance LP |
|
|
|
|
|
|
|
|
|
|
|
|
|
|
|
|
|
|
|
|
|
|
||||||||||||||||||||||||
|
|
|
|
|
|
|
|
|
|
|
|
|
|
|
|
|
|
|
|
|
|
|
|
|
|
|
|
|
|
|
|
|
|
|
|
|
|
|
|
|
|
|
|
|
|||||||||||||||||||||||||||
|
|
|
|
|
|
|
|
|
|
|
|
|
|
|
|
|
|
|
|
|
|
|
|
|
|
|
|
|
|
|
|
|
|
|
|
|
|
|
|
|
|
|
|
|
|
|
|
|
|
|
|
|
|
|
|
|
|
|
|
|
|
|
|
|
|
|
|
|
|
|
|
|
|
|
|
|
|
|
|
|
|
|
|
|
|
|
|
|
|
|
|
|
|
|
|
|
|
|
|
|
|
|
|
|
|
|
|
|
|
|
|
|
|
|
|
|
|
|
|
|
|
|
|
|
|
|
|
|
|
|
|
|
|
|
|
|
|
|
|
|
|
|
|
Building European |
2018 December 3 Materials Building |
Construction & |
|

vk.com/id446425943
Deutsche |
|
■ |
Based on the last 30 years monthly analysis, we estimate that precipitations in Q3 have caused 3-6% cement demand loss on companies’ US footprints |
|||||||||||
|
3-6% volume upside on US footprints in case of weather normalization |
|
|
|
|
|||||||||
Bank |
|
|
vs. a more normalized weather pattern. |
|
|
|
|
|
|
|
|
|
||
|
|
|
|
|
|
|
|
|
|
|
|
|||
AG/London |
|
■ |
We believe Titan has been the most impacted with exceptionally wet weather in Florida and the Mid-Atlantic region in 2018. |
|||||||||||
|
|
|
|
|
|
|
|
|
|
|
|
|
|
|
|
Figure 26: Cement volumes lost in 2018 vs. ‘normalized’ weather conditions |
|
|
|
|
|
|
|||||||
|
|
|
|
|
|
|
|
|||||||
|
|
|
|
|
# of freezing days |
|
|
|
# of days with precip. > 25mm |
|
|
|
||
|
|
|
|
|
|
|
|
|
|
|
|
Total 2018 weather impact |
|
|
|
|
|
|
|
|
Impact cement demand |
|
|
|
|
Impact cement demand |
vs. 30y average on cement |
|
|
|
|
Company |
2018 |
30y avg |
freezing days |
|
|
2018 |
30y avg |
precipitations |
volumes |
|
|
|
|
|
Buzzi |
|
22 |
21 |
0.3% |
|
|
42 |
33 |
2.4% |
2.7% |
|
|
|
|
Cemex |
|
8 |
7 |
0.2% |
|
|
41 |
30 |
3.0% |
3.3% |
|
|
|
|
CRH |
|
32 |
31 |
0.2% |
|
|
37 |
27 |
2.5% |
2.7% |
|
|
|
|
Heidelberg |
21 |
21 |
0.0% |
|
|
40 |
30 |
2.7% |
2.7% |
|
|
|
|
|
LafargeHolcim |
30 |
29 |
0.2% |
|
|
42 |
31 |
2.9% |
3.1% |
|
|
|
|
|
Titan |
|
12 |
11 |
0.1% |
|
|
63 |
38 |
6.8% |
7.0% |
|
|
|
Source: Deutsche Bank estimates, Company data, Bloomberg Finance LP |
|
|
|
|
|
|
|
|
|
||||
|
|
|
|
|
|
|
|
|
|
|||||
|
|
|
|
|
|
|||||||||
|
|
|
|
|
|
|||||||||
|
|
Figure 27: Impact of freezing day on cement demand growth |
Figure 28: Impact of precipitations on cement demand growth: example |
|||||||||||
|
|
|
|
|
|
|
|
|
of Texas in Q3 |
|
|
|
|
|
|
|
|
|
|
|
|
|
|
|
|
|
|
|
|
|
|
|
|
|
40% |
|
|
|
|
|
|
|
|
|
|
20% |
|
|
|
|
|
|
|
|
|
|
|
|
|
|
|
|
|
|
|
|
|
|
|
|
|
|
|
(%) |
|
|
|
|
30% |
|
|
|
|
|
(%) |
|
|
|
|
15% |
|
2011 |
2004 |
|
|
|
|
|
|
|
|
|
|
|
|
|
|
|
|
|
|
|
|
|
|||
demand |
|
|
|
|
|
|
|
|
y = 0.9764x + 0.0265 |
demand |
|
|
|
|
10% |
|
|
|
|
|
|
|
|
|
|
|
|
|
|
R² = 0.4714 |
|
|
2006 |
|
|
|
2010 |
|
|
||||
|
|
|
|
20% |
|
|
|
|
|
|
|
|
|
|
|
||||||
|
|
|
|
|
|
|
|
|
|
|
|
|
|
|
|
2015 |
|
|
|||
|
|
|
|
|
|
|
|
|
|
|
|
|
|
|
2013 |
5% |
2007 |
2014 |
|
|
|
|
|
|
|
|
10% |
|
|
|
|
|
|
|
|
|
|
|
|
|
|||
|
|
|
|
|
|
|
|
|
|
|
|
|
|
|
|
|
|
|
|||
|
|
|
|
|
|
|
|
|
|
|
|
|
|
|
|
|
|
|
|
|
|
adj.YoYcement |
|
|
|
|
|
|
|
|
|
|
adj.YoYcement |
|
|
|
|
0% |
|
|
|
|
|
|
|
|
|
0% |
|
|
|
|
|
|
|
|
|
-20% |
|
|
|
|
|
||
|
-40% |
-30% |
-20% |
-10% |
0% |
10% |
20% |
30% |
40% |
50% |
|
-40% |
-30% |
-20% |
-10% |
-5% 0% |
|
|
10% |
20% |
30% |
|
|
|
|
|
-10% |
|
|
|
|
|
|
y = 0.4944x - 0.001 |
|
2017 |
2016 |
|
|
|
|
||
|
|
|
|
|
|
|
YoY freezing days impact (%) |
|
|
|
|
|
|
|
|
|
|||||
|
|
|
|
|
|
|
|
|
|
|
|
|
R² = 0.4928 |
|
2012 |
-10% |
2008 |
|
|
||
|
|
|
|
|
-20% |
|
|
|
|
|
|
|
|
|
|
|
YoY precipitations > 25mm |
||||
|
|
|
|
|
|
|
|
|
|
|
|
|
|
|
-15% |
2005 |
|
||||
|
|
|
|
|
|
|
|
|
|
|
|
|
|
|
|
|
impact (%) |
|
|
||
|
|
|
|
|
-30% |
|
|
|
|
|
|
|
|
|
|
|
|
|
|
|
|
|
|
|
|
|
|
|
|
|
|
|
|
|
|
|
|
|
|
|
|
|
|
|
|
|
|
|
-40% |
|
|
|
|
|
|
|
2018 |
|
|
|
|
|
|
|
|
|
|
|
|
|
|
|
|
|
|
|
|
|
|
|
-25% |
|
|
|
|
|
|
|
|
|
|
|
|
|
|
|
|
|
|
|
|
|
|
|
|
|
|
|
|
Source: Deutsche Bank, Bloomberg Finance LP |
|
|
|
|
|
|
Source: Deutsche Bank, Bloomberg Finance LP |
|
|
|
|
|
|
|
|||||||
15 Page
Building European |
2018 December 3 Materials Building |
Construction & |
|
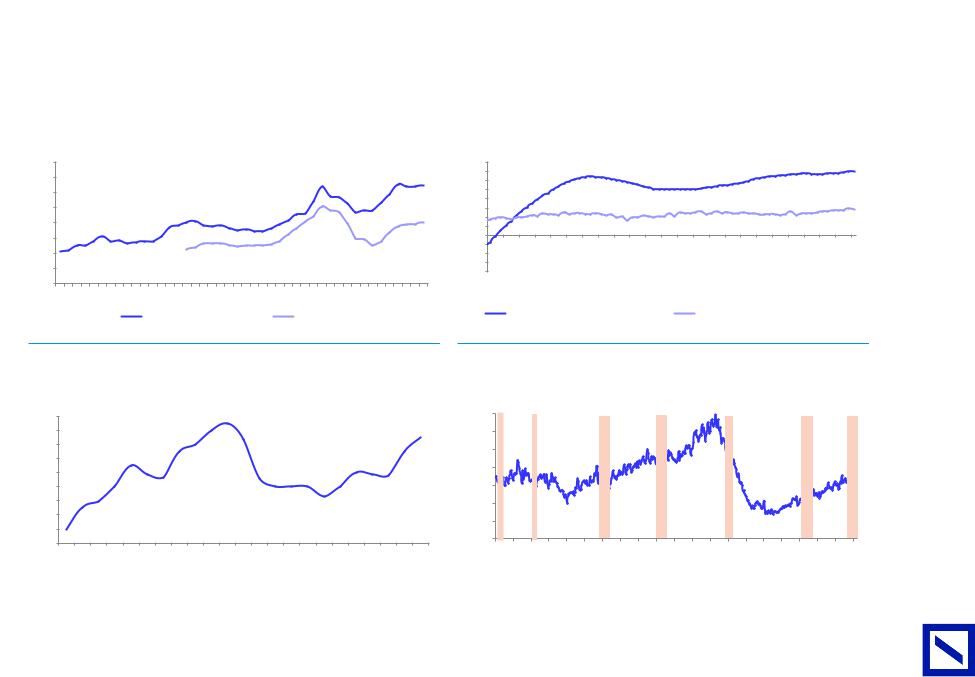
vk.com/id446425943
16 Page |
But concerns are mounting on the sustainability of US housing |
|
|
|
|||||||||||||||||||||||
■ |
Driven by home price inflation well above wage increase, US housing a ordability has consistently deteriorated since 2012. |
|
|
||||||||||||||||||||||||
|
■ |
This has notably translated into an increase of high-risk mortgages (defined as DTI > 42%) almost back to 2007 peak. |
|
|
|||||||||||||||||||||||
|
■ |
In a context of (i) rising interests rates (ii) continued spread between house price inflation vs. wage increase and (iii) limited room for high-risks |
|||||||||||||||||||||||||
|
|
mortgage increase, we see risks that housing slowdown could continue and even amplify next year. |
|
|
|
||||||||||||||||||||||
|
Figure 29: A ordability based on median home prices by median |
|
|
|
Figure 30: House price growth vs. wage growth gap gets wider |
|
|||||||||||||||||||||
|
household income, since 1974 |
|
|
|
|
|
|
|
|
|
|
|
|
|
|
|
|
|
|
||||||||
|
6.0 |
|
|
|
|
|
|
|
|
|
|
|
|
|
|
|
|
|
|
|
|
|
|
8% |
|
|
7.0% |
|
|
|
|
|
|
|
|
|
|
|
|
|
|
|
|
|
|
|
|
|
|
|
|
7% |
|
|
|
|
5.5 |
|
|
|
|
|
|
|
|
|
|
|
|
|
|
|
|
|
|
|
|
|
5.2 |
|
|
|
|
|
|
|
|
|
|
|
|
|
|
|
|
|
|
|
5.2 |
|
|
|
|
|
|
6% |
|
|
|
||
|
|
|
|
|
|
|
|
|
|
|
|
|
|
|
|
|
|
|
|
|
|
|
|
|
|
||
|
5.0 |
|
|
|
|
|
|
|
|
|
|
|
|
|
|
|
|
|
|
|
|
|
|
5% |
|
|
|
|
|
|
|
|
|
|
|
|
|
|
|
|
|
|
|
|
|
|
|
|
|
|
4% |
|
|
|
|
|
|
|
|
|
|
|
|
|
|
|
|
|
|
|
|
|
|
|
|
|
|
|
|
|
|
2.8% |
|
|
4.5 |
|
|
|
|
|
|
|
|
|
|
|
|
|
|
|
|
|
|
|
|
|
|
3% |
|
|
|
|
|
|
|
|
|
|
|
|
|
|
|
|
|
|
|
|
|
|
|
|
|
|
|
|
|
||
|
4.0 |
|
|
|
|
|
|
|
|
|
|
|
|
|
|
|
|
|
|
|
|
|
|
2% |
|
|
|
|
|
|
|
|
|
|
|
|
|
|
|
|
|
|
|
|
|
|
|
|
|
|
1% |
|
|
|
|
|
|
|
|
|
|
|
|
|
|
|
|
|
|
|
|
|
|
|
|
|
|
|
|
|
|
|
|
|
3.5 |
|
|
|
|
|
|
|
|
|
|
|
|
|
|
|
|
|
|
|
|
|
|
0% |
|
|
|
|
|
|
|
|
|
|
|
|
|
|
|
|
|
|
|
|
|
|
|
|
|
|
-1% |
|
|
|
|
|
|
|
|
|
|
|
|
|
|
|
|
|
|
|
|
|
|
|
|
|
|
|
|
|
|
|
|
|
3.0 |
|
|
|
|
|
|
|
|
|
|
|
|
|
|
|
|
|
|
|
|
|
|
-2% |
|
|
|
|
2.5 |
|
|
|
|
|
|
|
|
|
|
|
|
|
|
|
|
|
|
|
|
|
|
-3% |
|
|
|
|
|
|
|
|
|
|
|
|
|
|
|
|
|
|
|
|
|
|
|
|
|
|
-4% |
|
|
|
|
|
|
|
|
|
|
|
|
|
|
|
|
|
|
|
|
|
|
|
|
|
|
|
|
Dec-15 Mar-16 Jun-16 Sep-16 Dec-16 Mar-17 Jun-17 Sep-17 Dec-17 |
|
|
|
|
2.0 |
|
|
|
|
|
|
|
|
|
|
|
|
|
|
|
|
|
|
|
|
|
|
Dec-12 Mar-13 Jun-13 Sep-13 Dec-13 Mar-14 Jun-14 Sep-14 Dec-14 Mar-15 Jun-15 Sep-15 |
Mar-18 Jun-18 |
Sep-18 |
|
|
1974 |
1976 |
1978 |
1980 |
1982 |
1984 |
1986 |
1988 |
1990 |
1992 |
1994 |
1996 |
1998 |
2000 |
2002 |
2004 |
2006 |
2008 |
2010 |
2012 |
2014 |
2016 |
|
||||
|
|
|
|
|
|
New Home |
|
|
|
|
|
|
Existing Home |
|
|
|
|
|
US median home price increase (Zillow) |
Private industry weekly wages |
increase |
|
|||||
|
|
|
|
|
|
|
|
|
|
|
|
|
|
|
|
|
|
|
|
|
|||||||
|
Source: Deutsche Bank, US Census, NAR, Haver |
|
|
|
|
|
|
|
|
|
|
|
|
|
|
|
Source: Deutsche Bank, Zillow, US Census |
|
|
|
|||||||
|
Figure 31: Approx. 40% of GSE loans have DTI ratios above 42% |
|
|
Figure 32: New Home Sales dip in periods of increasing mortgage rates |
|||||||||||||||||||||||||||||||||||||||
|
|
|
|
|
|
|
|
|
|
|
|
|
|
|
|
|
|
|
|
|
|
|
in the "Danger Zone" |
|
|
|
|
|
|
|
|
|
|
|
|
|
|
|
|||||
|
45% |
|
|
|
|
|
|
|
|
43% |
|
|
|
|
|
|
|
|
|
|
|
|
1,400 |
|
|
|
|
|
|
|
|
|
|
|
|
|
|
|
|
|
|
|
|
|
40% |
|
|
|
|
|
|
|
|
|
|
|
|
|
|
|
|
|
|
|
|
38% |
1,200 |
|
|
|
|
|
|
|
|
|
|
|
|
|
|
|
|
|
|
|
|
|
|
|
|
|
|
|
|
|
|
|
|
|
|
|
|
|
|
|
|
|
|
|
|
|
|
|
|
|
|
|
|
|
|
|
|
|
|
|
|
|
|||
|
35% |
|
|
|
|
|
|
|
|
|
|
|
|
|
|
|
|
|
|
|
|
|
1,000 |
|
|
|
|
|
|
|
|
|
|
|
|
|
|
|
|
|
|
|
|
|
|
|
|
|
|
|
|
|
|
|
|
|
|
|
|
|
|
|
|
|
|
|
|
|
|
|
|
|
|
|
|
|
|
|
|
|
|
|
|
|
|
||
|
30% |
|
|
|
|
|
|
|
|
|
|
|
|
|
|
|
|
|
|
|
|
|
|
|
|
|
|
|
|
|
|
|
|
|
|
|
|
|
|
|
|
|
|
|
25% |
|
|
|
|
|
|
|
|
|
|
|
|
|
|
|
|
|
|
|
|
|
800 |
|
|
|
|
|
|
|
|
|
|
|
|
|
|
|
|
|
|
|
|
|
|
|
|
|
|
|
|
|
|
|
|
|
|
|
|
|
|
|
|
|
|
|
|
|
|
|
|
|
|
|
|
|
|
|
|
|
|
|
|
|
|
||
|
20% |
|
|
|
|
|
|
|
|
|
|
|
|
|
|
|
|
|
|
|
|
|
600 |
|
|
|
|
|
|
|
|
|
|
|
|
|
|
|
|
|
|
|
|
|
15% |
|
|
|
|
|
|
|
|
|
|
|
|
|
|
|
|
|
|
|
|
|
400 |
|
|
|
|
|
|
|
|
|
|
|
|
|
|
|
|
|
|
|
|
|
|
|
|
|
|
|
|
|
|
|
|
|
|
|
|
|
|
|
|
|
|
|
|
|
|
|
|
|
|
|
|
|
|
|
|
|
|
|
|
|
|
||
|
10% |
|
|
|
|
|
|
|
|
|
|
|
|
|
|
|
|
|
|
|
|
|
200 |
|
|
|
|
|
|
|
|
|
|
|
|
|
|
|
|
|
|
|
|
|
|
|
|
|
|
|
|
|
|
|
|
|
|
|
|
|
|
|
|
|
|
|
|
|
|
|
|
|
|
|
|
|
|
|
|
|
|
|
|
|
|
||
|
5% |
|
|
|
|
|
|
|
|
|
|
|
|
|
|
|
|
|
|
|
|
|
|
|
|
|
|
|
|
|
|
|
|
|
|
|
|
|
|
|
|
|
|
Deutsche |
0% |
|
|
|
|
|
|
|
|
|
|
|
|
|
|
|
|
|
|
|
|
|
0 |
Bank, US Census,Apr-89 |
FactsetOct-92 |
Jul-94 |
Apr-96 |
|
Oct-99 |
Jul-01 |
Apr-03 |
|
Oct-06 |
Jul-08 |
Apr-10 |
|
Oct-13 |
Jul-15 |
Apr-17 |
|
|||
Bank,1998 |
AEI |
2000 |
2001 |
2002 |
2003 |
2004 |
2005 |
2006 |
2007 |
2008 |
2009 |
2010 |
2011 |
2012 |
2013 |
2014 |
2015 |
2016 |
2017 |
2018 |
Source: DeutscheJan-84 |
Jan-98 |
Jan-05 |
Jan-12 |
Jan-19 |
||||||||||||||||||
Source: Deutsche1996 |
|||||||||||||||||||||||||||||||||||||||||||
|
1997 |
1999 |
|
|
|
|
|
|
|
|
|
|
|
|
|
|
|
|
|
|
|
Oct85- |
Jul87- |
Jan91- |
|
|
|
|
|
|
|
|
|
|
|
|
|
|
|
||||
AG/London Bank |
|
|
|
|
|
|
|
|
|
|
|
|
|
|
|
|
|
|
|
|
|
|
|
|
|
|
|
|
|
|
|
|
|
|
|
|
|
|
|
|
|
|
|
Building European |
2018 December 3 Materials Building |
Construction & |
|

vk.com/id446425943 |
|
|
|
|
|
|
|
|
|
|
|
|
|
|
|
|
|
|
||||
Deutsche |
But concerns are mounting on the sustainability of US housing - continued |
|
|
|
|
|
|
|
|
|||||||||||||
|
|
|
|
|
|
|
|
|
||||||||||||||
Bank |
|
■ |
Historically, housing sales have slowed down or dipped in a rising interests rates environment while US Building Materials stocks have derated. |
|||||||||||||||||||
Figure 33: Change (bps) in US Borrowing Rates - 30Y Mortgage vs. 10Y |
Figure 34: US building mats 12m forward P/E dipping during the |
|
||||||||||||||||||||
|
|
|||||||||||||||||||||
AG/London |
US Treasury |
|
|
|
|
|
|
|
|
|
|
"Danger Zone" |
|
|
|
|
|
|
|
|
||
changemonthlyin rates |
(bps)-4 |
|
|
|
|
|
|
|
|
|
|
|
|
|
|
|
|
|
|
|
|
|
|
|
10 |
|
|
|
|
|
|
|
|
|
|
|
40 |
|
|
|
|
|
|
|
|
|
|
8 |
|
|
|
|
|
|
DANGER |
|
|
|
|
|
|
|
|
|
|
|
|
|
|
|
6 |
|
|
|
|
|
|
|
|
|
|
|
35 |
|
|
|
|
|
|
|
|
|
|
4 |
|
|
|
|
|
|
|
|
|
|
|
30 |
|
|
|
|
|
|
|
|
|
|
2 |
|
|
|
|
|
|
|
|
|
|
|
25 |
|
|
|
|
|
|
|
|
|
|
|
|
|
|
|
|
|
|
|
|
|
|
|
|
|
|
|
|
|
|
|
|
|
0 |
|
|
|
|
|
|
|
|
|
|
|
20 |
|
|
|
|
|
|
|
|
|
|
-2 |
|
|
|
|
|
|
|
|
|
|
|
|
|
|
|
|
|
|
|
|
|
|
|
|
|
|
|
|
|
|
|
|
|
|
|
|
|
|
|
|
|
|
|
|
|
|
|
|
|
|
|
|
|
|
|
|
|
15 |
|
|
|
|
|
|
|
|
|
Annual |
-6 |
|
|
|
|
|
|
|
|
|
|
|
10 |
|
|
|
|
|
|
|
|
|
-8 |
|
|
|
|
|
|
|
|
|
|
|
5 |
|
|
|
|
|
|
|
|
|
|
|
|
|
|
|
|
|
|
|
|
|
|
|
|
|
|
|
|
|
|
||
|
|
|
|
|
|
|
|
|
|
|
|
|
|
|
|
|
|
|
|
|
|
|
|
|
-10 |
|
Jul-12 |
|
|
|
Jul-15 |
|
|
|
Jul-18 |
|
0 |
|
|
|
|
|
|
|
|
|
|
Jan-11 |
Oct-11 |
Apr-13 |
Jan-14 |
Oct-14 |
Apr-16 |
Jan-17 |
Oct-17 |
Apr-19 |
|
|
|
|
|
|
|
Feb-18 Jan-19 |
||||
|
|
Jan-97 Dec-97 Nov-98 Oct-99 Sep-00 Aug-01 Jul-02 |
Jun-03 |
May-04 Apr-05 Mar-06 |
Feb-07 Jan-08 Dec-08 Nov-09 Oct-10 |
Sep-11 |
Aug-12 Jul-13 |
Jun-14 |
May-15 Apr-16 Mar-17 |
|||||||||||||
|
|
|
|
10Y UST Yield |
|
|
|
30Y Mortgage Rate |
|
|
|
|
|
|
|
|
|
|
|
|||
|
Source: Deutsche Bank, Bloomberg Finance LP. Note: DB ests for 10Y Yields and Policy rates |
|
|
|
|
Source: Deutsche Bank, Factset. Notes: VMC+MLM proxy for US building mats sector |
|
|
|
|
|
|||||||||||
17 Page
Building European |
2018 December 3 Materials Building |
Construction & |
|
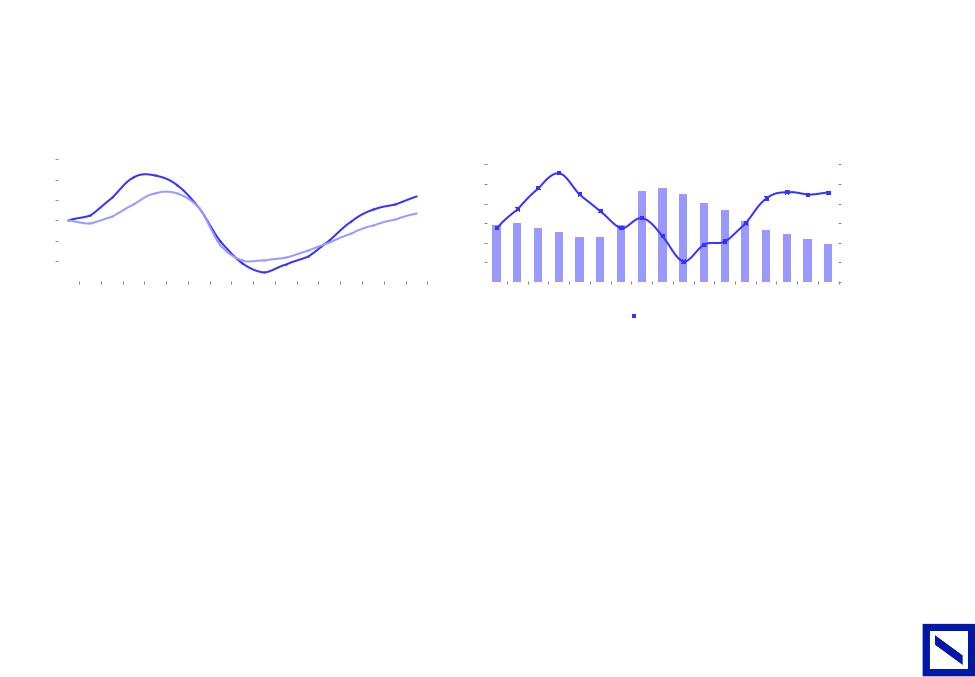
vk.com/id446425943
18 Page |
Labour shortage could constrain US construction growth pattern |
|
|
|
|
|
|
|
|
|
|
|
|
|
|
|
|
|
|
|
|
|||||||||||||||||||||||||
■ |
Our analysis shows that the productivity of the US construction industry (defined by the construction put in place in USD constant terms by construction |
|||||||||||||||||||||||||||||||||||||||||||||
|
|
|
|
worker) has almost reached 2005 peak and is stagnating since 3 years. |
|
|
|
|
|
|
|
|
|
|
|
|
|
|
|
|
|
|
|
|
|
|||||||||||||||||||||
|
■ |
In the same time, a very tight labor market should constrain additional workers employment. |
|
|
|
|
|
|
|
|
|
|
|
|
|
|
|
|
|
|||||||||||||||||||||||||||
|
■ |
In this context, we see limited scope for significant upside for the US construction market. |
|
|
|
|
|
|
|
|
|
|
|
|
|
|
|
|
|
|
||||||||||||||||||||||||||
|
|
|
|
|
|
|
|
|
|
|
|
|
|
|
|
|||||||||||||||||||||||||||||||
|
Figure 35: Resi still well below peak and # construction workers too |
|
Figure 36: But productivity of construction workers is close to peak |
|
|
|
||||||||||||||||||||||||||||||||||||||||
|
|
|
|
|
|
|
|
|
|
|
|
|
|
|
|
|
|
|
|
|
|
|
while labor market is very tight |
|
|
|
|
|
|
|
|
|
|
|
|
|
||||||||||
|
130 |
|
|
|
|
|
|
122 |
|
|
|
|
|
|
|
|
|
|
|
|
|
260 |
|
|
|
|
256 |
|
|
|
|
|
|
|
|
|
|
|
|
|
|
|
12% |
|
||
|
|
|
|
|
|
|
|
|
|
|
|
|
|
|
|
|
|
|
|
|
|
|
|
|
|
|
|
|
|
|
|
|
|
|
|
|
|
|
||||||||
|
120 |
|
|
|
|
|
|
|
|
|
|
|
|
|
|
|
|
|
|
|
|
|
|
|
|
|
|
|
|
|
|
|
|
|
|
|
|
|
|
|
||||||
|
|
|
|
|
|
|
114 |
|
|
|
|
|
|
|
|
|
|
|
112 |
|
250 |
|
|
|
|
|
|
|
|
|
|
|
|
|
|
|
|
|
|
|
246 |
10% |
|
|||
|
|
|
|
|
|
|
|
|
|
|
|
|
|
|
|
|
|
|
|
|
|
|
|
|
|
|
|
|
|
|
|
|
|
|
|
|
|
|
|
|||||||
|
|
|
|
|
|
|
|
|
|
|
|
|
|
|
|
|
|
|
|
|
|
|
|
|
|
|
|
|
|
|
|
|
|
|
|
|
|
|
|
|
|
|
|
|||
|
110 |
|
|
|
|
|
|
|
|
|
|
|
|
|
|
|
|
|
|
|
|
240 |
|
|
|
|
|
|
|
|
|
|
|
|
|
|
|
|
|
|
|
|
8% |
|
||
|
|
|
|
|
|
|
|
|
|
|
|
|
|
|
|
|
|
|
|
|
|
|
|
|
|
|
|
|
|
|
|
|
|
|
|
|
|
|
|
|
|
|
||||
|
100 |
|
|
|
|
|
|
|
|
|
|
|
|
|
|
|
|
|
|
104 |
230 |
|
|
|
|
|
|
|
|
|
|
|
|
|
|
|
|
|
|
|
|
6% |
|
|||
|
|
|
|
|
|
|
|
|
|
|
|
|
|
|
|
|
|
|
|
|
|
|
|
|
|
|
|
|
|
|
|
|
|
|
|
|
|
|
|
|
||||||
|
90 |
|
|
|
|
|
|
|
|
|
|
|
|
|
|
|
|
|
|
|
|
220 |
|
|
|
|
|
|
|
|
|
|
|
|
|
|
|
|
|
|
|
|
4% |
|
||
|
|
|
|
|
|
|
|
|
|
|
|
|
|
|
|
|
|
|
|
|
|
|
|
|
|
|
|
|
|
|
|
|
|
|
|
|
|
|
|
|
|
|
||||
|
80 |
|
|
|
|
|
|
|
|
|
|
|
|
|
|
|
|
|
|
|
|
210 |
|
|
|
|
|
|
|
|
|
|
|
|
|
|
|
|
|
|
|
|
2% |
|
||
|
70 |
|
|
|
|
|
|
|
|
|
|
|
|
|
|
|
|
|
|
|
|
200 |
|
|
|
|
|
|
|
|
|
|
|
|
|
|
|
|
|
|
|
|
|
0% |
|
|
|
2002 |
2003 |
2004 |
2005 |
2006 |
2007 |
2008 |
2009 |
2010 |
2011 |
2012 |
2013 |
2014 |
2015 |
2016 |
2017 |
2018 |
|
2002 |
2003 |
2004 |
2005 |
2006 |
2007 |
2008 |
|
|
2009 |
2010 |
2011 |
2012 |
2013 |
2014 |
2015 |
2016 |
2017 |
2018 |
|
|
|
||||||
|
|
|
|
|
|
Construciton spend (2018 USD) |
|
|
|
# construction employees |
|
|
|
|
|
|
|
Unemployment rate (rhs) |
|
|
|
|
USD construction spend per employee (2018 USD, lhs) |
|||||||||||||||||||||||
|
|
|
|
|
|
|
|
|
|
|
|
|
|
|
|
|
|
|
|
|||||||||||||||||||||||||||
|
Source: Deutsche Bank, US Census, Factset |
|
|
|
|
|
|
|
|
|
|
|
|
|
|
Source: Deutsche Bank, US Census, Factset |
|
|
|
|
|
|
|
|
|
|
|
|
|
|
|
|
|
|||||||||||||
|
|
|
|
|
|
|
|
|
|
|
|
|
|
|
|
|
|
|
|
|
|
|
|
|
|
|
|
|
|
|
|
|||||||||||||||
|
|
|
|
|
|
|
|
|
|
|
|
|
|
|
|
|
|
|
|
|
|
|
|
|
|
|
|
|
|
|
|
|
|
|
|
|
|
|
|
|
|
|
|
|
|
|
AG/London Bank Deutsche
Building European |
2018 December 3 Materials Building |
Construction & |
|

vk.com/id446425943
Deutsche |
Europe: New-build weakening but renovation more resilient |
|||||
Where are we in the cycle? |
|
|
|
|||
Bank |
■ |
We see three groups of countries in Europe at di erent stages of the construction cycle. |
||||
|
||||||
AG/London |
|
■ |
Southern Europe countries, Ireland and to a lesser extent France are still well below mid-cycle levels (defined as the average of 2000-17 cement |
|||
|
|
The UK, Benelux, Denmark and Germany are close to mid-cycle levels. |
||||
|
|
|
demand). |
|
|
|
|
|
■ |
|
|
|
|
|
|
■ |
Finally Scandinavia and esp. Sweden and Norway 2018 levels are well above mid-cycle and have already started a phase of demand normalization. |
|||
|
■ |
This reflects into higher upside to mid-cycle for companies with high exposure to South Europe (Titan, Buzzi, Cemex) vs. the most exposed to the |
||||
|
|
UK, Germany and Scandinavia (Heidelberg and CRH). |
|
|
|
|
|
|
|
|
|
||
|
Figure 37:Upside to mid-cycle vs. 2018 level by country (2000-17 |
|
Figure 38:Upside to mid-cycle vs. 2018 level by company (2000-17 |
|||
|
average) |
|
|
average) |
||
120% |
220% |
164% |
|
|
|
|
|
|
40% |
87% |
100% |
|
|
|
|
|
|
||||
|
83% |
|
|
|
|
|
|
|
|
|
80% |
|
|
|
|
|
|
|
35% |
|
|
|
|
|
|
|
|
|
|
|
||
60% |
|
57% |
|
|
|
|
|
|
30% |
|
|
|
|
|
|
|
|
|
|
||
|
|
|
|
|
|
|
|
|
|
|
40% |
|
15% |
|
|
|
|
|
|
|
|
20% |
|
3% |
0% |
|
|
|
|
25% |
|
|
|
|
|
|
|
|
|
|
|||
0% |
|
|
|
|
|
|
|
|
20% |
|
-20% |
|
|
|
-2% |
-2% |
-5% |
-7% |
|
15% |
13% |
-40% |
|
|
|
|
|
|
-18% |
-19% |
10% |
|
|
|
|
|
|
|
|
||||
|
|
|
|
|
|
|
|
|
Greece |
Spain |
Italy |
Ireland |
France |
Benelux |
Denmark |
Germany |
KingdomUnited |
Switzerland |
Finland |
Sweden |
Norway |
10% |
|
|
|
5% |
|
|
|
|
|
|
|
|
|
|
|
|
|
|
|
|
|
|
|
|
|
|
|
|||
|
|
|
|
|
|
|
|
|
|
|
|
|
|
|
|
|
|
|
|
|
|
|
|
|
|
|
|
|
|
|
|
|
|
|
5% |
|
|
|
|
3% |
1% |
|
|
|
|
|
|
|
|
|
|
|
|
|
|
|
|
|
|
|
|
|
|
|
|
|
|
|
|
|
|
|
|
|
|
|
|
|
0% |
|
|
|
|
|
|
|
|
|
|
|
|
|
|
|
|
|
|
|
|
|
Titan |
Buzzi |
Cemex |
LafargeHolcim |
Heidelberg |
CRH |
|
||
|
|
|
|
|
|
|
|
|
|
|
|
|
|
|
|
||||||
Source: Deutsche Bank estimate, Factset, Euroconstruct |
|
|
|
|
|
|
|
|
Source: Deutsche Bank estimate, Company data |
|
|
|
|
|
|||||||
|
|
|
|
|
|
|
|
|
|
|
|
|
|||||||||
|
|
|
|
|
|
|
|
|
|
|
|
|
|
|
|
|
|
|
|
|
|
19 Page
Building European |
2018 December 3 Materials Building |
Construction & |
|
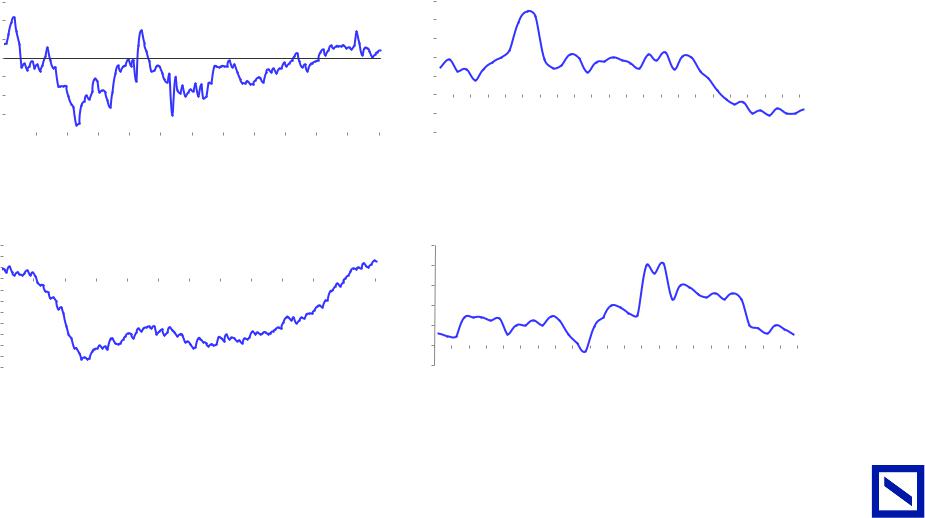
vk.com/id446425943
20Page |
|
European residential new-build data have weakened through 2018 |
|
|
|
|
|
|
|
|
|
|
|
|
|
|
|
|
|
|
|
|
|
|
|||||||||||||||||||||||
|
■ |
In spite of a resilient construction PMI and construction confidence evolution index, residential building permits have started to weaken since end |
|||||||||||||||||||||||||||||||||||||||||||||
|
|
|
|
|
of 2017 in Europe. |
|
|
|
|
|
|
|
|
|
|
|
|
|
|
|
|
|
|
|
|
|
|
|
|
|
|
|
|
|
|
|
|
|
|
|
|
|
|
|
|
||
|
|
■ |
In Western Europe (France, Germany, Benelux, Spain, Italy, UK and Scandinavia) 12m trailing building permits YoY change are now in negative |
||||||||||||||||||||||||||||||||||||||||||||
|
|
|
|
|
territories since May 18 |
|
|
|
|
|
|
|
|
|
|
|
|
|
|
|
|
|
|
|
|
|
|
|
|
|
|
|
|
|
|
|
|
|
|
|
|
|
|
|
|||
|
|
■ |
Eastern Europe 12m trailing building permits (Poland, Romania and Czech Republic) are still up YoY but at a slower pace vs. H2 17 / H1 18. |
|
|
|
|
||||||||||||||||||||||||||||||||||||||||
|
|
|
|
|
|
|
|
|
|
|
|
|
|
|
|
|
|
|
|
|
|||||||||||||||||||||||||||
|
|
Figure 39: European construction PMI |
|
|
|
|
|
|
|
|
|
Figure 40: 12m trailing YoY building permits growth in Western Europe |
|||||||||||||||||||||||||||||||||||
|
65 |
|
|
|
|
|
|
|
|
|
|
|
|
|
|
|
|
25% |
|
|
|
|
|
|
|
|
|
|
|
|
|
|
|
|
|
|
|
|
|
|
|
|
|
|
|
||
|
|
|
|
|
|
|
|
|
|
|
|
|
|
|
|
|
|
|
|
|
|
|
|
|
|
|
|
|
|
|
|
|
|
|
|
|
|
|
|
|
|
||||||
|
60 |
|
|
|
|
|
|
|
|
|
|
|
|
|
|
|
|
20% |
|
|
|
|
|
|
|
|
|
|
|
|
|
|
|
|
|
|
|
|
|
|
|
|
|
|
|
||
|
55 |
|
|
|
|
|
|
|
|
|
|
|
|
|
|
|
|
15% |
|
|
|
|
|
|
|
|
|
|
|
|
|
|
|
|
|
|
|
|
|
|
|
|
|
|
|
||
|
50 |
|
|
|
|
|
|
|
|
|
|
|
|
|
|
|
|
10% |
|
|
|
|
|
|
|
|
|
|
|
|
|
|
|
|
|
|
|
|
|
|
|
|
|
|
|
||
|
45 |
|
|
|
|
|
|
|
|
|
|
|
|
|
|
|
|
5% |
|
|
|
|
|
|
|
|
|
|
|
|
|
|
|
|
|
|
|
|
|
|
|
|
|
|
|
||
|
40 |
|
|
|
|
|
|
|
|
|
|
|
|
|
|
|
|
0% |
|
|
|
|
|
|
|
|
|
|
|
|
|
|
|
|
|
|
|
|
|
|
|
|
|
|
|
||
|
|
|
|
|
|
|
|
|
|
|
|
|
|
|
|
|
|
|
|
|
|
|
|
|
|
|
|
|
|
|
|
|
|
|
|
|
|
|
|
|
|
||||||
|
35 |
|
|
|
|
|
|
|
|
|
|
|
|
|
|
|
|
-5% |
|
|
|
|
|
|
|
|
|
|
|
|
|
|
|
|
|
|
|
|
|
|
|
|
|
|
|
||
|
30 |
|
|
|
|
|
|
|
|
|
|
|
|
|
|
|
|
-10% |
|
|
Mar-15 |
May-15 |
Jul-15 |
Sep-15 |
Nov-15 |
Jan-16 |
Mar-16 |
May-16 |
Jul-16 |
Sep-16 |
Nov-16 |
Jan-17 |
Mar-17 |
May-17 |
Jul-17 |
Sep-17 |
Nov-17 |
Jan-18 |
Mar-18 |
May-18 |
Jul-18 |
Sep-18 |
|||||
|
|
|
|
OCT-06 |
OCT-07 |
OCT-08 |
OCT-09 |
OCT-10 |
OCT-11 |
OCT-12 |
OCT-13 |
OCT-14 |
OCT-15 |
OCT-16 |
OCT-17 |
OCT-18 |
|
|
|
|
|||||||||||||||||||||||||||
|
|
Source: Deutsche Bank, Haver |
|
|
|
|
|
|
|
|
|
|
|
|
|
Source: Deutsche Bank, Datastream, Haver |
|
|
|
|
|
|
|
|
|
|
|
|
|
|
|
|
|
|
|
||||||||||||
|
|
|
|
|
|
|
|
|
|
|
|
|
|
|
|
|
|
|
|
|
|
|
|
|
|
|
|
|
|
|
|
|
|
||||||||||||||
|
|
|
|
|
|
|
|
|
|
|
|
|
|
|
|
|
|||||||||||||||||||||||||||||||
|
|
|
|
|
|
|
|
|
|
|
|
|
|
|
|
|
|||||||||||||||||||||||||||||||
|
|
Figure 41: European construction confidence |
|
|
|
|
|
|
|
|
Figure 42: 12m trailing YoY building permits growth in Eastern Europe |
||||||||||||||||||||||||||||||||||||
|
15 |
|
|
|
|
|
|
|
|
|
|
|
|
|
|
|
|
25% |
|
|
|
|
|
|
|
|
|
|
|
|
|
|
|
|
|
|
|
|
|
|
|
|
|
|
|
||
|
|
|
|
|
|
|
|
|
|
|
|
|
|
|
|
|
|
|
|
|
|
|
|
|
|
|
|
|
|
|
|
|
|
|
|
|
|
|
|
|
|
|
|||||
|
10 |
|
|
|
|
|
|
|
|
|
|
|
|
|
|
|
|
|
|
|
|
|
|
|
|
|
|
|
|
|
|
|
|
|
|
|
|
|
|
|
|
|
|
|
|
|
|
|
5 |
|
|
|
|
|
|
|
|
|
|
|
|
|
|
|
|
20% |
|
|
|
|
|
|
|
|
|
|
|
|
|
|
|
|
|
|
|
|
|
|
|
|
|
|
|
||
|
0 |
|
|
|
|
|
|
|
|
|
|
|
|
|
|
|
|
15% |
|
|
|
|
|
|
|
|
|
|
|
|
|
|
|
|
|
|
|
|
|
|
|
|
|
|
|
||
|
|
|
|
|
|
|
|
|
|
|
|
|
|
|
|
|
|
|
|
|
|
|
|
|
|
|
|
|
|
|
|
|
|
|
|
|
|
|
|
|
|
|
|
||||
|
-5 |
|
|
|
|
|
|
|
|
|
|
|
|
|
|
|
|
|
|
|
|
|
|
|
|
|
|
|
|
|
|
|
|
|
|
|
|
|
|
|
|
|
|
|
|||
|
|
|
|
|
|
|
|
|
|
|
|
|
|
|
|
|
|
|
|
|
|
|
|
|
|
|
|
|
|
|
|
|
|
|
|
|
|
|
|
|
|
|
|
|
|
||
|
-10 |
|
|
|
|
|
|
|
|
|
|
|
|
|
|
|
|
10% |
|
|
|
|
|
|
|
|
|
|
|
|
|
|
|
|
|
|
|
|
|
|
|
|
|
|
|
||
|
-15 |
|
|
|
|
|
|
|
|
|
|
|
|
|
|
|
|
|
|
|
|
|
|
|
|
|
|
|
|
|
|
|
|
|
|
|
|
|
|
|
|
|
|
|
|||
|
|
|
|
|
|
|
|
|
|
|
|
|
|
|
|
|
|
|
|
|
|
|
|
|
|
|
|
|
|
|
|
|
|
|
|
|
|
|
|
|
|
|
|
|
|
||
|
-20 |
|
|
|
|
|
|
|
|
|
|
|
|
|
|
|
|
5% |
|
|
|
|
|
|
|
|
|
|
|
|
|
|
|
|
|
|
|
|
|
|
|
|
|
|
|
||
|
|
|
|
|
|
|
|
|
|
|
|
|
|
|
|
|
|
|
|
|
|
|
|
|
|
|
|
|
|
|
|
|
|
|
|
|
|
|
|
|
|
|
|
|
|
||
|
-25 |
|
|
|
|
|
|
|
|
|
|
|
|
|
|
|
|
|
|
|
|
|
|
|
|
|
|
|
|
|
|
|
|
|
|
|
|
|
|
|
|
|
|
|
|
|
|
|
-30 |
|
|
|
|
|
|
|
|
|
|
|
|
|
|
|
|
0% |
|
|
|
|
|
|
|
|
|
|
|
|
|
|
|
|
|
|
|
|
|
|
|
|
|
|
|
||
|
|
|
|
|
|
|
|
|
|
|
|
|
|
|
|
|
|
|
|
|
|
|
|
|
|
|
|
|
|
|
|
|
|
|
|
|
|
|
|
|
|
|
|
||||
|
-35 |
|
|
|
|
|
|
|
|
|
|
|
|
|
|
|
|
|
|
|
|
|
|
|
|
|
|
|
|
|
|
|
|
|
|
|
|
|
|
|
|
|
|
|
|
|
|
|
-40 |
|
|
OCT-07 |
OCT-08 |
|
OCT-10 |
|
OCT-12 |
OCT-13 |
|
OCT-15 |
|
OCT-17 |
OCT-18 |
-5% |
Mar-15 |
May-15 |
Jul-15 |
Sep-15 |
Nov-15 |
Jan-16 |
Mar-16 |
May-16 |
Jul-16 |
Sep-16 |
Nov-16 |
Jan-17 |
Mar-17 |
May-17 |
Jul-17 |
Sep-17 |
Nov-17 |
Jan-18 |
Mar-18 |
May-18 |
Jul-18 |
Sep-18 |
|||||||||
|
|
|
|
|
|
|
|||||||||||||||||||||||||||||||||||||||||
Deutsche |
|
OCT-06 |
OCT-09 |
OCT-11 |
OCT-14 |
OCT-16 |
|
|
|||||||||||||||||||||||||||||||||||||||
|
|
|
|
|
|
|
|
|
|
|
|
|
|
|
|
||||||||||||||||||||||||||||||||
|
Source: Deutsche Bank, Haver |
|
|
|
|
|
|
|
|
|
|
|
|
|
Source: Deutsche Bank, Datastream, Haver |
|
|
|
|
|
|
|
|
|
|
|
|
|
|
|
|
|
|
|
|||||||||||||
|
|
|
|
|
|
|
|
|
|
|
|
|
|
|
|
|
|
|
|
|
|
|
|
|
|
|
|
|
|
|
|
|
|
||||||||||||||
AG/London Bank |
|
|
|
|
|
|
|
|
|
|
|
|
|
|
|
|
|
|
|
|
|
|
|
|
|
|
|
|
|
|
|
|
|
|
|
|
|
|
|
|
|
|
|
|
|
|
|
|
|
|
|
|
|
|
|
|
|
|
|
|
|
|
|
|
|
|
|
|
|
|
|
|
|
|
|
|
|
|
|
|
|
|
|
|
|
|
|
|
|
|
|
|
|
|
|
Building European |
2018 December 3 Materials Building |
Construction & |
|