DB European Building Construction 2019 Outlook_watermark
.pdfvk.com/id4464259433 December 2018
Building Materials
European Building & Construction
Figure 143: SGO share price evolution vs change in France building permits
80 |
|
|
|
|
|
|
|
|
|
|
|
|
|
|
|
|
|
|
|
|
|
|
|
|
|
|
|
|
|
|
|
|
|
|
|
|
|
|
|
|
|
|
|
|
|
|
40% |
70 |
|
|
|
|
|
|
|
|
|
|
|
|
|
|
|
|
|
|
|
|
|
|
|
|
|
|
|
|
|
|
|
|
|
|
|
|
|
|
|
|
|
|
|
|
|
|
30% |
60 |
|
|
|
|
|
|
|
|
|
|
|
|
|
|
|
|
|
|
|
|
|
|
|
|
|
|
|
|
|
|
|
|
|
|
|
|
|
|
|
|
|
|
|
|
|
|
20% |
50 |
|
|
|
|
|
|
|
|
|
|
|
|
|
|
|
|
|
|
|
|
|
|
|
|
|
|
|
|
|
|
|
|
|
|
|
|
|
|
|
|
|
|
|
|
|
|
10% |
40 |
|
|
|
|
|
|
|
|
|
|
|
|
|
|
|
|
|
|
|
|
|
|
|
|
|
|
|
|
|
|
|
|
|
|
|
|
|
|
|
|
|
|
|
|
|
|
0% |
30 |
|
|
|
|
|
|
|
|
|
|
|
|
|
|
|
|
|
|
|
|
|
|
|
|
|
|
|
|
|
|
|
|
|
|
|
|
|
|
|
|
|
|
|
|
|
|
-10% |
20 |
|
|
|
|
|
|
|
|
|
|
|
|
|
|
|
|
|
|
|
|
|
|
|
|
|
|
|
|
|
|
|
|
|
|
|
|
|
|
|
|
|
|
|
|
|
|
-20% |
10 |
|
|
|
|
|
|
|
|
|
|
|
|
|
|
|
|
|
|
|
|
|
|
|
|
|
|
|
|
|
|
|
|
|
|
|
|
|
|
|
|
|
|
|
|
|
|
-30% |
0 |
|
|
|
|
|
|
|
Jan-09 |
|
|
|
|
|
|
|
|
|
|
|
|
|
|
|
|
|
|
|
|
|
|
|
Jan-15 |
|
|
|
Jan-16 |
|
|
|
Jan-17 |
|
|
|
|
|
|
-40% |
Jan-07 |
Apr-07 |
Jul-07 |
Oct-07 |
Jan-08 |
Apr-08 |
Jul-08 |
Oct-08 |
Apr-09 |
Jul-09 |
Oct-09 |
Jan-10 |
Apr-10 |
Jul-10 |
Oct-10 |
Jan-11 |
Apr-11 |
Jul-11 |
Oct-11 |
Jan-12 |
Apr-12 |
Jul-12 |
Oct-12 |
Jan-13 |
Apr-13 |
Jul-13 |
Oct-13 |
Jan-14 |
Apr-14 |
Jul-14 |
Oct-14 |
Apr-15 |
Jul-15 |
Oct-15 |
Apr-16 |
Jul-16 |
Oct-16 |
Apr-17 |
Jul-17 |
Oct-17 |
Jan-18 |
Apr-18 |
Jul-18 |
Oct-18 |
|
|
France Building permits 6m trailing YoY change |
|
Saint Gobain share price (EUR, rhs) |
Source: Deutsche Bank, Factset, Datastream |
|
|
||
|
|
|||
|
|
|
|
|
Forecasts and ratios |
|
|
|
|
|
Year End Dec 31 |
2016A |
2017A |
2018E |
2019E |
2020E |
Revenue (EURm) |
39,093 |
40,810 |
41,710 |
43,291 |
44,799 |
EBITDA (EURm) |
3,998 |
4,234 |
4,378 |
4,631 |
4,919 |
EBITA (EURm) |
2,818 |
3,028 |
3,137 |
3,353 |
3,604 |
PBT DB (EURm) |
1,763 |
2,063 |
2,860 |
2,736 |
2,995 |
PBT stated (EURm) |
1,763 |
2,063 |
2,860 |
2,736 |
2,995 |
DB EPS (EUR) |
3.08 |
2.95 |
3.37 |
3.71 |
4.10 |
OLD DB EPS (EUR) |
3.08 |
2.95 |
3.29 |
3.72 |
4.22 |
% Change |
0.0% |
0.0% |
2.5% |
-0.2% |
-2.9% |
DB EPS growth (%) |
-19.6 |
-4.3 |
14.5 |
10.0 |
10.5 |
P/E (DB EPS) (x) |
12.5 |
16.2 |
9.8 |
8.9 |
8.0 |
DB EV/ DB EBITDA (x) |
7.8 |
8.5 |
6.6 |
6.2 |
5.6 |
EV/EBITA (x) |
11.1 |
11.9 |
9.2 |
8.5 |
7.7 |
DPS (EUR) |
1.26 |
1.30 |
1.35 |
1.48 |
1.64 |
Yield (%) |
3.3 |
2.7 |
4.1 |
4.5 |
5.0 |
Source: Deutsche Bank estimates, company data |
|
|
|
|
|
Deutsche Bank AG/London |
Page 71 |

vk.com/id446425943
3 December 2018
Building Materials
European Building & Construction
Model updated: 29 November 2018
Running the Numbers
Europe
France
Building Materials
Saint Gobain
Reuters: SGOB.PA Bloomberg: SGO FP
Buy
Price (29 Nov 18) |
|
€ 32.94 |
|
|
|
Target price |
|
€ 43.00 |
|
|
|
52-week Range |
€ 30.93 – 48.54 |
|
|
|
|
Market Cap |
€ |
18,012m |
|
US$ |
20,323m |
|
|
|
Company Profile
Saint-Gobain is a diversified global company active in building distribution, construction products, flat glass, high performance materials and packaging. On an aggregated basis, concstruction end-markets (mainly residential) represent 84% of total sales excluding Packaging (nonstrategic business the company plans to exit).
1yr Price Performance
55 |
|
|
|
50 |
|
|
|
45 |
|
|
|
40 |
|
|
|
35 |
|
|
|
30 |
|
|
|
Nov-17 |
Feb-18 |
May-18 |
Aug-18 |
SGOB.PA |
|
EURO STOXX PRICE (Rebased) |
Margin Trends
12 |
|
|
|
|
|
10 |
|
|
|
|
|
8 |
|
|
|
|
|
6 |
|
|
|
|
|
4 |
|
|
|
|
|
2 |
|
|
|
|
|
0 |
|
|
|
|
|
15 |
16 |
17 |
18E |
19E |
20E |
EBITDA Margin |
|
EBIT Margin |
Growth & Profitability
6 |
|
|
|
|
14 |
4 |
|
|
|
|
12 |
|
|
|
|
10 |
|
|
|
|
|
|
|
2 |
|
|
|
|
8 |
|
|
|
|
|
|
0 |
|
|
|
|
6 |
|
|
|
|
|
|
-2 |
|
|
|
|
4 |
|
|
|
|
2 |
|
|
|
|
|
|
|
-4 |
|
|
|
|
0 |
15 |
16 |
17 |
18E |
19E |
20E |
Sales growth (LHS) |
|
ROE (RHS) |
Solvency |
|
|
|
|
|
40 |
|
|
|
|
10 |
30 |
|
|
|
|
8 |
|
|
|
|
|
|
20 |
|
|
|
|
6 |
|
|
|
|
4 |
|
|
|
|
|
|
|
10 |
|
|
|
|
2 |
|
|
|
|
|
|
0 |
|
|
|
|
0 |
15 |
16 |
17 |
18E |
19E |
20E |
Net debt/equity (LHS) Net interest cover (RHS)
Xavier Marchand
+44(207)545-1400 xavier.marchand@db.com
Fiscal year end 31-Dec |
2015 |
2016 |
2017 |
2018E |
2019E |
2020E |
|
|
|
|
|
|
|
Financial Summary |
|
|
|
|
|
|
DB EPS (€) |
3.83 |
3.08 |
2.95 |
3.37 |
3.71 |
4.10 |
Reported EPS (€) |
2.34 |
2.37 |
2.83 |
4.17 |
3.71 |
4.10 |
DPS (€) |
1.24 |
1.26 |
1.30 |
1.35 |
1.48 |
1.64 |
BVPS (€) |
34.25 |
33.91 |
33.37 |
34.64 |
36.25 |
37.74 |
Weighted average shares (m) |
553 |
553 |
553 |
547 |
537 |
533 |
Average market cap (€m) |
22,275 |
21,252 |
26,431 |
18,012 |
17,682 |
17,567 |
Enterprise value (€m) |
31,631 |
31,231 |
36,043 |
28,937 |
28,193 |
27,143 |
|
|
|
|
|
|
|
Valuation Metrics |
|
|
|
|
|
|
P/E (DB) (x) |
10.5 |
12.5 |
16.2 |
9.8 |
8.9 |
8.0 |
P/E (Reported) (x) |
17.2 |
16.2 |
16.9 |
7.9 |
8.9 |
8.0 |
P/BV (x) |
1.16 |
1.31 |
1.38 |
0.95 |
0.91 |
0.87 |
FCF Yield (%) |
4.4 |
2.1 |
4.2 |
6.6 |
8.4 |
9.5 |
Dividend Yield (%) |
3.1 |
3.3 |
2.7 |
4.1 |
4.5 |
5.0 |
EV/Sales (x) |
0.80 |
0.80 |
0.88 |
0.69 |
0.65 |
0.61 |
EV/EBITDA (x) |
8.2 |
7.8 |
8.5 |
6.6 |
6.1 |
5.5 |
EV/EBIT (x) |
12.0 |
11.1 |
11.9 |
9.2 |
8.4 |
7.5 |
|
|
|
|
|
|
|
Income Statement (€m) |
|
|
|
|
|
|
Sales revenue |
39,623 |
39,093 |
40,810 |
41,710 |
43,291 |
44,799 |
Gross profit |
39,623 |
39,093 |
40,810 |
41,710 |
43,291 |
44,799 |
EBITDA |
3,844 |
3,998 |
4,234 |
4,378 |
4,631 |
4,919 |
Depreciation |
1,208 |
1,180 |
1,206 |
1,241 |
1,277 |
1,315 |
Amortisation |
0 |
0 |
0 |
0 |
0 |
0 |
EBIT |
2,636 |
2,818 |
3,028 |
3,137 |
3,353 |
3,604 |
Net interest income(expense) |
-629 |
-541 |
-448 |
180 |
-397 |
-389 |
Associates/affiliates |
0 |
5 |
0 |
0 |
0 |
0 |
Exceptionals/extraordinaries |
0 |
0 |
0 |
0 |
0 |
0 |
Other pre-tax income/(expense) |
-1,342 |
-514 |
-517 |
-457 |
-220 |
-220 |
Profit before tax |
665 |
1,763 |
2,063 |
2,860 |
2,736 |
2,995 |
Income tax expense |
248 |
416 |
438 |
520 |
684 |
749 |
Minorities |
51 |
41 |
59 |
59 |
59 |
59 |
Other post-tax income/(expense) |
929 |
0 |
0 |
0 |
0 |
0 |
Net profit |
1,295 |
1,311 |
1,566 |
2,281 |
1,993 |
2,187 |
DB adjustments (including dilution) |
823 |
393 |
65 |
-435 |
0 |
0 |
DB Net profit |
2,119 |
1,704 |
1,631 |
1,846 |
1,993 |
2,187 |
|
|
|
|
|
|
|
Cash Flow (€m) |
|
|
|
|
|
|
Cash flow from operations |
2,469 |
1,965 |
2,751 |
2,868 |
3,229 |
3,470 |
Net Capex |
-1,484 |
-1,518 |
-1,638 |
-1,674 |
-1,738 |
-1,798 |
Free cash flow |
985 |
447 |
1,113 |
1,194 |
1,491 |
1,672 |
Equity raised/(bought back) |
-133 |
-269 |
-219 |
-494 |
-224 |
0 |
Dividends paid |
-732 |
-711 |
-731 |
-764 |
-952 |
-837 |
Net inc/(dec) in borrowings |
0 |
0 |
0 |
0 |
0 |
0 |
Other investing/financing cash flows |
2,304 |
-314 |
-488 |
-350 |
100 |
100 |
Net cash flow |
2,424 |
-847 |
-325 |
-414 |
415 |
935 |
Change in working capital |
84 |
-236 |
-209 |
-300 |
-48 |
-50 |
|
|
|
|
|
|
|
Balance Sheet (€m) |
|
|
|
|
|
|
Cash and other liquid assets |
5,380 |
3,738 |
3,284 |
3,153 |
3,194 |
3,288 |
Tangible fixed assets |
16,626 |
16,590 |
16,284 |
17,067 |
17,427 |
17,810 |
Goodwill/intangible assets |
10,683 |
10,669 |
10,575 |
10,308 |
10,308 |
10,308 |
Associates/investments |
0 |
0 |
0 |
0 |
0 |
0 |
Other assets |
12,167 |
12,770 |
12,774 |
12,954 |
12,983 |
13,013 |
Total assets |
44,856 |
43,767 |
42,917 |
43,482 |
43,912 |
44,419 |
Interest bearing debt |
10,177 |
9,382 |
9,239 |
10,421 |
10,048 |
9,206 |
Other liabilities |
15,359 |
15,245 |
14,826 |
14,776 |
14,827 |
14,877 |
Total liabilities |
25,536 |
24,627 |
24,065 |
25,197 |
24,874 |
24,083 |
Shareholders' equity |
18,956 |
18,765 |
18,468 |
18,717 |
19,333 |
20,129 |
Minorities |
364 |
375 |
384 |
384 |
384 |
384 |
Total shareholders' equity |
19,320 |
19,140 |
18,852 |
19,101 |
19,717 |
20,513 |
Net debt |
4,797 |
5,644 |
5,955 |
7,269 |
6,854 |
5,919 |
|
|
|
|
|
|
|
Key Company Metrics |
|
|
|
|
|
|
Sales growth (%) |
-3.5 |
-1.3 |
4.4 |
2.2 |
3.8 |
3.5 |
DB EPS growth (%) |
92.5 |
-19.6 |
-4.3 |
14.5 |
10.0 |
10.5 |
EBITDA Margin (%) |
9.7 |
10.2 |
10.4 |
10.5 |
10.7 |
11.0 |
EBIT Margin (%) |
6.7 |
7.2 |
7.4 |
7.5 |
7.7 |
8.0 |
Payout ratio (%) |
53.0 |
53.2 |
45.9 |
32.4 |
40.0 |
40.0 |
ROE (%) |
7.0 |
7.0 |
8.4 |
12.3 |
10.5 |
11.1 |
Capex/sales (%) |
3.7 |
3.9 |
4.0 |
4.0 |
4.0 |
4.0 |
Capex/depreciation (x) |
1.2 |
1.3 |
1.4 |
1.3 |
1.4 |
1.4 |
Net debt/equity (%) |
24.8 |
29.5 |
31.6 |
38.1 |
34.8 |
28.9 |
Net interest cover (x) |
4.2 |
5.2 |
6.8 |
nm |
8.4 |
9.3 |
Source: Company data, Deutsche Bank estimates
Page 72 |
Deutsche Bank AG/London |

vk.com/id4464259433 December 2018
Building Materials
European Building & Construction
Rating |
|
Company |
|
|
|
|
|
|
|
|
|
|
|
||
Buy |
|
Sika |
|
|
|
Xavier Marchand |
|
|
|
|
|
Research Analyst |
|
||
Europe |
|
|
|
+44-20-754-51400 |
|
||
|
|
|
|
|
xavier.marchand@db.com |
|
|
Switzerland |
|
|
|
|
|
|
|
Building & Construction |
|
|
|
|
Price at 28 Nov 2018 (CHF) |
121.30 |
|
|
Reuters |
Bloomberg |
|
|
|
|
|
|
|
Price Target (CHF) |
160.00 |
||||
Building Materials |
|
|
|
|
|||
|
SIKA.S |
SIKA SW |
|
|
|
|
|
|
|
52-week range (CHF) |
146.90 - 113.60 |
||||
|
|
|
|||||
|
|
|
|
|
|
|
|
|
|
|
|
|
|
|
|
Sika (BUY)
With this note, we transfer primary coverage of Sika from Priyal Mulji to Xavier Marchand with immediate effect.
Sector leading EBIT growth in 2019 and robust business model to any macro slow-down
Led by continued top-line growth, raw materials costs moderation and high operational leverage, we forecast Sika to deliver the best top-line and EBIT growth in 2019 across the sector (resp. +5% and +15%). We also see Sika business model as very resilient to a potential downturn: it combines the lowest exposure across the sector to the very cyclical new-build segment in DM, an increasing geographical diversification and a proven track record of market outperformance through increased products penetration. Following recent macro concerns, Sika trades now at 13.9x 2019E EV/EBITDA and 4.6% FCF yield, which is in our view a compelling entry point for a quality growth stock: BUY.
Sika at a glance
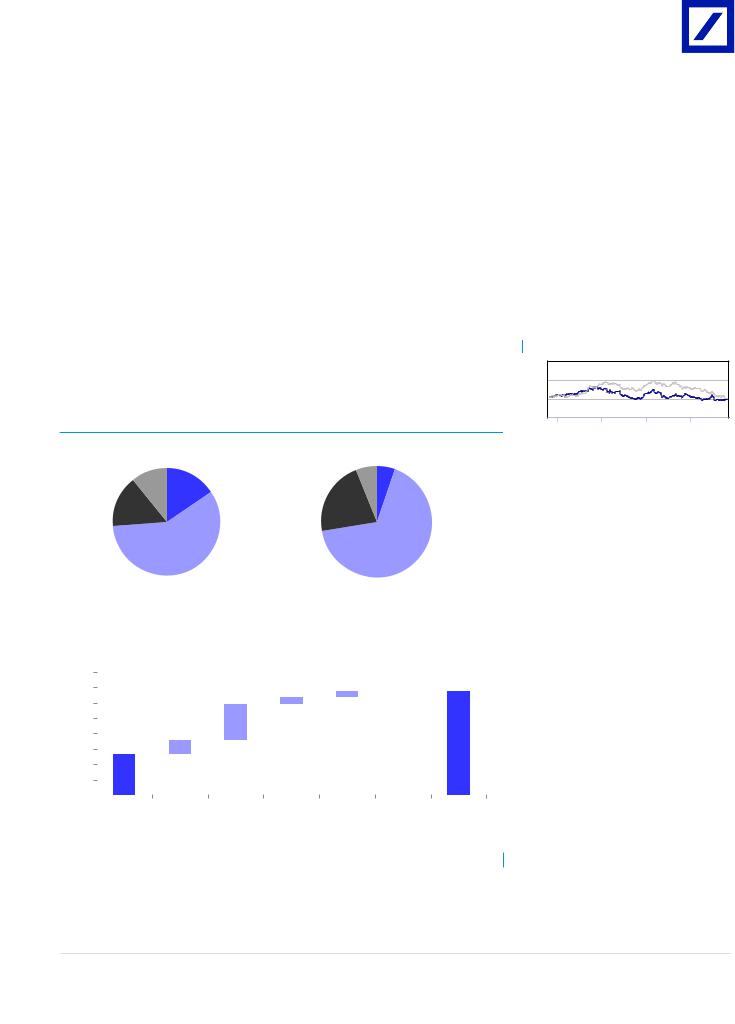
Figure 144: 2018E Sales and Operating profit by geography
GLOBAL |
|
GLOBAL |
BUSINESS |
|
BUSINESS |
13% |
|
14% |
|
EMEA |
EMEA |
|
|
|
|
45% |
39% |
|
|
|
APAC |
|
APAC |
16% |
|
|
|
19% |
|
|
|
|
AMERICAS |
|
AMERICAS |
|
|
|
26% |
|
28% |
|
|
Source: Deutsche Bank, Company data. Note: Total not equal to 100% due to Group / Corp activities.
Key changes |
|
|
TP |
168.00 to ↓ |
-4.8% |
|
160.00 |
|
Source: Deutsche Bank
Price/price relative
175 |
|
|
150 |
|
|
125 |
|
|
100 |
|
|
Jul '18 |
Sep '18 |
Nov '18 |
|
|
Sika |
|
|
SPI Swiss Performance IX (Rebased) |
||
|
|
|
|||||
Performance |
1m |
3m |
12m |
||||
(%) |
|
|
|
|
|
|
|
Absolute |
-0.1 |
-15.7 |
– |
||||
SPI Swiss |
1.9 |
-4.0 |
-2.6 |
||||
Performance |
|
|
|
||||
IX |
|
|
|
||||
Source: Deutsche Bank |
|
|
|
||||
|
|
|
|||||
Key indicators (FY1) |
|
|
|||||
ROE (%) |
|
|
28.1 |
||||
Net debt/equity (%) |
|
109.1 |
|||||
Book value/share (CHF) |
|
12.3 |
|||||
Price/book (x) |
|
|
9.8 |
||||
Net interest cover (x) |
|
23.8 |
|||||
EBIT margin (%) |
|
|
13.9 |
||||
Source: Deutsche Bank |
|
|
|
||||
|
|
|
|||||
Stock & option liquidity data |
|
|
|||||
Market cap (CHF)(m) |
|
17,198.1 |
|||||
Shares outstanding (m) |
|
142 |
|||||
Free float (%) |
|
|
– |
||||
Option volume (und. shrs., 1M avg.) |
– |
||||||
Source: Deutsche Bank |
|
|
|
||||
Deutsche Bank AG/London |
Page 73 |
vk.com/id4464259433 December 2018
Building Materials
European Building & Construction
Key Charts
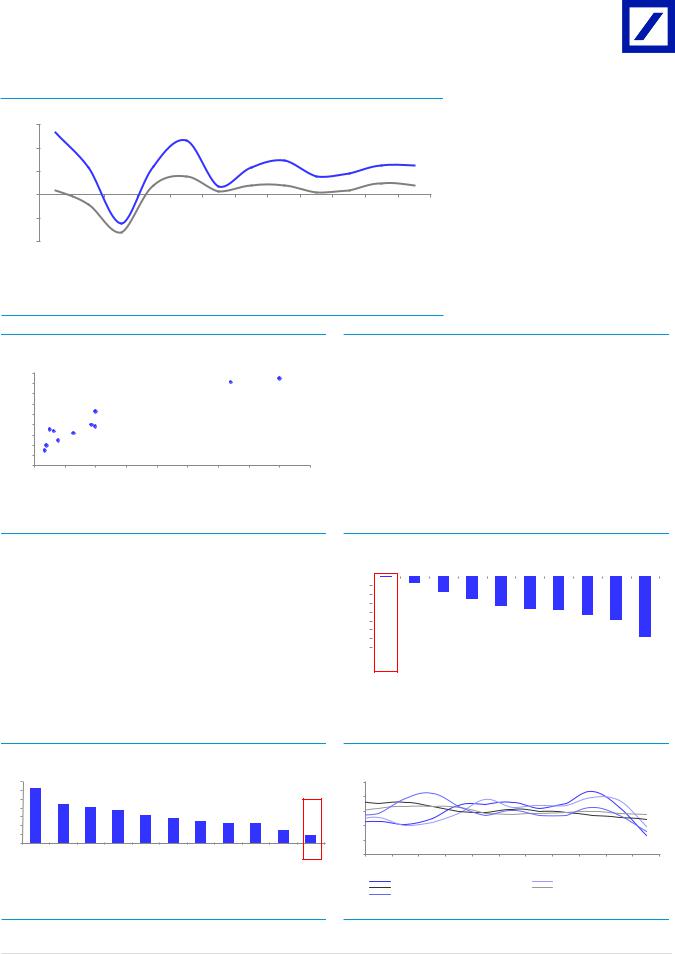
Figure 145: A proven track record of end-market outperformance
15%
10%
5%
0%
-5%
-10%
2007 |
2008 |
2009 |
2010 |
2011 |
2012 |
2013 |
2014 |
2015 |
2016 |
2017 |
2018E |
||
|
|
|
Organic growth YoY |
|
|
Underlying construction market YoY |
|
|
|||||
|
|
|
|
|
|
|
|||||||
Source: Deutsche Bank estimates, Company data, Global Cement Report 12th edition. Note: Underlying construction market estimated by cement volume growth across various countries, weighted by Sika’s 2017 regional breakdown.
Figure 146: Share of cement in bulk vs. GDP per cap ($/ inh.)
|
90% |
|
|
|
|
|
|
|
|
|
|
80% |
|
|
|
|
|
|
|
France |
|
sales |
|
|
|
|
|
|
Italy |
|
|
|
|
|
|
|
|
|
|
|
|
||
70% |
|
|
|
|
|
|
|
|
|
|
cement |
60% |
|
Malaysia |
|
|
|
|
|
|
|
50% |
|
Mexico |
|
|
|
|
|
|
|
|
in |
40% |
Egypt |
Brazil |
|
|
|
|
|
|
|
|
|
|
|
|
|
|
|
|
||
bulk |
30% |
Morocco |
Colombia |
|
|
|
|
|
|
|
of |
20% |
Indonesia |
|
|
|
|
|
|
|
|
India |
|
|
|
|
|
|
|
|
||
Share |
|
|
|
|
|
|
|
|
|
|
10% |
Kenya |
|
|
|
|
|
|
|
|
|
|
|
|
|
|
|
|
|
|
|
|
|
0% |
|
|
|
|
|
|
|
|
|
|
0 |
5,000 |
10,000 |
15,000 |
20,000 |
25,000 |
30,000 |
35,000 |
40,000 |
45,000 |
GDP per cap ($/inh)
Source: Deutsche Bank estimates, Company data, IMF
Figure 147: Addressable market for Sika grows faster than construction market in EM
Country |
|
2010 |
2018 |
Growth CAGR |
Colombia |
Cement demand |
8.9 |
8.9 |
-0.1% |
Colombia |
Addressable market for Sika |
2.3 |
2.8 |
3.9% |
Colombia |
Share of cement in bulk |
26% |
32% |
|
Indonesia |
Cement demand |
40.8 |
69.8 |
11.3% |
Indonesia |
Addressable market for Sika |
8.2 |
17.4 |
16.4% |
Indonesia |
Share of cement in bulk |
20% |
25% |
|
Thailand |
Cement demand |
24.5 |
27.1 |
2.0% |
Thailand |
Addressable market for Sika |
13.0 |
16.8 |
5.3% |
Thailand |
Share of cement in bulk |
53% |
62% |
|
Source: Deutsche Bank, Company data
Figure 148: Scope for outperformance also in DM: example of precast market in the US
|
2010 |
2018 |
CAGR |
Cement demand |
71.2 |
99.5 |
4.3% |
Cement for precast |
2.3 |
4.2 |
7.5% |
Precast penetration rate |
3.3% |
4.2% |
|
|
|
|
|
Source: Deutsche Bank estimates, USGS
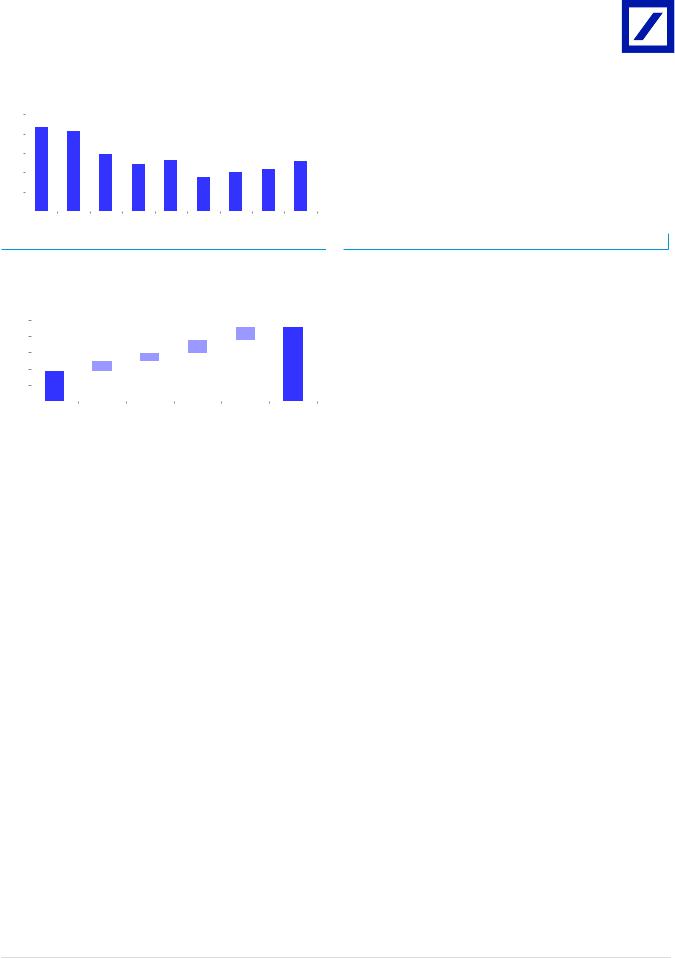
Figure 149: Robust business model in case of market downturn
0% |
|
|
|
|
|
|
|
|
|
|
|
-5% |
|
-1% |
-4% |
|
|
|
|
|
|
|
|
-10% |
|
|
|
|
|
|
|
|
|
|
|
|
|
|
-9% |
|
|
|
|
|
|
|
|
-15% |
|
|
|
|
|
|
|
|
|
|
|
|
|
|
|
-13% |
|
|
|
|
|
|
|
-20% |
|
|
|
|
|
|
|
|
|
|
|
|
|
|
|
|
-17% |
-19% |
-19% |
|
|
|
|
|
|
|
|
|
|
|
|
|
|||
-25% |
|
|
|
|
|
|
-22% |
|
|
||
|
|
|
|
|
|
|
|
|
|
||
|
|
|
|
|
|
|
|
|
-24% |
|
|
-30% |
|
|
|
|
|
|
|
|
|
|
|
|
|
|
|
|
|
|
|
|
|
|
|
-35% |
|
|
|
|
|
|
|
|
|
|
|
-40% |
|
|
|
|
|
|
|
|
|
|
-34% |
|
Sika |
Geberit |
LafargeHolcim |
Saint Gobain |
Heidelberg |
Cemex |
Titan |
Buzzi |
CRH |
Kingspan |
|
|
|
Source: Deutsche Bank estimates, Company data
Figure 150: Lesser exposure to new-build in DM vs. peers
70% |
62% |
|
|
|
|
|
|
|
|
|
|
60% |
|
|
|
|
|
|
|
|
|
|
|
50% |
|
44% |
41% |
37% |
|
|
|
|
|
|
|
|
|
|
|
|
|
|
|
|
|
||
40% |
|
|
|
31% |
|
|
|
|
|
|
|
|
|
|
|
28% |
|
|
|
|
|
||
|
|
|
|
|
|
|
|
|
|
||
30% |
|
|
|
|
|
25% |
23% |
22% |
|
|
|
|
|
|
|
|
|
|
|
||||
|
|
|
|
|
|
|
|
|
|||
20% |
|
|
|
|
|
|
|
|
|
15% |
9% |
|
|
|
|
|
|
|
|
|
|
||
|
|
|
|
|
|
|
|
|
|
|
|
10% |
|
|
|
|
|
|
|
|
|
|
|
0% |
Kingspan |
CRH |
Buzzi |
Titan |
Heidelberg |
Geberit |
Saint Gobain |
Cemex |
LafargeHolci m |
Tarkett |
Sika |
|
Source: Deutsche Bank estimates, Company data
Figure 151: Key raw materials should be down in 2019E
120 |
|
|
|
|
|
|
|
|
|
|
110 |
|
|
|
|
|
|
|
|
|
|
100 |
|
|
|
|
|
|
|
|
|
98 |
|
|
|
|
|
|
|
|
|
|
|
|
|
|
|
|
|
|
|
|
|
94 |
90 |
|
|
|
|
|
|
|
|
|
90 |
|
|
|
|
|
|
|
|
|
|
86 |
80 |
|
|
|
|
|
|
|
|
|
83 |
70 |
|
|
Apr-18 |
May-18 |
|
|
Aug-18 |
Sep-18 |
Oct-18 |
Nov-18 |
Jan-18 |
Feb-18 |
Mar-18 |
Jun-18 |
Jul-18 |
||||||
|
Brent Crude |
|
|
|
|
|
Naphta |
|
|
|
|
Polyethytlene linear low density |
|
|
MDI W Europe |
|
|
||||
|
Polystyrene General purpose |
|
|
|
|
|
|
|
||
Source: Deutsche Bank estimates, Factset, Bloomberg Finance LP
Page 74 |
Deutsche Bank AG/London |
vk.com/id4464259433 December 2018
Building Materials
European Building & Construction
Figure 152: Gross margin historical evolution and improvement
56% |
|
55.4% |
55.1% |
|
|
|
|
|
|
|
|
|
|
|
|
||
|
|
|
|
|
|
|
|
|
55% |
|
|
|
|
|
|
|
|
|
|
|
|
54.0% |
|
|
|
|
54% |
|
|
|
|
53.5% |
53.6% |
|
53.6% |
|
|
|
|
|
|
|
|
|
|
|
|
|
|
|
|
53.0% |
53.2% |
|
|
|
|
|
|
|
|
|
53% |
|
|
|
|
|
|
52.7% |
|
|
|
|
|
|
|
|
|
|
52% |
|
|
|
|
|
|
|
|
51% |
|
|
|
|
|
|
|
|
|
|
FY 16 |
H1 17 |
Q3 17 |
Q4 17 |
H1 18 |
Q3 18 Q4 18E FY 18E FY 19E |
|
Source: Deutsche Bank estimates, Company data
Figure 154: 2018-19E EBIT margin bridge - DB assumptions
15.5% |
|
|
|
|
0.40% |
15.3% |
|
|
|
0.40% |
|
||
15.0% |
|
|
|
|
|
|
|
|
|
|
|
|
|
14.5% |
|
|
0.25% |
|
|
|
|
|
0.33% |
|
|
|
|
|
|
|
|
|
|
|
14.0% |
|
13.9% |
|
|
|
|
|
|
|
|
|
|
|
13.5% |
|
|
|
|
|
|
13.0% |
|
|
|
|
|
|
|
|
2018 DBe |
SGO impact Dilutive impact |
Gross margin |
Operational |
2019 DBe |
|
|
|
of acquisitions |
improvement |
leverage |
|
|
|
|
in 2018 |
|
|
|
Source: Deutsche Bank estimates
Figure 153: Historical evidences of strong operational leverage
|
2011 |
2012 |
2013 |
2014 |
2015 |
2016 |
2017 |
2018E |
2019E |
YoY gross margin evolution |
-3.3% |
1.7% |
0.2% |
0.6% |
1.1% |
1.2% |
-0.9% |
-1.2% |
0.4% |
YoY Others costs / Sales evolution |
1.0% |
-0.4% |
1.1% |
0.6% |
-0.2% |
0.3% |
1.5% |
0.8% |
1.0% |
YoY EBIT Margin evolution |
-2.3% |
1.3% |
1.3% |
1.2% |
0.9% |
1.6% |
0.5% |
-0.4% |
1.4% |
|
|
|
|
|
|
|
|
|
|
Source: Deutsche Bank estimates, Company data
Forecasts and ratios |
|
|
|
|
|
Year End Dec 31 |
2016A |
2017A |
2018E |
2019E |
2020E |
Revenue (CHFm) |
5,748 |
6,248 |
7,123 |
7,467 |
7,850 |
EBITDA (CHFm) |
966 |
1,068 |
1,205 |
1,369 |
1,499 |
EBITA (CHFm) |
795 |
896 |
991 |
1,145 |
1,263 |
PBT DB (CHFm) |
756 |
862 |
949 |
1,095 |
1,214 |
PBT stated (CHFm) |
756 |
862 |
949 |
1,095 |
1,214 |
DB EPS (CHF) |
36.97 |
42.25 |
5.08 |
5.87 |
6.51 |
OLD DB EPS (CHF) |
36.97 |
42.25 |
5.31 |
5.63 |
5.96 |
% Change |
0.0% |
0.0% |
-4.2% |
4.3% |
9.2% |
DB EPS growth (%) |
22.3 |
14.3 |
-88.0 |
15.5 |
10.9 |
P/E (DB EPS) (x) |
– |
– |
23.9 |
20.7 |
18.6 |
DB EV/ DB EBITDA (x) |
– |
– |
15.9 |
13.7 |
12.1 |
EV/EBITA (x) |
– |
– |
19.3 |
16.3 |
14.4 |
DPS (CHF) |
16.00 |
18.50 |
20.72 |
23.92 |
26.53 |
Yield (%) |
– |
– |
17.1 |
19.7 |
21.9 |
Source: Deutsche Bank estimates, company data |
|
|
|
|
|
Deutsche Bank AG/London |
Page 75 |
vk.com/id446425943
3 December 2018
Building Materials
European Building & Construction
Model updated: 29 November 2018
Running the Numbers
Europe
Switzerland
Building Materials
Sika
|
Reuters: SIKA.S |
Bloomberg: SIKA SW |
|
|
|
|
Buy |
|
|
Price (29 Nov 18) |
CHF 121.30 |
|
||
|
|
|
|
Target price |
CHF 160.00 |
|
|
|
|
52-week Range |
CHF 113.60 – 146.90 |
|
|
|
|
Market Cap |
CHF 17,198m |
|
|
US$ 17,203m |
|
|
|
Company Profile
Sika is the global market leader in production of specialty chemicals sold into constructions uses, and also sells into industry.
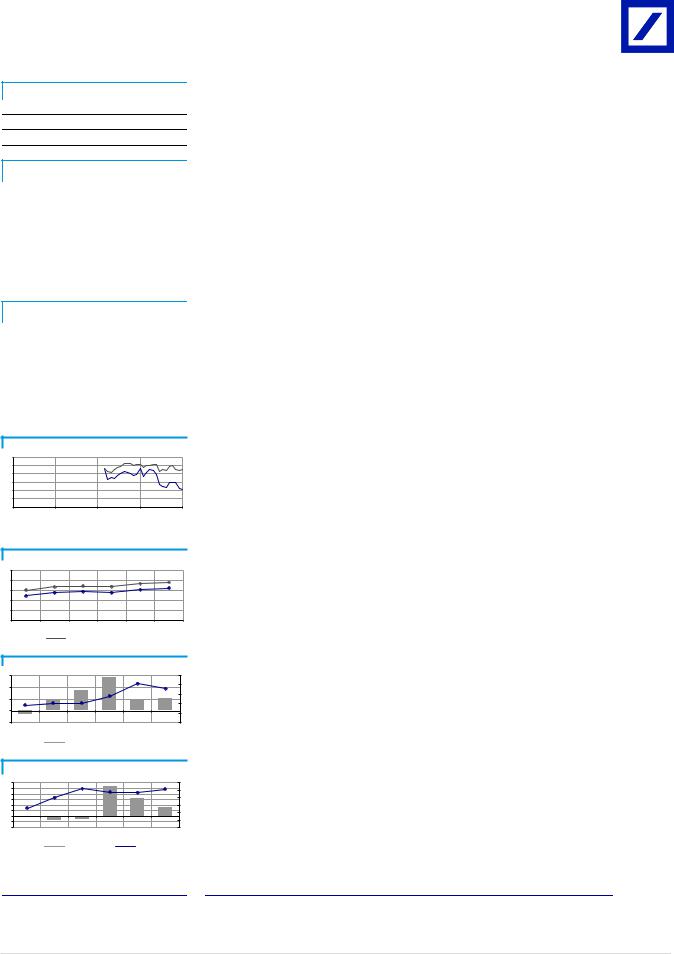
1yr Price Performance
160
150
140
130
120
110
100
Nov-17 |
Feb-18 |
May-18 |
Aug-18 |
||
|
|
SIKA.S |
|
|
SPI (Rebased) |
Margin Trends
25 |
|
|
|
|
|
20 |
|
|
|
|
|
15 |
|
|
|
|
|
10 |
|
|
|
|
|
5 |
|
|
|
|
|
0 |
|
|
|
|
|
15 |
16 |
17 |
18E |
19E |
20E |
EBITDA Margin |
|
EBIT Margin |
Growth & Profitability
15 |
|
|
|
|
50 |
10 |
|
|
|
|
40 |
|
|
|
|
|
|
5 |
|
|
|
|
30 |
|
|
|
|
20 |
|
|
|
|
|
|
|
0 |
|
|
|
|
10 |
|
|
|
|
|
|
-5 |
|
|
|
|
0 |
15 |
16 |
17 |
18E |
19E |
20E |
Sales growth (LHS) |
|
ROE (RHS) |
Solvency |
|
|
|
|
|
120 |
|
|
|
|
30 |
100 |
|
|
|
|
25 |
80 |
|
|
|
|
20 |
60 |
|
|
|
|
|
|
|
|
|
|
|
40 |
|
|
|
|
15 |
20 |
|
|
|
|
10 |
0 |
|
|
|
|
|
|
|
|
|
5 |
|
-20 |
|
|
|
|
|
|
|
|
|
|
|
-40 |
|
|
|
|
0 |
15 |
16 |
17 |
18E |
19E |
20E |
Net debt/equity (LHS) Net interest cover (RHS)
Xavier Marchand
+44(207)545-1400 xavier.marchand@db.com
Fiscal year end 31-Dec |
2015 |
2016 |
2017 |
2018E |
2019E |
2020E |
|
|
|
|
|
|
|
Financial Summary |
|
|
|
|
|
|
DB EPS (CHF) |
30.23 |
36.97 |
42.25 |
5.08 |
5.87 |
6.51 |
Reported EPS (CHF) |
30.23 |
36.97 |
42.25 |
5.08 |
5.87 |
6.51 |
DPS (CHF) |
13.00 |
16.00 |
18.50 |
20.72 |
23.92 |
26.53 |
BVPS (CHF) |
166.20 |
191.98 |
222.24 |
12.34 |
16.02 |
20.00 |
Weighted average shares (m) |
15 |
15 |
15 |
142 |
142 |
142 |
Average market cap (CHFm) |
na |
na |
na |
17,198 |
17,198 |
17,198 |
Enterprise value (CHFm) |
na |
na |
na |
19,161 |
18,685 |
18,174 |
|
|
|
|
|
|
|
Valuation Metrics |
|
|
|
|
|
|
P/E (DB) (x) |
na |
na |
na |
23.9 |
20.7 |
18.6 |
P/E (Reported) (x) |
na |
na |
na |
23.9 |
20.7 |
18.6 |
P/BV (x) |
na |
na |
na |
9.83 |
7.57 |
6.06 |
FCF Yield (%) |
na |
na |
na |
5.1 |
6.4 |
7.0 |
Dividend Yield (%) |
na |
na |
na |
17.1 |
19.7 |
21.9 |
EV/Sales (x) |
na |
na |
na |
2.69 |
2.50 |
2.32 |
EV/EBITDA (x) |
na |
na |
na |
15.9 |
13.7 |
12.1 |
EV/EBIT (x) |
na |
na |
na |
19.3 |
16.3 |
14.4 |
|
|
|
|
|
|
|
Income Statement (CHFm) |
|
|
|
|
|
|
Sales revenue |
5,489 |
5,748 |
6,248 |
7,123 |
7,467 |
7,850 |
Gross profit |
2,971 |
3,181 |
3,399 |
3,793 |
3,999 |
4,227 |
EBITDA |
837 |
966 |
1,069 |
1,205 |
1,369 |
1,499 |
Depreciation |
114 |
118 |
124 |
142 |
149 |
157 |
Amortisation |
50 |
52 |
48 |
71 |
75 |
79 |
EBIT |
673 |
795 |
896 |
991 |
1,145 |
1,263 |
Net interest income(expense) |
-51 |
-40 |
-34 |
-42 |
-49 |
-49 |
Associates/affiliates |
0 |
0 |
0 |
0 |
0 |
0 |
Exceptionals/extraordinaries |
0 |
0 |
0 |
0 |
0 |
0 |
Other pre-tax income/(expense) |
0 |
0 |
0 |
0 |
0 |
0 |
Profit before tax |
622 |
756 |
862 |
949 |
1,095 |
1,214 |
Income tax expense |
157 |
189 |
213 |
223 |
257 |
285 |
Minorities |
5 |
4 |
6 |
6 |
6 |
6 |
Other post-tax income/(expense) |
0 |
0 |
0 |
0 |
0 |
0 |
Net profit |
460 |
563 |
644 |
721 |
832 |
923 |
DB adjustments (including dilution) |
0 |
0 |
0 |
0 |
0 |
0 |
DB Net profit |
460 |
563 |
644 |
721 |
832 |
923 |
|
|
|
|
|
|
|
Cash Flow (CHFm) |
|
|
|
|
|
|
Cash flow from operations |
810 |
976 |
978 |
1,109 |
1,307 |
1,430 |
Net Capex |
-134 |
-149 |
-155 |
-225 |
-209 |
-220 |
Free cash flow |
676 |
826 |
823 |
884 |
1,098 |
1,210 |
Equity raised/(bought back) |
0 |
0 |
0 |
0 |
0 |
0 |
Dividends paid |
-183 |
-200 |
-246 |
-282 |
-315 |
-364 |
Net inc/(dec) in borrowings |
0 |
0 |
0 |
0 |
0 |
0 |
Other investing/financing cash flows |
-293 |
-296 |
-616 |
-2,878 |
-307 |
-334 |
Net cash flow |
200 |
331 |
-39 |
-2,275 |
476 |
511 |
Change in working capital |
-1,018 |
-1,057 |
-1,187 |
-1,282 |
-1,344 |
-1,413 |
|
|
|
|
|
|
|
Balance Sheet (CHFm) |
|
|
|
|
|
|
Cash and other liquid assets |
1,074 |
1,155 |
1,038 |
583 |
678 |
780 |
Tangible fixed assets |
924 |
959 |
1,065 |
1,252 |
1,282 |
1,314 |
Goodwill/intangible assets |
1,038 |
1,021 |
1,314 |
1,671 |
1,626 |
1,579 |
Associates/investments |
0 |
0 |
0 |
0 |
0 |
0 |
Other assets |
1,887 |
1,964 |
2,375 |
2,442 |
2,485 |
2,533 |
Total assets |
4,924 |
5,099 |
5,792 |
5,948 |
6,072 |
6,207 |
Interest bearing debt |
948 |
699 |
699 |
2,519 |
2,139 |
1,730 |
Other liabilities |
1,423 |
1,453 |
1,682 |
1,653 |
1,635 |
1,614 |
Total liabilities |
2,372 |
2,152 |
2,381 |
4,173 |
3,774 |
3,344 |
Shareholders' equity |
2,531 |
2,924 |
3,385 |
1,749 |
2,272 |
2,836 |
Minorities |
21 |
23 |
26 |
26 |
26 |
26 |
Total shareholders' equity |
2,552 |
2,948 |
3,411 |
1,776 |
2,298 |
2,862 |
Net debt |
-126 |
-456 |
-339 |
1,936 |
1,461 |
950 |
|
|
|
|
|
|
|
Key Company Metrics |
|
|
|
|
|
|
Sales growth (%) |
-1.5 |
4.7 |
8.7 |
14.0 |
4.8 |
5.1 |
DB EPS growth (%) |
4.7 |
22.3 |
14.3 |
-88.0 |
15.5 |
10.9 |
EBITDA Margin (%) |
15.3 |
16.8 |
17.1 |
16.9 |
18.3 |
19.1 |
EBIT Margin (%) |
12.3 |
13.8 |
14.3 |
13.9 |
15.3 |
16.1 |
Payout ratio (%) |
43.0 |
43.3 |
43.8 |
407.6 |
407.6 |
407.6 |
ROE (%) |
18.8 |
20.6 |
20.4 |
28.1 |
41.4 |
36.1 |
Capex/sales (%) |
2.6 |
2.7 |
2.6 |
3.2 |
2.8 |
2.8 |
Capex/depreciation (x) |
0.9 |
0.9 |
0.9 |
1.1 |
0.9 |
0.9 |
Net debt/equity (%) |
-4.9 |
-15.5 |
-9.9 |
109.1 |
63.6 |
33.2 |
Net interest cover (x) |
13.1 |
20.1 |
26.2 |
23.8 |
23.3 |
25.7 |
Source: Company data, Deutsche Bank estimates
Page 76 |
Deutsche Bank AG/London |