

DB European Building Construction 2019 Outlook_watermark
.pdfvk.com/id446425943
Deutsche |
Another year of significant EBITDA margin consensus cut in 2018 |
|
|
|
|
|
|
|
|
|
|
|
|
|
|
|
|
|
|
|
|
|
|
|
||||||||||||||||||||||||||||||||||||||
|
|
|
|
|
|
|
|
|
|
|
|
|
|
|
|
|
|
|
|
|
|
|
|
|||||||||||||||||||||||||||||||||||||||
Bank |
|
■ |
|
|
FY 18 EBITDA consensus downgrades for cyclical stocks have mainly been driven by margins rather than top-line cuts. |
|
|
|
|
|
|
|
|
|
||||||||||||||||||||||||||||||||||||||||||||||||
|
■ |
|
|
We believe in particular that the reinflation of coal / oil in Q2 18 after the DM price increase implementation has been particularly detrimental for |
||||||||||||||||||||||||||||||||||||||||||||||||||||||||||
|
|
|
|
|||||||||||||||||||||||||||||||||||||||||||||||||||||||||||
AG/London |
|
|
|
|
|
cement stocks as a second round of price increase has been very di cult to implement. |
|
|
|
|
|
|
|
|
|
|
|
|
|
|
|
|
|
|
|
|
||||||||||||||||||||||||||||||||||||
Figure 70: Consensus margin evolution by sub-sector |
|
|
|
|
|
|
|
|
|
Figure 71: Newcastle Coal evolution vs. future price at end of 2017 |
|
|
|
|||||||||||||||||||||||||||||||||||||||||||||||||
|
|
■ |
|
|
We believe energy price inflation above expectations has caused c50% of Heidelberg EBITDA consensus downgrades in 2018E. |
|
|
|
|
|
|
|||||||||||||||||||||||||||||||||||||||||||||||||||
|
|
|
|
|
|
|
|
|
|
|
|
|
|
|
|
|
|
|
|
|
|
|
|
|
|
|
|
|
|
|
|
|
|
|
|
|
|
|
|
|
|
|
|
|
|
|
|
|
|
|
|
|
|
|
|
|
|
|
|
|
|
|
|
20.0% |
|
|
|
|
|
|
|
|
|
|
|
|
|
|
|
|
|
|
|
|
|
|
|
|
|
|
|
|
130 |
|
|
|
|
|
|
|
|
|
|
|
|
|
|
|
|
|
|
|
|
|
|
|
|
|
|
|
|
|
|||
|
|
|
|
|
|
|
|
|
|
|
|
|
|
|
|
|
|
|
|
|
|
|
|
|
|
|
|
|
|
|
|
|
|
|
|
|
|
|
|
|
|
|
|
|
|
|
|
|
|
|
|
|
|
|
|
|
||||||
|
|
|
|
|
|
|
|
|
|
|
|
|
|
|
|
|
|
|
|
|
|
|
|
|
|
|
|
|
|
|
|
|
|
|
|
|
|
|
|
|
|
|
|
|
|
|
|
|
|
|
|
|
|
|
|
|
|
|
|
|||
|
19.5% |
19.4% |
|
|
|
|
|
|
|
|
|
|
|
|
|
|
|
|
|
|
|
|
|
|
18.9% |
120 |
|
|
|
|
|
|
|
|
|
|
|
|
|
|
|
|
|
|
|
|
|
|
|
|
|
|
|
|
|
|||||||
|
19.0% |
|
|
|
|
|
|
|
|
|
|
|
|
|
|
|
|
|
|
|
|
|
|
|
|
|
|
|
|
|
|
|
|
|
|
|
|
|
|
|
|
|
|
|
|
|
|
|
|
|
|
|
|
|
|
|
|
|||||
|
|
|
|
|
|
|
|
|
|
|
|
|
|
|
|
|
|
|
|
|
|
|
|
|
|
|
|
|
110 |
|
|
|
|
|
|
|
|
|
|
|
|
|
|
|
|
|
|
|
|
|
|
|
|
|
|
|
|
|
||||
|
18.5% |
|
|
|
|
|
|
|
|
|
|
|
|
|
|
|
|
|
|
|
|
|
|
|
|
|
|
|
|
100 |
|
|
|
|
|
|
|
|
|
|
|
|
|
|
|
|
|
|
|
|
|
|
|
|
|
|
|
|
|
|||
|
|
|
|
|
|
|
|
|
|
|
|
|
|
|
|
|
|
|
|
|
|
|
|
|
|
|
|
|
|
|
|
|
|
|
|
|
|
|
|
|
|
|
|
|
|
|
|
|
|
|
|
|
|
|
|
|
|
|
|
|
||
|
18.0% |
|
|
17.6% |
|
|
|
|
|
|
|
|
|
|
|
|
|
|
|
|
|
|
|
|
|
|
|
|
90 |
|
|
|
|
|
|
|
|
|
|
|
|
|
|
|
|
|
|
|
|
|
|
|
|
|
|
|
|
|
||||
|
|
|
|
|
|
|
|
|
|
|
|
|
|
|
|
|
|
|
|
|
|
|
|
|
|
|
|
|
|
|
|
|
|
|
|
|
|
|
|
|
|
|
|
|
|
|
|
|
|
|
|
|
|
|
|
|
|
|
||||
|
17.5% |
|
|
|
|
|
|
|
|
|
|
|
|
|
|
|
|
|
|
|
|
|
|
|
|
|
|
|
|
80 |
|
|
|
|
|
|
|
|
|
|
|
|
|
|
|
|
|
|
|
|
|
|
|
|
|
|
|
|
|
|||
|
|
|
|
|
|
|
|
|
|
|
|
|
|
|
|
|
|
|
|
|
|
|
|
|
|
|
|
|
|
|
|
|
|
|
|
|
|
|
|
|
|
|
|
|
|
|
|
|
|
|
|
|
|
|
|
|
|
|
|
|
||
|
17.0% |
|
|
|
|
|
|
|
|
|
|
|
|
|
|
|
|
|
|
|
|
|
|
|
|
|
|
|
|
70 |
|
|
|
|
|
|
|
|
|
|
|
|
|
|
|
|
|
|
|
|
|
|
|
|
|
|
|
|
|
|||
|
16.5% |
|
|
|
|
|
|
|
|
|
|
|
|
|
|
|
|
|
|
|
|
|
|
|
|
|
|
|
|
|
|
|
|
|
|
|
|
|
|
|
|
|
|
|
|
|
|
|
|
|
|
|
|
|
|
|
|
|
||||
|
|
|
|
|
|
|
|
|
|
|
|
|
|
|
|
|
|
|
|
|
|
|
|
|
|
16.2% |
|
|
|
|
|
|
|
|
|
|
|
|
|
|
|
|
|
|
|
|
|
|
|
|
|
|
|
|
|
|
|
|||||
|
16.0% |
|
|
|
|
|
|
|
|
|
|
|
|
|
|
|
|
|
|
|
|
|
|
|
|
|
|
|
|
60 |
|
|
|
|
|
|
|
|
|
|
|
|
|
|
|
|
|
|
|
|
|
|
|
|
|
|
|
|
|
|||
|
|
|
|
|
|
|
|
|
|
|
|
|
|
|
|
|
|
|
|
|
|
|
|
|
|
|
|
|
|
Jan-17 |
Feb-17 |
Mar-17 |
Apr-17 |
May-17 |
Jun-17 |
Jul-17 |
Aug-17 |
Sep-17 |
Oct-17 |
Nov-17 |
Dec-17 |
Jan-18 |
Feb-18 |
Mar-18 |
Apr-18 |
May-18 |
Jun-18 |
Jul-18 |
Aug-18 |
Sep-18 |
Oct-18 |
Nov-18 |
||||||||||
|
Jan-18 |
Jan-18 |
|
Jan-18 |
Feb-18 |
Feb-18 |
Mar-18 |
Mar-18 |
Apr-18 |
Apr-18 |
May-18 |
May-18 |
Jun-18 |
Jun-18 |
Jul-18 |
Jul-18 |
Jul-18 |
Aug-18 |
Aug-18 |
Sep-18 |
Sep-18 |
Oct-18 |
Oct-18 |
Nov-18 |
|
|
|
|||||||||||||||||||||||||||||||||||
|
|
|
|
|
|
|
|
|||||||||||||||||||||||||||||||||||||||||||||||||||||||
|
|
|
|
|
|
|
|
|
|
Average - Cyclical stocks |
|
|
|
|
|
Average - Structural stocks |
|
|
|
|
|
|
|
|
|
|
|
|
|
|
Newcastle spot price |
|
|
|
|
Newcastle future price as of Nov 17 |
|
|
|
|||||||||||||||||||||||
|
|
|
|
|
|
|
|
|
|
|
|
|
|
|
|
|
|
|
|
|
|
|
|
|
|
|
|
|
|
|
|
|
|
|
|
|||||||||||||||||||||||||||
|
|
|
|
|
|
|
|
|
|
|
|
|
|
|
|
|
|
|
|
|
|
|
|
|
|
|
|
|
|
|
|
|
|
|
|
|
|
|
|
|
|
|
|
|
|
|
|
|
|
|
||||||||||||
|
Source: Deutsche Bank, Bloomberg Finance LP. |
|
|
|
|
|
|
|
|
|
|
|
|
|
|
|
|
|
|
Source: Deutsche Bank, Factset, Bloomberg Finance LP |
|
|
|
|
|
|
|
|
|
|
|
|
|
|
|
|
||||||||||||||||||||||||||
|
|
|
|
|
|
|
|
|
|
|
|
|
|
|
|
|
|
|
|
|
|
|
|
|
|
|
|
|
|
|
|
|
|
|
||||||||||||||||||||||||||||
|
|
|
|
|
|
|
|
|
|
|
|
|
|
|
|
|
|
|
||||||||||||||||||||||||||||||||||||||||||||
|
|
|
|
|
|
|
|
|
|
|
|
|
|
|
|
|
|
|
||||||||||||||||||||||||||||||||||||||||||||
|
Figure 72: Oil price evolution vs. forecasts end of 2017 |
|
|
|
|
|
|
|
|
|
Figure 73: Reconciliation Heidelberg EBITDA consensus evolution YTD |
|||||||||||||||||||||||||||||||||||||||||||||||||||
|
85 |
|
|
|
|
|
|
|
|
|
|
|
|
|
|
|
|
|
|
|
|
|
|
|
|
|
|
|
|
|
|
3,700 |
|
|
|
|
|
|
|
|
|
|
|
|
|
|
|
|
|
|
|
|
|
|
|
|
|
|
|
|||
|
80 |
|
|
|
|
|
|
|
|
|
|
|
|
|
|
|
|
|
|
|
|
|
|
|
|
|
|
|
|
|
|
3,600 |
|
|
3,569 |
|
|
80 |
|
|
|
|
|
|
|
|
|
|
|
|
|
|
|
|
|
|
|
|||||
|
|
|
|
|
|
|
|
|
|
|
|
|
|
|
|
|
|
|
|
|
|
|
|
|
|
|
|
|
|
|
|
|
|
|
|
|
|
|
|
|
|
|
|
|
|
|
|
|
|
|
|
|
|
|
|
|
|
|||||
|
75 |
|
|
|
|
|
|
|
|
|
|
|
|
|
|
|
|
|
|
|
|
|
|
|
|
|
|
|
|
|
|
3,500 |
|
|
|
|
|
|
|
|
|
|
160 |
|
|
|
|
|
|
|
|
|
|
|
|
|
|
|
|
|||
|
|
|
|
|
|
|
|
|
|
|
|
|
|
|
|
|
|
|
|
|
|
|
|
|
|
|
|
|
|
|
|
|
|
|
|
|
|
|
|
|
|
|
|
|
|
|
|
|
|
|
|
|
|
|
|
|
|
|
||||
|
70 |
|
|
|
|
|
|
|
|
|
|
|
|
|
|
|
|
|
|
|
|
|
|
|
|
|
|
|
|
|
|
3,400 |
|
|
|
|
|
|
|
|
|
|
|
|
|
|
|
|
|
|
|
|
|
|
|
|
|
|
|
|||
|
|
|
|
|
|
|
|
|
|
|
|
|
|
|
|
|
|
|
|
|
|
|
|
|
|
|
|
|
|
|
|
|
|
|
|
|
|
|
|
|
|
|
|
|
100 |
|
|
|
|
|
|
|
|
|
|
|
|
|
||||
|
65 |
|
|
|
|
|
|
|
|
|
|
|
|
|
|
|
|
|
|
|
|
|
|
|
|
|
|
|
|
|
|
|
|
|
|
|
|
|
|
|
|
|
|
|
|
|
|
|
|
|
|
|
|
|
|
|
|
|
|
|
|
|
|
|
|
|
|
|
|
|
|
|
|
|
|
|
|
|
|
|
|
|
|
|
|
|
|
|
|
|
|
|
|
3,300 |
|
|
|
|
|
|
|
|
|
|
|
|
|
|
|
|
|
|
|
|
|
|
|
|
|
|
|
||||
|
|
|
|
|
|
|
|
|
|
|
|
|
|
|
|
|
|
|
|
|
|
|
|
|
|
|
|
|
|
|
|
|
|
|
|
|
|
|
|
|
|
|
|
|
|
|
|
|
90 |
|
|
|
|
|
|
|
|
|
||||
|
60 |
|
|
|
|
|
|
|
|
|
|
|
|
|
|
|
|
|
|
|
|
|
|
|
|
|
|
|
|
|
|
|
|
|
|
|
|
|
|
|
|
|
|
|
|
|
|
|
|
|
|
|
|
|
|
|
|
|
|
|
|
|
|
|
|
|
|
|
|
|
|
|
|
|
|
|
|
|
|
|
|
|
|
|
|
|
|
|
|
|
|
|
|
3,200 |
|
|
|
|
|
|
|
|
|
|
|
|
|
|
|
|
|
|
|
|
|
|
|
|
|
|
|
||||
|
55 |
|
|
|
|
|
|
|
|
|
|
|
|
|
|
|
|
|
|
|
|
|
|
|
|
|
|
|
|
|
|
|
|
|
|
|
|
|
|
c10% energy cost |
|
|
|
|
|
|
|
|
51 |
|
|
|
|
|
|
|||||||
|
|
|
|
|
|
|
|
|
|
|
|
|
|
|
|
|
|
|
|
|
|
|
|
|
|
|
|
|
|
|
|
|
|
|
|
|
|
|
|
|
|
|
|
|
|
|
|
|
|
|
|
|
3,088 |
|
|
|
||||||
|
|
|
|
|
|
|
|
|
|
|
|
|
|
|
|
|
|
|
|
|
|
|
|
|
|
|
|
|
|
|
3,100 |
|
|
|
|
|
|
|
|
inflation for FY 18E |
|
|
|
|
|
|
|
|
|
|
|
|
|
|
||||||||
|
50 |
|
|
|
|
|
|
|
|
|
|
|
|
|
|
|
|
|
|
|
|
|
|
|
|
|
|
|
|
|
|
|
|
|
|
|
|
|
|
|
|
|
|
|
|
|
|
|
|
|
|
|
|
|
||||||||
|
|
|
|
|
|
|
|
|
|
|
|
|
|
|
|
|
|
|
|
|
|
|
|
|
|
|
|
|
|
|
3,000 |
|
|
|
|
|
|
|
|
|
|
|
|
|
|
|
|
|
|
|
|
|
|
|
|
|
|
|
||||
|
45 |
|
|
|
|
|
|
|
|
|
|
|
|
|
|
|
|
|
|
|
|
|
|
|
|
|
|
|
|
|
|
|
|
|
|
|
|
|
|
|
|
|
|
|
|
|
|
|
|
|
|
|
|
|
|
|
|
|
||||
|
|
|
|
|
|
|
|
|
|
|
|
|
|
|
|
|
|
|
|
|
|
|
|
|
|
|
|
|
|
|
|
|
|
|
|
|
|
|
|
|
|
|
|
|
|
|
|
|
|
|
|
|
|
|
|
|
|
|
|
|
|
|
|
40 |
|
|
|
|
|
|
|
|
|
|
|
|
|
|
|
|
|
|
|
|
|
|
|
|
|
|
|
|
|
|
2,900 |
|
|
|
|
|
|
|
|
|
|
|
|
|
|
|
|
|
|
|
|
|
|
|
|
|
|
|
|||
|
|
|
17-Jan |
17-Feb |
17-Mar |
17-Apr |
17-May |
17-Jun |
17-Jul |
17-Aug |
17-Sep |
17-Oct |
17-Nov |
17-Dec |
18-Jan |
18-Feb |
18-Mar |
18-Apr |
18-May |
18-Jun |
18-Jul |
18-Aug |
18-Sep |
18-Oct |
18-Nov |
2,800 |
|
|
|
|
|
|
|
|
|
|
|
|
quarry sales |
(mainly |
|
|
|
|
|
2018 |
|
|
|
|||||||||||||
|
|
|
|
|
|
|
|
|
|
|
|
|
|
|
|
|
|
|
|
|
|
|
|
|||||||||||||||||||||||||||||||||||||||
|
|
|
|
|
|
|
|
|
|
|
|
|
|
|
|
|
|
|
|
|
|
|
|
|
|
|
|
|
|
|
|
|
|
|
|
|
|
Start of year |
|
FX |
|
Energy costs |
|
Gains on |
|
Q1 miss |
|
Others |
|
As of Nov |
||||||||||||
|
|
|
|
|
|
|
|
|
|
|
Crude oil price ($/bbl) |
|
|
|
|
|
DB forecasts as of Jan 18 |
|
|
|
|
|
|
|
|
|
|
|
|
|
|
|
|
|
|
|
|
|
|
|
|
|
weather) |
|
|
|
|
|
|
|
|
|
||||||||||
|
|
|
|
|
|
|
|
|
|
|
|
|
|
|
|
|
|
|
|
|
|
|
|
|
|
|
|
|
|
|
|
|
|
|
|
|
|
|
|
|
|
|
|
|
|
|
|
|
|
|
|
|||||||||||
|
Source: Deutsche Bank, Factset, Bloomberg Finance LP |
|
|
|
|
|
|
|
|
|
|
|
|
|
|
|
|
|
Source: Deutsche Bank, Bloomberg Finance LP |
|
|
|
|
|
|
|
|
|
|
|
|
|
|
|
|
|
||||||||||||||||||||||||||
|
|
|
|
|
|
|
|
|
|
|
|
|
|
|
|
|
|
|
|
|
|
|
|
|
|
|
|
|
|
|
|
|
|
|
||||||||||||||||||||||||||||
|
|
|
|
|
|
|
|
|
|
|
|
|
|
|
|
|
|
|
|
|
|
|
|
|
|
|
|
|
|
|
|
|
|
|
|
|
|
|
|
|
|
|
|
|
|
|
|
|
|
|
|
|
|
|
|
|
|
|
|
|
|
|
31 Page
Building European |
2018 December 3 Materials Building |
Construction & |
|

vk.com/id446425943
32 Page |
EBITDA margin consensus cuts since start of year |
|
|
|
|
|
|
|
||||||||
■ |
|
Cement companies and Tarkett have seen the highest EBITDA margins downgrade due to a high inflation environment coupled with a limited ability |
||||||||||||||
|
|
|
|
to adjust price over the course of the year. |
|
|
|
|
|
|
|
|
|
|||
|
|
|
|
|
|
|
|
|||||||||
|
Figure 74: Cyclical stocks have had lower pricing power vs. structural growth stocks in 2018 |
|
|
|
|
|||||||||||
|
|
|
|
Cemex |
Heidelberg |
Tarkett |
Buzzi |
Titan |
LafargeHolcim |
Saint Gobain |
Sika |
Geberit |
CRH |
Kingspan |
||
|
0.0% |
|
|
|
|
|
|
|
|
|
|
|
|
|
|
|
|
|
|
|
|
|
|
|
|
|
|
|
|
-0.3% |
|
|
|
|
-0.5% |
|
|
|
|
|
|
|
|
|
|
-0.3% |
-0.3% |
|
|
|
|
|
|
|
|
|
|
|
|
|
|
-0.5% |
|
|
|
|
|
|
|
|
|
|
|
|
|
|
|
-0.6% |
|
|
|
|
|
|
|
|
|
|
|
|
|
|
|
|
|
|
|
|
|
|
|
|
-1.0% |
|
|
|
|
|
|
|
|
|
|
|
|
|
|
|
|
|
|
|
|
|
|
|
|
-1.1% |
|
|
|
|
|
|
|
|
-1.5% |
|
|
|
|
|
|
|
|
|
|
|
|
|
|
|
|
|
|
|
|
|
|
|
-1.6% |
|
|
|
|
|
|
|
|
|
-2.0% |
|
|
|
|
-1.9% |
-1.9% |
|
|
|
|
|
|
|
|
|
|
|
|
|
|
|
|
|
|
|
|
|
|
|
|
||
|
-2.5% |
|
|
-2.3% |
-2.3% |
|
|
|
|
|
|
|
|
|
|
|
|
|
|
|
|
|
|
|
|
|
|
|
|
||||
|
Source:Deutsche Bank estimates, Company data |
|
|
|
|
|
|
|
|
|
|
|
||||
|
|
|
|
|
|
|
|
|
|
|
|
|||||
|
|
|
|
|
|
|
|
|
|
|
|
|
|
|
|
|
AG/London Bank Deutsche
Building European |
2018 December 3 Materials Building |
Construction & |
|

vk.com/id446425943
Deutsche |
Costs to follow di erentiated patterns in 2019 |
|
|
|||
|
|
|
||||
|
■ |
Heavyside stocks (exposure to Electricity in Europe and US / International coal) should continue to see a high inflation environment in H1 19 (around |
||||
Bank |
|
c10% energy cost inflation forecasted) before a moderation in H2 19. |
|
|
||
■ |
Lightside products (mostly oil derivatives, limited energy cost exposure) should also see a continuation of cost inflation until at least Q1 19 (four to |
|||||
AG/London |
||||||
|
six months lag between oil price and oil derivatives prices evolution). |
|
|
|||
|
|
|
|
|||
|
■ |
The low levels of the Rhine river in Germany could also cause some supply disruption and switch to more expensive alternative suppliers. |
||||
|
|
|
|
|
||
|
Figure 75: Electricity prices in Europe (2018 = 100) |
Figure 76: Coal & Natural gas price evolution (2018 = 100) |
||||
150 |
|
|
|
|
|
|
|
|
|
|
|
|
|
|
|
|
|
|
|
|
|
|
150 |
|
|
|
|
|
|
|
|
|
|
|
|
|
|
|
|
|
|
|
|
|
|
|
|
|
|
|
|
|
|
|
|
140 |
|
|
|
|
|
|
|
|
|
135 |
|
140 |
|
|
|
|
|
|
|
|
|
|
|
|
|
|
|
|
|
|
|
|
|
|
|
|
|
|
|
|
|
|
|
||
|
|
|
|
|
|
|
|
|
|
|
|
|
|
|
|
|
|
|
|
|
|
130 |
|
|
|
|
|
|
|
|
|
|
|
130 |
|
|
|
|
|
|
|
|
|
|
|
|
|
|
|
|
|
|
|
|
|
|
|
|
|
|
|
|
|
|
|
|
|
|
|
|
|
|
|
|
|
|
|
|
|
|
|
|
|
|
|
|
|
|
|
120 |
|
|
|
|
|
|
|
|
|
116 |
|
120 |
|
|
|
|
|
|
|
|
|
|
|
|
|
|
|
|
|
|
|
|
|
|
|
|
|
|
|
|
|
|
|
||
|
|
|
|
|
|
|
|
|
|
|
|
|
|
|
|
|
|
|
|
|
|
|
|
|
|
|
|
|
|
|
|
||
|
|
|
|
|
|
|
|
|
|
|
|
|
|
|
|
|
|
|
|
|
|
110 |
|
|
|
|
|
|
|
|
|
|
|
110 |
|
|
|
|
|
|
|
|
|
|
|
|
|
|
|
|
|
|
|
|
|
|
|
|
|
|
|
|
|
|
|
|
|
|
|
|
|
|
|
|
|
|
|
|
|
|
|
|
|
|
|
|
|
|
|
100 |
|
|
|
|
|
|
|
|
|
94 |
|
100 |
|
|
|
|
|
|
|
|
|
|
|
|
|
|
|
|
|
|
|
|
|
|
|
|
|
|
|
|
|
|
|
||
|
|
|
|
|
|
|
|
|
|
|
|
|
|
|
|
|
|
|
|
|
|
90 |
|
|
|
|
|
|
|
|
|
|
|
90 |
|
|
|
|
|
|
|
|
|
|
|
|
|
|
|
|
|
|
|
|
|
|
|
|
|
|
|
|
|
|
|
93 |
|
|
|
|
|
|
|
|
|
|
|
|
|
|
|
|
|
|
|
|
|
|
|
80 |
|
|
|
|
|
|
|
|
|
||
80 |
|
|
|
|
|
|
|
|
|
|
|
|
|
|
|
|
|
|
|
|
|
|
|
|
|
|
|
|
|
|
|
|
|
|
|
|
|
|
|
|
|
|
|
|
|
|
|
|
|
|
|
|
|
|
|
70 |
|
|
|
|
|
|
|
|
|
|
|
70 |
|
|
|
|
|
|
|
|
|
|
|
|
|
|
|
|
|
|
|
|
|
|
|
|
|
|
|
|
|
|
|
|
|
|
|
|
|
|
|
|
|
|
|
|
|
|
|
|
|
|
|
|
|
|
|
60 |
|
|
|
|
|
|
|
|
|
|
|
60 |
|
|
|
|
|
|
|
|
|
|
|
|
|
|
|
|
|
|
|
|
|
|
Feb-18 |
Mar-18 |
Apr-18 |
May-18 |
|
Jul-18 |
Aug-18 |
Sep-18 |
Oct-18 |
Nov-18 |
|
|
Jan-18 |
|
|
|
|
|
|
|
|
Jun-18 |
Jun-18 |
Jul-18 |
Jul-18 |
Jul-18 |
|
|
|
|
|
|
|
Jan-18 |
Jun-18 |
||||||||||
Jan-18 |
Jan-18 |
Feb-18 |
Feb-18 |
Mar-18 |
Mar-18 |
Apr-18 |
Apr-18 |
May-18 |
May-18 |
Aug-18 |
Aug-18 |
Sep-18 |
Sep-18 |
Oct-18 |
Oct-18 |
Nov-18 |
|||||||||||||||||
|
France |
|
Italy |
|
Belgium |
|
|
Germany |
|
|
Poland |
|
Nordics |
|
|
UK |
|
Newcastle Coal |
|
|
|
|
Rotterdam Coal |
|
|
||||||||
|
|
|
|
|
|
|
|
|
|
|
Natural Gas (US) |
|
|
|
|
Central Appalachian coal |
|
||||||||||||||||
|
|
|
|
|
|
|
|
|
|
|
|
|
|
|
|
|
|
|
|
|
|
|
|
|
|
|
|
|
|||||
Source: Deutsche Bank, Factset, Bloomberg Finance LP |
|
|
|
|
|
|
|
|
|
|
|
|
|
|
Source: Deutsche Bank, Factset, Bloomberg Finance LP. Nov 2018 index as of 26 Nov closing. |
|
|
|
|||||||||||||||
Figure 77: Oil and oil derivate product prices (2018 = 100)
120 |
|
|
|
|
|
|
|
|
|
|
115 |
|
|
|
|
|
|
|
|
|
|
110 |
|
|
|
|
|
|
|
|
|
|
105 |
|
|
|
|
|
|
|
|
|
|
100 |
|
|
|
|
|
|
|
|
|
98 |
|
|
|
|
|
|
|
|
|
|
|
95 |
|
|
|
|
|
|
|
|
|
94 |
90 |
|
|
|
|
|
|
|
|
|
90 |
85 |
|
|
|
|
|
|
|
|
|
86 |
80 |
|
|
|
|
|
|
|
|
|
83 |
75 |
|
|
|
|
|
|
|
|
|
|
70 |
|
|
Apr-18 |
May-18 |
|
|
Aug-18 |
Sep-18 |
Oct-18 |
Nov-18 |
Jan-18 |
Feb-18 |
Mar-18 |
Jun-18 |
Jul-18 |
||||||
|
Brent Crude |
|
|
|
|
|
Naphta |
|
|
|
|
Polyethytlene linear low density |
|
|
MDI W Europe |
|
|
||||
Polystyrene General purpose
Source: Deutsche Bank, Factset, Bloomberg Finance LP. Nov 2018 index as of 26 Nov closing.
33 Page
Figure 78: Miscellaneous commodities' prices (2018 = 100)
115 |
|
|
|
|
|
|
|
|
|
|
|
110 |
|
|
|
|
|
|
|
|
|
||||
|
|
|
|
|
|
|
|
|
|
|
|
|
110 |
|
|
|
|
|
|
|
|
|
|
|
|
105 |
|
|
|
|
|
|
|
|
|
|
|
102 |
|
|
|
|
|
|
|
|
|
|
|
|
|
100 |
|
|
|
|
|
|
|
|
|
|
|
100 |
|
|
|
|
|
|
|
|
|
|
|
|
98 |
95 |
|
|
|
|
|
|
|
|
|
|
|
94 |
|
|
|
|
|
|
|
|
|
|
|
|
|
90 |
|
|
|
|
|
|
|
|
|
|
|
|
85 |
|
|
|
|
|
|
|
|
|
|
|
|
|
Jan-18 Feb-18 |
Mar-18 |
Apr-18 May-18 Jun-18 |
Jul-18 Aug-18 |
Sep-18 Oct-18 |
|||||||
|
|
|
||||||||||
|
|
|
|
Paper |
|
|
Steel |
|
|
Polyurethane |
PVC |
Cast iron |
|
|
|
|
|
|
|
||||||
Source: Deutsche Bank, Factset, Bloomberg Finance LP
Building European |
2018 December 3 Materials Building |
Construction & |
|

vk.com/id446425943
34 Page |
Negative cement price vs. cost in H2 18 does not bode well for H1 19. |
|
|
|
|
|
|
|
|
|
|
|
|
|
|
|
|
|
|
|
|||||||||||||||||||||||||||||||||
■ |
We expect price vs. cost to remain in general negative in H1 19E: energy costs inflation should remain at an elevated level while most prices increases |
||||||||||||||||||||||||||||||||||||||||||||||||||||
|
|
|
|
|
|
in DM should be implemented only in April with full impact to be seen only in Q3. |
|
|
|
|
|
|
|
|
|
|
|
|
|
|
|
|
|
|
|
|
|
||||||||||||||||||||||||||
|
■ |
Among cement stocks, we believe Buzzi (thanks to Germany, Italy and Poland) should be the only one with a positive price vs. cost in H2 18E. |
|||||||||||||||||||||||||||||||||||||||||||||||||||
|
|
|
|
|
|
|
|
|
|
|
|
|
|
|
|
|
|
|
|
|
|
|
|
|
|
|
|
|
|
|
|
|
|
||||||||||||||||||||
|
Figure 79: Price vs. cost in negative territories for cement stocks since |
|
Figure 80: Energy cost inflation should remain high at least until Q2 19 |
||||||||||||||||||||||||||||||||||||||||||||||||||
|
H1 17 |
|
|
|
|
|
|
|
|
|
|
|
|
|
|
|
|
|
|
|
|
|
|
(example of Heidelberg) |
|
|
|
|
|
|
|
|
|
|
|
|
|
|
|
|
|
|
|||||||||||
|
4% |
|
|
|
|
|
|
|
|
|
|
|
|
|
|
|
|
|
|
|
|
|
|
|
|
|
130 |
|
|
|
|
|
|
|
|
|
|
|
|
|
|
|
|
|
|
|
|
|
|
14% |
|
||
|
3% |
|
|
|
|
|
|
|
|
|
|
|
|
|
|
|
|
|
|
|
|
|
|
|
|
|
125 |
|
|
|
|
|
|
|
|
|
|
|
|
|
|
|
|
|
|
|
|
|
|
12% |
|
||
|
|
|
|
|
|
|
|
|
|
|
|
|
|
|
|
|
|
|
|
|
|
|
|
|
|
|
|
|
|
|
|
|
|
|
|
|
|
|
|
|
|
|
|
|
|
|
|
|
|
|
|
||
|
2% |
|
|
|
|
|
|
|
|
|
|
|
|
|
|
|
|
|
|
|
|
|
|
|
|
|
120 |
|
|
|
|
|
|
|
|
|
|
|
|
|
|
|
|
|
|
|
|
|
|
10% |
|
||
|
|
|
|
|
|
|
|
|
|
|
|
|
|
|
|
|
|
|
|
|
|
|
|
|
|
|
|
|
|
|
|
|
|
|
|
|
|
|
|
|
|
|
|
|
|
|
|
|
|
|
|||
|
1% |
|
|
|
|
|
|
|
|
|
|
|
|
|
|
|
|
|
|
|
|
|
|
|
|
|
115 |
|
|
|
|
|
|
|
|
|
|
|
|
|
|
|
|
|
|
|
|
|
|
8% |
|
||
|
|
|
|
|
|
|
|
|
|
|
|
|
|
|
|
|
|
|
|
|
|
|
|
|
|
|
|
|
|
|
|
|
|
|
|
|
|
|
|
|
|
|
|
|
|
|
|
|
|
|
|||
|
0% |
|
|
|
|
|
|
|
|
|
|
|
|
|
|
|
|
|
|
|
|
|
|
|
|
|
110 |
|
|
|
|
|
|
|
|
|
|
|
|
|
|
|
|
|
|
|
|
|
|
|
|
|
|
|
|
|
|
|
|
|
|
|
|
|
|
|
|
|
|
|
|
|
|
|
|
|
|
|
|
105 |
|
|
|
|
|
|
|
|
|
|
|
|
|
|
|
|
|
|
|
|
|
|
6% |
|
|||
|
|
|
|
|
|
|
|
|
|
|
|
|
|
|
|
|
|
|
|
|
|
|
|
|
|
|
|
|
|
|
|
|
|
|
|
|
|
|
|
|
|
|
|
|
|
|
|||||||
|
|
|
|
|
|
|
|
|
|
|
|
|
|
|
|
|
|
|
|
|
|
|
|
|
|
|
|
|
|
|
|
|
|
|
|
|
|
|
|
|
|
|
|
|
|
|
|
|
|
|
|
||
|
-1% |
|
|
|
|
|
|
|
|
|
|
|
|
|
|
|
|
|
|
|
|
|
|
|
|
|
100 |
|
|
|
|
|
|
|
|
|
|
|
|
|
|
|
|
Energy cost inflation |
|
|
|
4% |
|
||||
|
|
|
|
|
|
|
|
|
|
|
|
|
|
|
|
|
|
|
|
|
|
|
|
|
|
|
|
|
|
|
|
|
|
|
|
|
|
|
|
|
|
|
|
|
|
||||||||
|
|
|
|
|
|
|
|
|
|
|
|
|
|
|
|
|
|
|
|
|
|
|
|
|
|
|
|
|
|
|
|
|
|
|
|
|
|
|
|
|
|
|
Energy cost inflation |
|
|
|
|
|
|||||
|
-2% |
|
|
|
|
|
|
|
|
|
|
|
|
|
|
|
|
|
|
|
|
|
|
|
|
|
95 |
|
|
|
|
|
|
|
|
|
|
|
|
|
|
|
|
should remain high |
|
|
|
2% |
|
||||
|
|
|
|
|
|
|
|
|
|
|
|
|
|
|
|
|
|
|
|
|
|
|
|
|
|
|
|
|
|
|
|
|
|
|
|
|
|
|
|
|
|
|
should remain high |
|
|
|
|
||||||
|
-3% |
|
|
|
|
|
H2 16 |
|
|
|
H1 17 |
|
|
|
H2 17 |
|
|
|
H1 18 |
|
H2 18E |
90 |
|
|
|
|
|
|
|
|
|
|
|
|
|
|
|
|
|
|
|
|
|
|
|
0% |
|
||||||
|
|
|
|
|
|
|
|
|
|
|
|
|
|
|
|
|
|
|
|
|
|
|
|
|
|
|
|
|
|
|
|
|
|
|
|
|
|
|
|
||||||||||||||
|
|
|
|
|
|
|
|
|
|
|
|
|
|
|
|
|
|
|
|
Q1 16 |
Q2 16 |
Q3 16 |
Q4 16 |
Q1 17 |
Q2 17 |
Q3 17 |
Q4 17 |
Q1 18 |
Q2 18 |
|
Q3 18 |
Q4 18E |
Q1 19E |
Q2 19E |
Q3 19E |
Q4 19E |
|||||||||||||||||
|
|
|
|
|
|
|
Buzzi |
|
|
|
Cemex |
|
|
|
CRH |
|
|
|
Heidelberg |
|
LafargeHolcim |
|
|
|
|
|
|
|
YoY increase (rhs,%) |
|
|
|
|
|
|
Energy cost Index HEI (lhs) |
|
|
|
|
|||||||||||||
|
|
|
|
|
|
|
|
|
|
|
|
|
|
|
|
|
|
|
|
|
|
|
|
|
|
|
|
|
|
|
|
|
|
||||||||||||||||||||
|
Source: Deutsche Bank, Company data, Bloomberg Finance LP |
|
|
|
|
|
|
|
|
Source: Deutsche Bank, Bloomberg Finance LP |
|
|
|
|
|
|
|
|
|
|
|
|
|
|
|
|
|
|
|||||||||||||||||||||||||
|
|
|
|
|
|
|
|
|
|
|
|
|
|
|
|
|
|
|
|
|
|
|
|
|
|
|
|||||||||||||||||||||||||||
|
|
|
|
|
|
|
|
|
|
|
|
|
|
|
|
|
|
|
|
|
|
|
|
|
|
|
|
|
|
|
|
|
|
|
|
|
|
|
|
|
|
|
|
|
|
|
|
|
|
|
|
|
|
AG/London Bank Deutsche
Building European |
2018 December 3 Materials Building |
Construction & |
|

vk.com/id446425943
Deutsche |
LafargeHolcim to benefit from self-help in 2019. |
|
|
||||||
|
|
|
|||||||
Bank |
■ |
Reflecting disappointing results in 2017-18, most ‘cyclical growth’ companies have announced new costs savings program. |
|||||||
■ |
We believe the impact should be visible in 2019 mostly for LafargeHolcim (we estimate a positive impact of CHF250m in 2019 of SG&A savings, eg |
||||||||
|
|||||||||
AG/London |
|
4% of FY 19E EBITDA). This does not take into account potential savings from potential downstream businesses margins improvement. |
|||||||
■ |
Between synergies and business improvement measures, CRH has the most ambitious cost savings program over the 2019-21 period. However the |
||||||||
|
|||||||||
|
|
benefits are expected to be back end-loaded with only E40m of synergies expected in 2019 (c1% of Group EBITDA). |
|||||||
|
|
|
|
||||||
|
Figure 81: LafargeHolcim should benefit from self help the most |
|
|
||||||
|
|
|
|
|
|
|
|
|
|
|
|
|
Total cost |
|
Assumed |
% FY 19E |
|
|
|
|
Company |
Timescale |
impact in |
Comments |
|
||||
|
cutting target |
EBITDA |
|
||||||
|
|
|
|
2019E |
|
|
|||
|
|
|
|
|
|
|
|
||
|
|
Buzzi |
N/A |
N/A |
N/A |
N/A |
Synergies in newly German asset could bring E5-10m of fixed costs savings (c1.5% FY 19E EBITDA) |
|
|
|
|
Cemex |
$150m |
2019-20 |
$75m |
2.8% |
Stronger Cemex plan announced in Q2 18 focused on SG&A, process and procurement |
|
|
|
|
CRH |
E450m |
2019-21 |
E40m |
1.1% |
Synergies (E130m) + Business improvement (E325m) however benefits to be back-end loaded |
|
|
|
Heidelberg |
E100m |
2019-20 |
E30m |
1.0% |
SG&A savings target announced after profit warning in Q3 |
|
||
|
LafargeHolcim |
CHF400m |
2018-20 |
CHF250m |
4.2% |
SG&A savings from corp. closures as well as countries / regions |
|
||
|
|
Titan |
N/A |
N/A |
N/A |
N/A |
N/A |
|
|
|
|
Sika |
N/A |
N/A |
N/A |
N/A |
No specific cost cutting besides synergies and margin improvement from recently acquired companies |
|
|
|
|
Geberit |
N/A |
N/A |
N/A |
N/A |
N/A |
|
|
|
|
Tarkett |
N/A |
N/A |
N/A |
N/A |
No specific plan - but on an ongoing basis the company intends to improve productivity by cE40m per year |
|
|
|
Saint Gobain |
E250m |
2019-21 |
E50m |
1.5% |
E250m of additional savings announced on Nov 26 2018 on top of ongoing fixed costs savings program |
|
||
|
Kingspan |
N/A |
N/A |
N/A |
N/A |
No specific cost cutting besides synergies and margin improvement from recently acquired companies |
|
||
|
Source: Deutsche Bank estimates, Company data |
|
|
|
|
|
|||
|
|
|
|
|
|
||||
|
|
|
|
|
|
|
|
|
|
35 Page
Building European |
2018 December 3 Materials Building |
Construction & |
|

vk.com/id446425943
Page |
At spot price, FX to be a tailwind on EURO stocks |
36 |
|
■Reflecting the USD appreciation vs. EUR, we calculate at spot price a positive FX translation impact on 2019E Sales for all EURO reporting stocks.
■We estimate at spot price a negative FX translation impact in 2019 for stocks reporting in CHF or USD. (more so for Cemex, penalized by the c6% Mexican Peso depreciation vs. USD ).
■Key LafargeHolcim EM currencies are holding so far well - Mexico and Argentina are two notable exceptions, however in markets where the local industry has historically been able to compensate currencies depreciation by local price increase.
Figure 82: FX impact on Sales based on geographic footprints |
|
|
|
Figure 83: Key currency rates and expected movements |
|
|||||||||||||
|
|
|
|
|
|
|
|
|
|
|
|
|
|
|
|
|
|
|
4% |
|
|
|
|
|
|
|
|
|
|
|
|
|
|
FY 18E |
FY 19E |
Exp. YoY movement |
|
2.9% |
|
|
|
|
|
|
|
|
|
|
|
|
EUR --> USD |
1.181 |
1.134 |
4.1% |
|
|
3% |
|
2.0% |
|
|
|
|
|
|
|
|
|
|
|
|
|
|
|
|
|
|
1.8% |
|
|
|
|
|
|
|
|
|
|
EUR --> GBP |
0.884 |
0.884 |
-0.1% |
|
|
2% |
|
|
1.3% |
1.3% |
|
|
|
|
|
|
|
|
|
|||||
|
|
|
1.0% |
|
|
|
|
|
|
|
CHF --> USD |
1.022 |
1.001 |
2.1% |
|
|||
|
|
|
|
|
|
|
|
|
|
|
|
|
|
|||||
1% |
|
|
|
|
|
|
0.3% |
|
|
|
|
|
|
|
||||
|
|
|
|
|
|
|
|
|
|
|
|
CHF --> EUR |
0.866 |
0.883 |
-1.9% |
|
||
0% |
|
|
|
|
|
|
|
|
|
|
|
|
|
|
||||
|
|
|
|
|
|
|
|
|
|
|
|
|
CHF --> Nigerian Naira |
369.48 |
364.67 |
1.3% |
|
|
-1% |
|
|
|
|
|
|
|
|
|
|
|
|
|
|
||||
|
|
|
|
|
|
|
|
|
|
|
|
|
CHF --> Indian Rupee |
69.84 |
70.90 |
-1.5% |
|
|
-2% |
|
|
|
|
|
|
|
-0.9% |
-1.3% |
-1.5% |
|
|
|
|
||||
|
|
|
|
|
|
|
|
|
|
|
EUR --> Indonesia Rupee |
16776.9 |
16413.9 |
2.2% |
|
|||
|
|
|
|
|
|
|
|
|
|
|
|
|
|
|||||
|
|
|
|
|
|
|
|
|
|
|
|
|
|
|
||||
-3% |
|
|
|
|
|
|
|
|
|
|
-2.9% |
|
|
USD --> MXN Peso |
19.28 |
20.52 |
-6.0% |
|
|
|
|
|
|
|
|
|
|
|
|
|
|
|
|||||
-4% |
Titan |
CRH |
Tarkett |
Buzzi |
Heidelberg |
Kingspan |
Saint Gobain |
LafargeHolcim |
Sika |
Geberit |
Cemex |
|
|
|
|
|
||
|
|
|
|
|
|
|||||||||||||
Source: Deutsche Bank estimates, Factset |
|
|
|
|
|
|
|
|
|
|
Source: Deutsche Bank estimates, Factset. Note: FY19E assumed to same as that of 26 Nov closing. |
|
|
|||||
|
|
|
|
|
|
|
|
|
|
|
|
|||||||
|
|
|
|
|
|
|
|
|
|
|
|
|
|
|
|
|
|
|
AG/London Bank Deutsche
Building European |
2018 December 3 Materials Building |
Construction & |
|

vk.com/id446425943
Deutsche |
DB forecasts vs. consensus |
|
|
|
|
|
|
|
||||
|
|
|
|
|
|
|
|
|
|
|
|
|
Bank |
■ |
Our 2019E EBITDA forecasts are on average c1% below consensus. |
|
|
|
|
|
|
|
|||
AG/London |
■ |
Our FY 19E EBITDA forecasts for LafargeHolcim are 0.8% above the Street. We believe however that consensus has yet to reflect Holcim Indonesia |
||||||||||
|
■ |
This is especially the case for Geberit (more cautious view on organic sales growth and impact of the recent CHF appreciation vs. EUR) but also on |
||||||||||
|
|
Cemex (Mexican Peso depreciation vs. USD) and Tarkett (more cautious view taken on margins in H1 19). |
|
|
|
|
||||||
|
|
divestment (cCHF110m EBITDA impact) - this would place our forecasts c2.5-3% above consensus for FY 19E. |
|
|
|
|
||||||
|
|
|
|
|
|
|
|
|
|
|
|
|
|
Figure 84: DB estimates vs. consensus |
|
|
|
|
|
|
|
|
|
||
|
|
|
|
|
DB estimates |
|
Consensus |
|
DBe vs. consensus |
|
||
|
Company |
|
Key operating metric |
2019E |
2020E |
2019E |
2020E |
|
2019E |
2020E |
|
|
|
|
|
|
|
|
|
|
|
|
|
|
|
|
Buzzi Unicem |
Recurring EBITDA |
617 |
667 |
614 |
655 |
|
0.6% |
1.8% |
|
|
|
|
Cemex |
|
EBITDA |
2,720 |
2,935 |
2,765 |
2,950 |
|
-1.6% |
-0.5% |
|
|
|
CRH |
|
EBITDA |
3,761 |
4,203 |
3,778 |
4,058 |
|
-0.5% |
3.6% |
|
|
|
Geberit |
|
EBITDA |
885 |
914 |
917 |
961 |
|
-3.5% |
-4.9% |
|
|
|
HeidelbergCement |
EBITDA |
3,218 |
3,433 |
3,231 |
3,407 |
|
-0.4% |
0.8% |
|
|
|
|
Kingspan |
|
EBITA |
496 |
535 |
498 |
543 |
|
-0.4% |
-1.5% |
|
|
|
LafargeHolcim |
Recurring EBITDA |
6,391 |
6,793 |
6,338 |
6,698 |
|
0.8% |
1.4% |
|
|
|
|
Saint Gobain |
EBIT |
3,353 |
3,604 |
3,394 |
3,638 |
|
-1.2% |
-0.9% |
|
|
|
|
Sika |
|
EBIT |
1,145 |
1,263 |
1,150 |
1,285 |
|
-0.4% |
-1.7% |
|
|
|
Tarkett |
|
EBITDA |
295 |
317 |
307 |
337 |
|
-3.8% |
-5.7% |
|
|
|
Titan Cement |
EBITDA |
299 |
332 |
295 |
317 |
|
1.3% |
4.9% |
|
|
|
|
Average |
|
|
|
|
|
|
|
-0.8% |
-0.3% |
|
|
|
|
|
|
|
|
|
|
|
|
|
|
|
Source: Deutsche Bank estimates, Factset. Note: Factset estimates as of 28 Nov.
37 Page
Building European |
2018 December 3 Materials Building |
Construction & |
|

vk.com/id446425943
Page |
Valuation - Sector trades well below mid-cycle |
38 |
|
■After 2018 de-rating, the sector now trades at 13.7x 2019E P/E (vs. 14.9x for mid-cycle level) and 9.0x 2019E EV/EBITDA.
■This hides however a clear skew between ‘cyclical stocks’ (heavyside, Saint Gobain & Tarkett - 11.3x 2019E P/E & 6.8x 2019E EV/EBITDA) and the ‘structural growth stocks’ (Sika, Geberit & Kingspan - 20.4x 2019E P/E & 14.7x 2019E EV/EBITDA).
■Cyclical stocks clealry o er value with 2019E P/E well below mid-cycle levels for most companies. This is especially true for Saint Gobain (2019E P/ E only 19% above the historical trough level seen in 2009).
■Our analysis of Saint Gobain 12m forward P/E vs. European PMI also shows value in the stock. While historically Saint Gobain 12m forward P/E has been very well correlated to the European PMI, we note a clear disconnection between both metrics since mid of 2017 with the current stock's 12m forward P/E more consistent with an European PMI level below 45 (eg a clear recession scenario).
■For structural growth stocks, after YTD strong performance, Kingspan valuation discount vs. other structural growth stocks has faded and is now back to pre-Brexit levels. As such, we believe the stock could be now more vulnerable to any negative news regarding the UK market.
Figure 85: Valuation - European Building & Construction stocks
Company |
Reuters |
Current |
DB |
Upside / |
DB |
Market |
EV/EBITDA (x) |
P/E (x) |
|
FCF Yield |
Dividend Yield |
Net debt / EBITDA (x) |
||||
|
Code |
Price |
Target Price |
downside |
Rating |
Cap (E m) |
2019E |
2020E |
2019E |
2020E |
2019E |
2020E |
2019E |
2020E |
2019E |
2020E |
Cyclical avg. |
|
|
|
17.0% |
|
|
6.8 |
6.0 |
11.3 |
9.5 |
8.6% |
10.5% |
3.4% |
3.8% |
2.0 |
1.6 |
Buzzi Unicem |
BZU.MI |
16.8 |
21.0 |
25.0% |
Buy |
3,453 |
5.1 |
4.1 |
11.8 |
10.0 |
10.1% |
11.2% |
1.2% |
1.6% |
1.2 |
0.6 |
Cemex |
CX.N |
4.9 |
6.0 |
22.0% |
Buy |
6,381 |
6.9 |
6.0 |
10.8 |
7.7 |
13.4% |
17.6% |
na |
na |
3.3 |
2.6 |
CRH |
CRH.I |
24.3 |
28.0 |
15.2% |
Hold |
19,685 |
7.1 |
6.0 |
11.6 |
9.8 |
7.3% |
8.7% |
3.2% |
3.8% |
1.6 |
1.1 |
HeidelbergCement |
HEIG.DE |
59.4 |
72.0 |
21.2% |
Hold |
11,786 |
7.3 |
6.5 |
9.1 |
7.9 |
9.9% |
11.9% |
4.4% |
5.1% |
2.3 |
1.9 |
LafargeHolcim |
LHN.S |
44.8 |
54.0 |
20.5% |
Buy |
23,753 |
7.3 |
6.7 |
11.8 |
10.4 |
7.0% |
8.7% |
4.5% |
4.6% |
2.0 |
1.7 |
Saint Gobain |
SGOB.PA |
32.9 |
43.0 |
30.6% |
Buy |
18,127 |
5.8 |
5.3 |
8.9 |
8.0 |
8.5% |
9.5% |
4.5% |
5.0% |
1.5 |
1.2 |
Tarkett |
TKTT.PA |
21.7 |
20.5 |
-5.4% |
Hold |
1,372 |
7.4 |
6.8 |
13.4 |
11.8 |
5.8% |
6.9% |
3.0% |
3.4% |
2.3 |
1.9 |
Titan Cement |
TTNr.AT |
19.6 |
21.0 |
7.4% |
Hold |
1,582 |
7.7 |
6.5 |
12.9 |
10.6 |
7.1% |
9.2% |
2.8% |
2.8% |
2.1 |
1.5 |
|
|
|
|
|
|
|
|
|
|
|
|
|
|
|
|
|
Structural growth avg. |
|
|
|
21.0% |
|
|
14.7 |
13.5 |
20.4 |
18.9 |
4.6% |
5.1% |
2.1% |
2.3% |
0.8 |
0.5 |
Geberit |
GEBN.S |
385.1 |
430.0 |
11.7% |
Hold |
12,324 |
16.8 |
16.1 |
22.3 |
21.4 |
4.3% |
4.4% |
2.9% |
3.0% |
0.5 |
0.5 |
Kingspan |
KSP.I |
37.7 |
45.0 |
19.4% |
Hold |
6,743 |
13.3 |
11.9 |
18.1 |
16.7 |
4.9% |
5.7% |
1.3% |
1.4% |
0.9 |
0.3 |
Sika |
SIKA.S |
121.3 |
160.0 |
31.9% |
Buy |
15,109 |
13.9 |
12.3 |
20.7 |
18.6 |
4.6% |
5.1% |
2.1% |
2.3% |
1.1 |
0.6 |
Sector average |
|
|
|
18.1% |
|
|
9.0 |
8.0 |
13.7 |
12.1 |
7.5% |
9.0% |
3.0% |
3.3% |
1.7 |
1.3 |
Source: Deutsche Bank estimates, Reuters. Note: Valuation and Current price as of closing of 28 Nov 2018.
AG/London Bank Deutsche
Building European |
2018 December 3 Materials Building |
Construction & |
|
vk.com/id446425943
Deutsche |
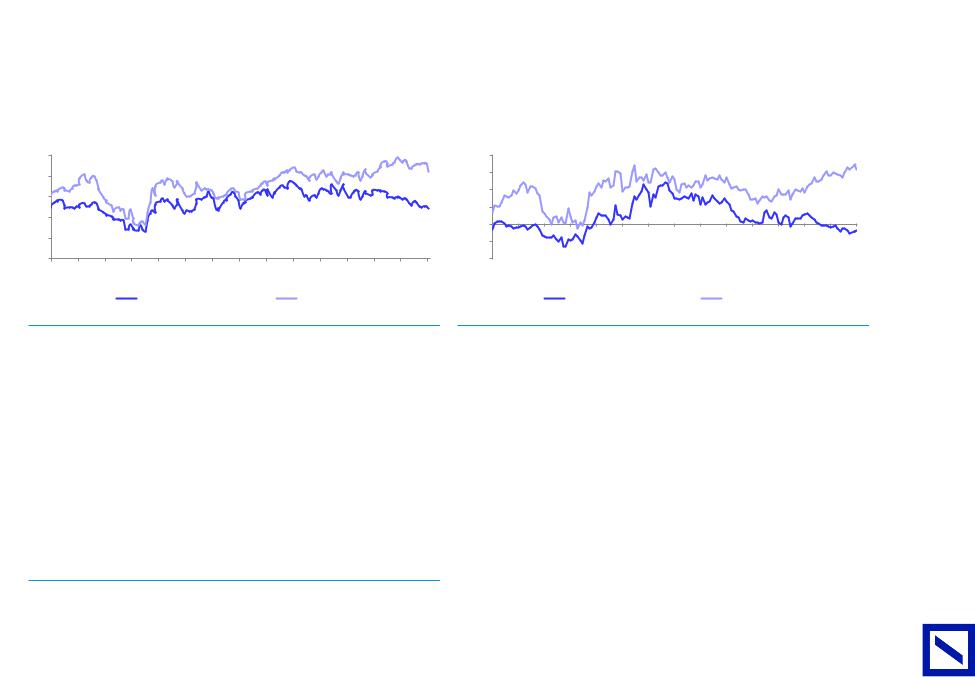
Cyclical stocks have de-rated since start of year |
|
|
|
||
|
|
|
|
|||
Bank |
■ |
Cyclical stocks have clearly de-rated in 2018 and trade for the first time since mid 2009 below average STOXX 600 P/E. |
||||
■ |
Most cyclical stocks 2019E P/E are significantly below mid-cycle level. |
|||||
|
||||||
AG/London |
■ |
In spite of its less cyclical exposure thanks to renovation and increasing geographical diversification, Saint Gobain is the closest to trough valuation |
||||
|
(only 16% downside P/E to trough). |
|
|
|
||
|
|
|
|
|
||
|
|
|
|
|
||
|
Figure 86: 12m forward P/E evolution over the cycle by sub-sector |
|
Figure 87: 12m forward P/E by sub-sector relative to the market |
|||
|
|
|
|
|
|
|
25 |
|
|
|
|
|
|
|
|
|
|
|
|
|
|
80% |
|
|
|
|
|
|
|
|
|
|
|
|
|
|
20 |
|
|
|
|
|
|
|
|
|
|
|
|
|
|
60% |
|
|
|
|
|
|
|
|
|
|
|
|
|
|
|
|
|
|
|
|
|
|
|
|
|
|
|
|
|
|
|
|
|
|
|
|
|
|
|
|
|
|
|
|
15 |
|
|
|
|
|
|
|
|
|
|
|
|
|
|
40% |
|
|
|
|
|
|
|
|
|
|
|
|
|
|
|
|
|
|
|
|
|
|
|
|
|
|
|
|
|
|
|
|
|
|
|
|
|
|
|
|
|
|
|
|
|
|
|
|
|
|
|
|
|
|
|
|
|
|
|
20% |
|
|
|
|
|
|
|
|
|
|
|
|
|
|
10 |
|
|
|
|
|
|
|
|
|
|
|
|
|
|
0% |
|
|
|
|
|
|
|
|
|
|
|
|
|
|
|
|
|
|
|
|
|
|
|
|
|
|
|
|
|
|
|
|
|
|
|
|
|
|
|
|
|
|
|
|
5 |
|
|
|
|
|
|
|
|
|
|
|
|
|
|
-20% |
|
|
|
|
|
|
|
|
|
|
|
|
|
|
|
|
|
|
|
|
|
|
|
|
|
|
|
|
|
|
|
|
|
|
|
|
|
|
|
|
|
|
|
|
0 |
Dec-06 |
Nov-07 |
Oct-08 |
Sep-09 |
Aug-10 |
|
Jun-12 |
May-13 |
Apr-14 |
|
|
|
Dec-17 |
Nov-18 |
-40% |
Dec-06 |
Nov-07 |
|
|
|
|
|
May-13 |
Apr-14 |
|
|
|
Dec-17 |
Nov-18 |
Jan-06 |
Jul-11 |
Mar-15 |
Feb-16 |
Jan-17 |
Jan-06 |
Oct-08 |
Sep-09 |
Aug-10 |
Jul-11 |
Jun-12 |
Mar-15 |
Feb-16 |
Jan-17 |
||||||||||||||||
|
|
|
|
Cyclical stocks |
|
|
|
|
Structural stocks |
|
|
|
|
|
|
Cyclical stocks |
|
|
|
Structural stocks |
|
|
|
||||||
Source: Deutsche Bank, Factset |
|
|
|
|
|
|
|
|
|
|
|
|
Source: Deutsche Bank, Factset |
|
|
|
|
|
|
|
|
|
|
|
|
||||
Figure 88: Valuation analysis of mid-cycle and trough P/E levels
|
|
P/E |
|
(Downside)/Upside on |
||
Company |
2019E |
Mid-cycle |
Trough |
Mid-cycle |
Trough |
|
(2008-2018) |
(2008-2018) |
|||||
|
|
|
|
|||
|
|
|
|
|
|
|
Buzzi |
10.1 |
15.7 |
7.2 |
56% |
-28% |
|
Cemex |
11.0 |
15.5 |
7.3 |
41% |
-34% |
|
CRH |
11.7 |
15.0 |
8.4 |
29% |
-28% |
|
Heidelberg |
9.0 |
12.0 |
6.3 |
34% |
-30% |
|
LafargeHolcim |
12.2 |
14.2 |
8.4 |
16% |
-31% |
|
Saint Gobain |
8.9 |
12.4 |
7.5 |
39% |
-16% |
|
Tarkett |
12.9 |
15.0 |
12.9 |
16% |
0% |
|
Titan |
16.0 |
14.5 |
8.5 |
-10% |
-47% |
|
Average |
11.5 |
14.3 |
8.3 |
27.7% |
-26.7% |
|
Source: Deutsche Bank estimates, Factset
39 Page
Building European |
2018 December 3 Materials Building |
Construction & |
|

vk.com/id446425943
40 Page |
Disconnection of stocks' P/E vs. PMI suggests a sharp slowdown is already priced in |
||||
■ |
Cyclical stocks 12m forward P/E is in general well correlated to European PMI - this is especially true for Saint Gobain which is widely seen as a |
||||
|
|
European construction proxy. |
|
|
|
|
■ |
Since start of year we however note a strong disconnection between valuation and PMI as the market is in our view already anticipating a sharp |
|||
|
|
macro slowdown. |
|
|
|
|
■ |
In particular, Saint Gobain trades at 8.9x 2019E P/E, a level consistent with a PMI below 45 (i.e. in clear recession mode) and at valuation levels not |
|||
|
|
seen since the 2009 and 2012 recessions. |
|
|
|
|
|
|
|
|
|
|
Figure 89: Europe PMI vs. 12m forward P/E evolution: Saint Gobain |
|
Figure 90: HeidelbergCement |
||
|
|
|
|
|
|
65 |
|
|
|
|
|
|
|
|
|
|
|
|
|
|
|
|
25 |
65 |
|
|
|
|
|
|
|
|
|
|
|
|
|
|
|
|
25 |
60 |
|
|
|
|
|
|
|
|
|
|
|
|
|
|
|
|
20 |
60 |
|
|
|
|
|
|
|
|
|
|
|
|
|
|
|
|
20 |
|
|
|
|
|
|
|
|
|
|
|
|
|
|
|
|
|
|
|
|
|
|
|
|
|
|
|
|
|
|
|
|
|
|
||
55 |
|
|
|
|
|
|
|
|
|
|
|
|
|
|
|
|
|
55 |
|
|
|
|
|
|
|
|
|
|
|
|
|
|
|
|
|
50 |
|
|
|
|
|
|
|
|
|
|
|
|
|
|
|
|
15 |
50 |
|
|
|
|
|
|
|
|
|
|
|
|
|
|
|
|
15 |
|
|
|
|
|
|
|
|
|
|
|
|
|
|
|
|
|
|
|
|
|
|
|
|
|
|
|
|
|
|
|
|
|
|
||
45 |
|
|
|
|
|
|
|
|
|
|
|
|
|
|
|
|
10 |
45 |
|
|
|
|
|
|
|
|
|
|
|
|
|
|
|
|
10 |
|
|
|
|
|
|
|
|
|
|
|
|
|
|
|
|
|
|
|
|
|
|
|
|
|
|
|
|
|
|
|
|
|
|
||
40 |
|
|
|
|
|
|
|
|
|
|
|
|
|
|
|
|
|
40 |
|
|
|
|
|
|
|
|
|
|
|
|
|
|
|
|
|
35 |
|
|
|
|
|
|
|
|
|
|
|
|
|
|
|
|
5 |
35 |
|
|
|
|
|
|
|
|
|
|
|
|
|
|
|
|
5 |
|
|
|
|
|
|
|
|
|
|
|
|
|
|
|
|
|
|
|
|
|
|
|
|
|
|
|
|
|
|
|
|
|
|
||
30 |
|
|
|
|
|
|
|
|
|
|
|
|
|
|
|
|
0 |
30 |
Oct-06 |
Jul-07 |
Apr-08 |
|
|
Jul-10 |
Apr-11 |
|
|
|
Apr-14 |
|
Oct-15 |
|
Apr-17 |
|
0 |
Jan-06 |
Oct-06 |
Jul-07 |
Apr-08 |
Jan-09 |
Oct-09 |
Jul-10 |
Apr-11 |
Jan-12 |
Oct-12 |
Jul-13 |
Apr-14 |
Jan-15 |
Oct-15 |
Jul-16 |
Apr-17 |
Jan-18 |
Oct-18 |
Jan-06 |
Jan-09 |
Oct-09 |
Jan-12 |
Oct-12 |
Jul-13 |
Jan-15 |
Jul-16 |
Jan-18 |
Oct-18 |
||||||||
|
|
|
|
Europe PMI |
|
|
|
|
|
SGO 12m forward P/E (rhs) |
|
|
|
|
|
|
Europe PMI |
|
|
|
|
|
HEI 12m forward P/E (rhs) |
|
|
||||||||||
Source:Deutsche Bank, Factset |
Source: Deutsche Bank, Factset |
|
|
|
|
Figure 91: CRH |
|
Figure 92: Buzzi Unicem |
|
65 |
|
|
|
|
|
|
|
|
|
|
|
|
|
25 |
65 |
|
|
|
|
|
|
|
|
|
|
|
|
|
|
30 |
|
60 |
|
|
|
|
|
|
|
|
|
|
|
|
|
20 |
60 |
|
|
|
|
|
|
|
|
|
|
|
|
|
|
25 |
|
|
|
|
|
|
|
|
|
|
|
|
|
|
|
|
|
|
|
|
|
|
|
|
|
|
|
|
|
|
||
|
55 |
|
|
|
|
|
|
|
|
|
|
|
|
|
|
55 |
|
|
|
|
|
|
|
|
|
|
|
|
|
|
20 |
|
50 |
|
|
|
|
|
|
|
|
|
|
|
|
|
15 |
|
|
|
|
|
|
|
|
|
|
|
|
|
|
|
|
|
|
|
|
|
|
|
|
|
|
|
|
|
|
50 |
|
|
|
|
|
|
|
|
|
|
|
|
|
|
|
||
|
|
|
|
|
|
|
|
|
|
|
|
|
|
|
|
|
|
|
|
|
|
|
|
|
|
|
|
|
|
||
|
|
|
|
|
|
|
|
|
|
|
|
|
|
|
|
|
|
|
|
|
|
|
|
|
|
|
|
|
|
15 |
|
|
45 |
|
|
|
|
|
|
|
|
|
|
|
|
|
10 |
45 |
|
|
|
|
|
|
|
|
|
|
|
|
|
|
|
|
|
|
|
|
|
|
|
|
|
|
|
|
|
|
|
|
|
|
|
|
|
|
|
|
|
|
|
|
|||
|
|
|
|
|
|
|
|
|
|
|
|
|
|
|
|
|
|
|
|
|
|
|
|
|
|
|
|
|
|
||
|
40 |
|
|
|
|
|
|
|
|
|
|
|
|
|
|
40 |
|
|
|
|
|
|
|
|
|
|
|
|
|
|
10 |
|
|
|
|
|
|
|
|
|
|
|
|
|
|
|
5 |
|
|
|
|
|
|
|
|
|
|
|
|
|
|
|
|
|
35 |
|
|
|
|
|
|
|
|
|
|
|
|
|
|
|
|
|
|
|
|
|
|
|
|
|
|
|
|
5 |
|
|
|
|
|
|
|
|
|
|
|
|
|
|
|
|
35 |
|
|
|
|
|
|
|
|
|
|
|
|
|
|
||
|
|
|
|
|
|
|
|
|
|
|
|
|
|
|
|
|
|
|
|
|
|
|
|
|
|
|
|
|
|
|
|
|
30 |
Oct-06 |
Jul-07 |
Apr-08 |
|
|
Apr-11 |
|
|
Apr-14 |
|
|
Jul-16 |
Apr-17 |
0 |
30 |
|
|
|
|
|
|
|
|
|
|
|
|
|
|
0 |
|
Jan-06 |
Jan-09 |
Oct-09 |
Jan-12 |
Oct-12 |
Jan-15 |
Oct-15 |
Oct-18 |
|
|
|
|
|
|
|
|
|
|
|
|
|
|
|||||||||
Deutsche |
-Jan06 |
-Oct06 |
-Jul07 |
-Apr08 |
-Jan09 |
-Oct09 |
Apr-11 |
Jan-12 |
Oct-12 |
-Jul13 |
-Apr14 |
-Jan15 |
-Oct15 |
-Jul16 |
-Apr17 |
Oct-18 |
|||||||||||||||
|
|
|
|
|
Jul10- |
Jul13- |
|
|
|
Jan18- |
|
|
|
|
|
Jul10- |
|
|
|
|
|
Jan18- |
|||||||||
|
|
|
|
|
Europe PMI |
|
|
|
CRH 12m forward P/E (rhs) |
|
|
|
|
|
Europe PMI |
|
|
|
Buzzi 12m forward P/E (rhs) |
|
|||||||||||
|
|
|
|
|
|
|
|
|
|
|
|
|
|
|
|
|
|
|
|
|
|
|
|
||||||||
|
Source: Deutsche Bank, Factset |
|
|
|
|
|
|
|
|
|
|
|
Source: Deutsche Bank, Factset |
|
|
|
|
|
|
|
|
|
|
|
|
||||||
AG/London Bank |
|
|
|
|
|
|
|
|
|
|
|
|
|
|
|
|
|
|
|
|
|
|
|
|
|
|
|
|
|
|
|
Building European |
2018 December 3 Materials Building |
Construction & |
|