

DB European Building Construction 2019 Outlook_watermark
.pdfPage21
|
|
|
|
|
|
|
|
|
|
|
|
|
|
|
|
|
|
|
|
|
|
|
|
|
|
|
|
|
|
|
|
|
|
|
|
|
|
|
DeutscheBankAG/London |
.vk |
||||||||
|
|
|
|
|
|
|
|
|
|
|
|
|
|
|
|
|
|
|
|
|
|
|
|
|
|
|
|
|
|
|
|
|
|
|
|
|
|
|
com/id446425943 |
|||||||||
|
DatastreamFactset,Bank,Source:Deutsche |
|
|
|
|
|
|
|
|
|
|
|
|
|
|
|
|
|
|
|
|
|
|
|
|
|
|
|
|
|
|
|
|
|
|
|
|
|
|
|
|
|
|
evolutionpermitsbuildingEuropeanofSnapshot |
||||
|
|
5%-15%- |
0% |
5% 5%- |
|
|
10%5% |
15% |
%20 15% |
25%25% |
PolandUK |
SEP-17 |
25%-20%- |
15%- |
5%- |
|
5% |
15% |
25% |
35%50% |
NorwayFinland |
SEP-17 20%-15%- |
10%- |
5%- |
0% |
|
10%5% |
15% 20% |
30% |
40%25% |
permitsbuildinginaveragemoving3minchange43:YoYFigure GermanyFrance |
|||||||||||||||||
|
|
|
|
|
10%- |
|
0% |
|
|
%10 |
|
20% |
|
|
|
|
|
|
10%- |
0% |
10% |
20% |
30% |
40% |
|
|
|
|
|
10%- |
|
0% |
|
10% |
20% |
|
|
|
|
|
|
|||||||
|
|
MAR-15 |
|
|
|
|
|
|
|
|
|
|
|
|
|
|
MAR-15 |
|
|
|
|
|
|
|
|
|
|
|
|
|
|
MAR-15 |
|
|
|
|
|
|
|
|
|
|
|
|
|
|
|
|
|
|
|
|
|
|
|
|
|
|
|
|
|
|
|
|
|
|
|
|
|
|
|
|
|
|
|
|
|
|
|
|
|
|
|
|
|
|
|
|
|
|
|
|
|
||||
|
|
JUN-15 |
|
|
|
|
|
|
|
|
|
|
|
|
|
|
JUN-15 |
|
|
|
|
|
|
|
|
|
|
|
|
|
|
JUN-15 |
|
|
|
|
|
|
|
|
|
|
|
|
|
|
|
|
|
|
SEP-15 |
|
|
|
|
|
|
|
|
|
|
|
|
|
|
SEP-15 |
|
|
|
|
|
|
|
|
|
|
|
|
|
|
SEP-15 |
|
|
|
|
|
|
|
|
|
|
|
|
|
|
|
|
|
|
DEC-15 |
|
|
|
|
|
|
|
|
|
|
|
|
|
|
DEC-15 |
|
|
|
|
|
|
|
|
|
|
|
|
|
|
DEC-15 |
|
|
|
|
|
|
|
|
|
|
|
|
|
|
|
|
|
|
MAR-16 |
|
|
|
|
|
|
|
|
|
|
|
|
|
|
MAR-16 |
|
|
|
|
|
|
|
|
|
|
|
|
|
|
MAR-16 |
|
|
|
|
|
|
|
|
|
|
|
|
|
|
|
|
|
|
JUN-16 |
|
|
|
|
|
|
|
|
|
|
|
|
|
|
JUN-16 |
|
|
|
|
|
|
|
|
|
|
|
|
|
|
JUN-16 |
|
|
|
|
|
|
|
|
|
|
|
|
|
|
|
|
|
|
SEP-16 |
|
|
|
|
|
|
|
|
|
|
|
|
|
|
SEP-16 |
|
|
|
|
|
|
|
|
|
|
|
|
|
|
SEP-16 |
|
|
|
|
|
|
|
|
|
|
|
|
|
|
|
|
|
|
DEC-16 |
|
|
|
|
|
|
|
|
|
|
|
|
|
|
DEC-16 |
|
|
|
|
|
|
|
|
|
|
|
|
|
|
DEC-16 |
|
|
|
|
|
|
|
|
|
|
|
|
|
|
|
|
|
|
MAR-17 |
|
|
|
|
|
|
|
|
|
|
|
|
|
|
MAR-17 |
|
|
|
|
|
|
|
|
|
|
|
|
|
|
MAR-17 |
|
|
|
|
|
|
|
|
|
|
|
|
|
|
|
|
|
|
JUN-17 |
|
|
|
|
|
|
|
|
|
|
|
|
|
|
JUN-17 |
|
|
|
|
|
|
|
|
|
|
|
|
|
|
JUN-17 |
|
|
|
|
|
|
|
|
|
|
|
|
|
|
|
|
|
|
SEP-17 |
|
|
|
|
|
|
|
|
|
|
|
|
|
|
SEP-17 |
|
|
|
|
|
|
|
|
|
|
|
|
|
|
SEP-17 |
|
|
|
|
|
|
|
|
|
|
|
|
|
|
|
|
|
|
DEC-17 |
|
|
|
|
|
|
|
|
|
|
|
|
|
|
DEC-17 |
|
|
|
|
|
|
|
|
|
|
|
|
|
|
DEC-17 |
|
|
|
|
|
|
|
|
|
|
|
|
|
|
|
|
|
|
MAR-18 |
|
|
|
|
|
|
|
|
|
|
|
|
|
|
MAR-18 |
|
|
|
|
|
|
|
|
|
|
|
|
|
|
MAR-18 |
|
|
|
|
|
|
|
|
|
|
|
|
|
|
|
|
|
|
JUN-18 |
|
|
|
|
|
|
|
|
|
|
|
|
|
|
JUN-18 |
|
|
|
|
|
|
|
|
|
|
|
|
|
|
JUN-18 |
|
|
|
|
|
|
|
|
|
|
|
|
|
|
|
|
|
|
SEP-18 |
|
|
|
|
|
|
|
|
|
|
|
|
|
|
SEP-18 |
|
|
|
|
|
|
|
|
|
|
|
|
|
|
SEP-18 |
|
|
|
|
|
|
|
|
|
|
|
|
|
|
|
|
|
|
MAR-15 |
|
|
|
|
|
|
|
|
|
|
|
|
|
|
|
|
|
|
|
|
|
|
|
|
|
|
|
|
|
|
|
|
|
|
|
|
|
|
|
|
|
|
|
|
|
|
|
|
|
|
|
|
|
|
|
|
|
|
|
|
|
|
|
MAR-15 |
|
|
|
|
|
|
|
|
|
|
|
|
|
|
MAR-15 |
|
|
|
|
|
|
|
|
|
|
|
|
|
|
|
|
|
|
JUN-15 |
|
|
|
|
|
|
|
|
|
|
|
|
|
|
JUN-15 |
|
|
|
|
|
|
|
|
|
|
|
|
|
|
JUN-15 |
|
|
|
|
|
|
|
|
|
|
|
|
|
|
|
|
|
|
|
|
|
|
|
|
|
|
|
|
|
|
|
|
|
|
|
|
|
|
|
|
|
|
|
|
|
|
|
|
|
|
|
|
|
|
|
|
|
|
|
|
|
|
|||
|
|
SEP-15 |
|
|
|
|
|
|
|
|
|
|
|
|
|
|
SEP-15 |
|
|
|
|
|
|
|
|
|
|
|
|
|
|
SEP-15 |
|
|
|
|
|
|
|
|
|
|
|
|
|
|
|
|
|
|
|
|
|
|
|
|
|
|
|
|
|
|
|
|
|
|
|
|
|
|
|
|
|
|
|
|
|
|
|
|
|
|
|
|
|
|
|
|
|
|
|
|
|
|
|||
|
|
DEC-15 |
|
|
|
|
|
|
|
|
|
|
|
|
|
|
DEC-15 |
|
|
|
|
|
|
|
|
|
|
|
|
|
|
DEC-15 |
|
|
|
|
|
|
|
|
|
|
|
|
|
|
|
|
|
|
|
|
|
|
|
|
|
|
|
|
|
|
|
|
|
|
|
|
|
|
|
|
|
|
|
|
|
|
|
|
|
|
|
|
|
|
|
|
|
|
|
|
|
|
|||
|
|
MAR-16 |
|
|
|
|
|
|
|
|
|
|
|
|
|
|
MAR-16 |
|
|
|
|
|
|
|
|
|
|
|
|
|
|
MAR-16 |
|
|
|
|
|
|
|
|
|
|
|
|
|
|
|
|
|
|
|
|
|
|
|
|
|
|
|
|
|
|
|
|
|
|
|
|
|
|
|
|
|
|
|
|
|
|
|
|
|
|
|
|
|
|
|
|
|
|
|
|
|
|
|||
|
|
JUN-16 |
|
|
|
|
|
|
|
|
|
|
|
|
|
|
JUN-16 |
|
|
|
|
|
|
|
|
|
|
|
|
|
|
JUN-16 |
|
|
|
|
|
|
|
|
|
|
|
|
|
|
|
|
|
|
|
|
|
|
|
|
|
|
|
|
|
|
|
|
|
|
|
|
|
|
|
|
|
|
|
|
|
|
|
|
|
|
|
|
|
|
|
|
|
|
|
|
|
|
|||
|
|
SEP-16 |
|
|
|
|
|
|
|
|
|
|
|
|
|
|
SEP-16 |
|
|
|
|
|
|
|
|
|
|
|
|
|
|
SEP-16 |
|
|
|
|
|
|
|
|
|
|
|
|
|
|
|
|
|
|
|
|
|
|
|
|
|
|
|
|
|
|
|
|
|
|
|
|
|
|
|
|
|
|
|
|
|
|
|
|
|
|
|
|
|
|
|
|
|
|
|
|
|
|
|||
|
|
DEC-16 |
|
|
|
|
|
|
|
|
|
|
|
|
|
|
DEC-16 |
|
|
|
|
|
|
|
|
|
|
|
|
|
|
DEC-16 |
|
|
|
|
|
|
|
|
|
|
|
|
|
|
|
|
|
|
|
|
|
|
|
|
|
|
|
|
|
|
|
|
|
|
|
|
|
|
|
|
|
|
|
|
|
|
|
|
|
|
|
|
|
|
|
|
|
|
|
|
|
|
|||
|
|
MAR-17 |
|
|
|
|
|
|
|
|
|
|
|
|
|
|
MAR-17 |
|
|
|
|
|
|
|
|
|
|
|
|
|
|
MAR-17 |
|
|
|
|
|
|
|
|
|
|
|
|
|
|
|
|
|
|
|
|
|
|
|
|
|
|
|
|
|
|
|
|
|
|
|
|
|
|
|
|
|
|
|
|
|
|
|
|
|
|
|
|
|
|
|
|
|
|
|
|
|
|
|||
|
|
JUN-17 |
|
|
|
|
|
|
|
|
|
|
|
|
|
|
JUN-17 |
|
|
|
|
|
|
|
|
|
|
|
|
|
|
JUN-17 |
|
|
|
|
|
|
|
|
|
|
|
|
|
|
|
|
|
|
|
|
|
|
|
|
|
|
|
|
|
|
|
|
|
|
|
|
|
|
|
|
|
|
|
|
|
|
|
|
|
|
|
|
|
|
|
|
|
|
|
|
|
|
|||
|
|
SEP-17 |
|
|
|
|
|
|
|
|
|
|
|
|
|
|
|
|
|
|
|
|
|
|
|
|
|
|
|
|
|
|
|
|
|
|
|
|
|
|
|
|
|
|
|
|
by |
|
|
|
MAR-18 |
|
|
|
|
|
|
|
|
|
|
|
|
|
|
|
|
|
|
|
|
|
|
|
|
|
|
|
|
|
|
|
|
|
|
|
|
|
|
|
|
|
|
|
|
|
|
|
|
DEC-17 |
|
|
|
|
|
|
|
|
|
|
|
|
|
|
DEC-17 |
|
|
|
|
|
|
|
|
|
|
|
|
|
|
DEC-17 |
|
|
|
|
|
|
|
|
|
|
|
|
|
|
|
|
|
|
|
|
|
|
|
|
|
|
|
|
|
|
|
|
|
|
|
|
|
|
|
|
|
|
|
|
|
|
|
|
|
|
|
|
|
|
|
|
|
|
|
|
|
|
|||
|
|
MAR-15 |
10%- |
|
0% |
10% |
|
20% |
|
%30 |
40% |
Czech |
MAR-18 |
40%- |
20%- |
|
|
0% |
20% |
40% |
60% |
Sweden |
MAR-18 |
0% |
20% |
|
40% |
60% |
80% |
100% |
120% |
Spain |
country |
|
||||||||||||||
|
|
|
|
|
MAR-15 |
|
|
MAR-15 |
|
|
||||||||||||||||||||||||||||||||||||||
|
|
JUN-18 |
|
|
|
|
|
|
|
|
|
|
|
|
|
|
JUN-18 |
|
|
|
|
|
|
|
|
|
|
|
|
|
|
JUN-18 |
|
|
|
|
|
|
|
|
|
|
|
|
|
|
|
|
|
|
SEP-18 |
|
|
|
|
|
|
|
|
|
|
|
|
|
|
SEP-18 |
|
|
|
|
|
|
|
|
|
|
|
|
|
|
SEP-18 |
|
|
|
|
|
|
|
|
|
|
|
|
|
|
|
|
|
|
|
|
|
|
|
|
|
|
|
|
|
|
|
|
|
|
|
|
|
|
|
|
|
|
|
|
|
|
|
|
|
|
|
|
|
|
|
|
|
|
|
|
|
|
|
|
|
|
|
JUN-15 |
|
|
|
|
|
|
|
|
|
|
|
|
|
|
JUN-15 |
|
|
|
|
|
|
|
|
|
|
|
|
|
|
JUN-15 |
|
|
|
|
|
|
|
|
|
|
|
|
|
|
|
|
|
|
|
|
|
|
|
|
|
|
|
|
|
|
|
|
|
|
|
|
|
|
|
|
|
|
|
|
|
|
|
|
|
|
|
|
|
|
|
|
|
|
|
|
|
||||
|
|
|
|
|
|
|
|
|
|
|
|
|
|
|
|
|
|
|
|
|
|
|
|
|
|
|
|
|
|
|
|
|
|
|
|
|
|
|
|
|
|
|
|
|
|
|
||
|
|
SEP-15 |
|
|
|
|
|
|
|
|
|
|
|
|
|
|
SEP-15 |
|
|
|
|
|
|
|
|
|
|
|
|
|
|
SEP-15 |
|
|
|
|
|
|
|
|
|
|
|
|
|
|
|
|
|
|
DEC-15 |
|
|
|
|
|
|
|
|
|
|
|
|
|
|
DEC-15 |
|
|
|
|
|
|
|
|
|
|
|
|
|
|
DEC-15 |
|
|
|
|
|
|
|
|
|
|
|
|
|
|
|
|
|
|
MAR-16 |
|
|
|
|
|
|
|
|
|
|
|
|
|
|
MAR-16 |
|
|
|
|
|
|
|
|
|
|
|
|
|
|
MAR-16 |
|
|
|
|
|
|
|
|
|
|
|
|
|
|
|
|
|
|
JUN-16 |
|
|
|
|
|
|
|
|
|
|
|
|
|
|
JUN-16 |
|
|
|
|
|
|
|
|
|
|
|
|
|
|
JUN-16 |
|
|
|
|
|
|
|
|
|
|
|
|
|
|
|
|
|
|
SEP-16 |
|
|
|
|
|
|
|
|
|
|
|
|
|
|
SEP-16 |
|
|
|
|
|
|
|
|
|
|
|
|
|
|
SEP-16 |
|
|
|
|
|
|
|
|
|
|
|
|
|
|
|
|
|
|
DEC-16 |
|
|
|
|
|
|
|
|
|
|
|
|
|
|
DEC-16 |
|
|
|
|
|
|
|
|
|
|
|
|
|
|
DEC-16 |
|
|
|
|
|
|
|
|
|
|
|
|
|
|
|
|
|
|
MAR-17 |
|
|
|
|
|
|
|
|
|
|
|
|
|
|
MAR-17 |
|
|
|
|
|
|
|
|
|
|
|
|
|
|
MAR-17 |
|
|
|
|
|
|
|
|
|
|
|
|
|
|
|
|
|
|
JUN-17 |
|
|
|
|
|
|
|
|
|
|
|
|
|
|
JUN-17 |
|
|
|
|
|
|
|
|
|
|
|
|
|
|
JUN-17 |
|
|
|
|
|
|
|
|
|
|
|
|
|
|
|
|
|
|
SEP-17 |
|
|
|
|
|
|
|
|
|
|
|
|
|
|
SEP-17 |
|
|
|
|
|
|
|
|
|
|
|
|
|
|
SEP-17 |
|
|
|
|
|
|
|
|
|
|
|
|
|
|
|
|
|
|
DEC-17 |
|
|
|
|
|
|
|
|
|
|
|
|
|
|
DEC-17 |
|
|
|
|
|
|
|
|
|
|
|
|
|
|
DEC-17 |
|
|
|
|
|
|
|
|
|
|
|
|
|
|
|
|
|
|
MAR-18 |
|
|
|
|
|
|
|
|
|
|
|
|
|
|
MAR-18 |
|
|
|
|
|
|
|
|
|
|
|
|
|
|
MAR-18 |
|
|
|
|
|
|
|
|
|
|
|
|
|
|
|
|
|
|
JUN-18 |
|
|
|
|
|
|
|
|
|
|
|
|
|
|
JUN-18 |
|
|
|
|
|
|
|
|
|
|
|
|
|
|
JUN-18 |
|
|
|
|
|
|
|
|
|
|
|
|
|
|
|
|
|
|
SEP-18 |
|
|
|
|
|
|
|
|
|
|
|
|
|
Romania |
SEP-18 |
|
|
|
|
|
|
|
|
|
|
|
|
|
Italy |
SEP-18 |
|
|
|
|
|
|
|
|
|
|
|
Netherlands |
|
|
||
|
|
|
15%- |
10%- |
5%- |
0% |
|
5% |
15% %10 |
20% |
JUN-15 |
5%- |
3%- 4%- |
2%- |
1%- |
5% 4% 3% 2% 1% 0% |
40%- |
20%- |
|
0% |
|
20% |
40% |
60% |
80% |
|
|
|||||||||||||||||||||
|
|
|
|
|
|
|
|
|
|
|
|
|
|
|
|
|
MAR-15 |
|
|
|
|
|
|
|
|
|
|
|
|
|
|
|
|
|
|
|
|
|
|
|
|
|
|
|
|
|
|
|
|
|
MAR-15 |
|
|
|
|
|
|
|
|
|
|
|
|
|
|
|
|
|
|
|
|
|
|
|
|
|
|
|
|
|
MAR-15 |
|
|
|
|
|
|
|
|
|
|
|
|
|
|
|
|
|
|
JUN-15 |
|
|
|
|
|
|
|
|
|
|
|
|
|
|
|
|
|
|
|
|
|
|
|
|
|
|
|
|
|
JUN-15 |
|
|
|
|
|
|
|
|
|
|
|
|
|
|
|
|
|
|
SEP-15 |
|
|
|
|
|
|
|
|
|
|
|
|
|
|
SEP-15 |
|
|
|
|
|
|
|
|
|
|
|
|
|
|
SEP-15 |
|
|
|
|
|
|
|
|
|
|
|
|
|
|
|
|
|
|
|
|
|
|
|
|
|
|
|
|
|
|
|
|
|
|
|
|
|
|
|
|
|
|
|
|
|
|
|
|
|
|
|
|
|
|
|
|
|
|
|
|
|
|
|||
|
|
DEC-15 |
|
|
|
|
|
|
|
|
|
|
|
|
|
|
DEC-15 |
|
|
|
|
|
|
|
|
|
|
|
|
|
|
DEC-15 |
|
|
|
|
|
|
|
|
|
|
|
|
|
|
|
|
|
|
|
|
|
|
|
|
|
|
|
|
|
|
|
|
|
|
|
|
|
|
|
|
|
|
|
|
|
|
|
|
|
|
|
|
|
|
|
|
|
|
|
|
|
|
|||
|
|
MAR-16 |
|
|
|
|
|
|
|
|
|
|
|
|
|
|
MAR-16 |
|
|
|
|
|
|
|
|
|
|
|
|
|
|
MAR-16 |
|
|
|
|
|
|
|
|
|
|
|
|
|
|
|
|
|
|
|
|
|
|
|
|
|
|
|
|
|
|
|
|
|
|
|
|
|
|
|
|
|
|
|
|
|
|
|
|
|
|
|
|
|
|
|
|
|
|
|
|
|
|
|||
|
|
JUN-16 |
|
|
|
|
|
|
|
|
|
|
|
|
|
|
JUN-16 |
|
|
|
|
|
|
|
|
|
|
|
|
|
|
JUN-16 |
|
|
|
|
|
|
|
|
|
|
|
|
|
|
|
|
|
|
|
|
|
|
|
|
|
|
|
|
|
|
|
|
|
|
|
|
|
|
|
|
|
|
|
|
|
|
|
|
|
|
|
|
|
|
|
|
|
|
|
|
|
|
|||
|
|
SEP-16 |
|
|
|
|
|
|
|
|
|
|
|
|
|
|
SEP-16 |
|
|
|
|
|
|
|
|
|
|
|
|
|
|
SEP-16 |
|
|
|
|
|
|
|
|
|
|
|
|
|
|
|
|
|
|
|
|
|
|
|
|
|
|
|
|
|
|
|
|
|
|
|
|
|
|
|
|
|
|
|
|
|
|
|
|
|
|
|
|
|
|
|
|
|
|
|
|
|
|
|||
|
|
DEC-16 |
|
|
|
|
|
|
|
|
|
|
|
|
|
|
DEC-16 |
|
|
|
|
|
|
|
|
|
|
|
|
|
|
DEC-16 |
|
|
|
|
|
|
|
|
|
|
|
|
|
|
|
|
|
|
|
|
|
|
|
|
|
|
|
|
|
|
|
|
|
|
|
|
|
|
|
|
|
|
|
|
|
|
|
|
|
|
|
|
|
|
|
|
|
|
|
|
|
|
|||
|
|
MAR-17 |
|
|
|
|
|
|
|
|
|
|
|
|
|
|
MAR-17 |
|
|
|
|
|
|
|
|
|
|
|
|
|
|
MAR-17 |
|
|
|
|
|
|
|
|
|
|
|
|
|
|
|
|
|
|
|
|
|
|
|
|
|
|
|
|
|
|
|
|
|
|
|
|
|
|
|
|
|
|
|
|
|
|
|
|
|
|
|
|
|
|
|
|
|
|
|
|
|
|
|||
|
|
JUN-17 |
|
|
|
|
|
|
|
|
|
|
|
|
|
|
JUN-17 |
|
|
|
|
|
|
|
|
|
|
|
|
|
|
JUN-17 |
|
|
|
|
|
|
|
|
|
|
|
|
|
|
|
|
|
|
|
|
|
|
|
|
|
|
|
|
|
|
|
|
|
|
|
|
|
|
|
|
|
|
|
|
|
|
|
|
|
|
|
|
|
|
|
|
|
|
|
|
|
|
|||
|
|
SEP-17 |
|
|
|
|
|
|
|
|
|
|
|
|
|
|
SEP-17 |
|
|
|
|
|
|
|
|
|
|
|
|
|
|
SEP-17 |
|
|
|
|
|
|
|
|
|
|
|
|
|
|
|
|
|
|
|
|
|
|
|
|
|
|
|
|
|
|
|
|
|
|
|
|
|
|
|
|
|
|
|
|
|
|
|
|
|
|
|
|
|
|
|
|
|
|
|
|
|
|
|||
|
|
DEC-17 |
|
|
|
|
|
|
|
|
|
|
|
|
|
|
DEC-17 |
|
|
|
|
|
|
|
|
|
|
|
|
|
|
DEC-17 |
|
|
|
|
|
|
|
|
|
|
|
|
|
|
|
|
|
|
|
|
|
|
|
|
|
|
|
|
|
|
|
|
|
|
|
|
|
|
|
|
|
|
|
|
|
|
|
|
|
|
|
|
|
|
|
|
|
|
|
|
|
|
|||
|
|
MAR-18 |
|
|
|
|
|
|
|
|
|
|
|
|
|
|
MAR-18 |
|
|
|
|
|
|
|
|
|
|
|
|
|
|
MAR-18 |
|
|
|
|
|
|
|
|
|
|
|
|
|
|
|
|
|
|
|
|
|
|
|
|
|
|
|
|
|
|
|
|
|
|
|
|
|
|
|
|
|
|
|
|
|
|
|
|
|
|
|
|
|
|
|
|
|
|
|
|
|
|
|||
|
|
JUN-18 |
|
|
|
|
|
|
|
|
|
|
|
|
|
|
JUN-18 |
|
|
|
|
|
|
|
|
|
|
|
|
|
|
JUN-18 |
|
|
|
|
|
|
|
|
|
|
|
|
|
|
|
|
|
|
|
|
|
|
|
|
|
|
|
|
|
|
|
|
|
|
|
|
|
|
|
|
|
|
|
|
|
|
|
|
|
|
|
|
|
|
|
|
|
|
|
|
|
|
|||
|
|
SEP-18 |
|
|
|
|
|
|
|
|
|
|
|
|
|
|
SEP-18 |
|
|
|
|
|
|
|
|
|
|
|
|
|
|
SEP-18 |
|
|
|
|
|
|
|
|
|
|
|
|
|
|
|
|
|
|
|
|
|
|
|
|
|
|
|
|
|
|
|
|
|
|
|
|
|
|
|
|
|
|
|
|
|
|
|
|
|
|
|
|
|
|
|
|
|
|
|
|
|
|
|||
|
|
|
|
|
|
|
|
|
|
|
|
|
|
|
|
|
|
|
|
|
|
|
|
|
|
|
|
|
|
|
|
|
|
|
|
|
|
|
|
|
|
|
|
|
|
|
|
|
EuropeanBuilding&Construction
BuildingMaterials
3December2018

vk.com/id446425943
22Page |
|
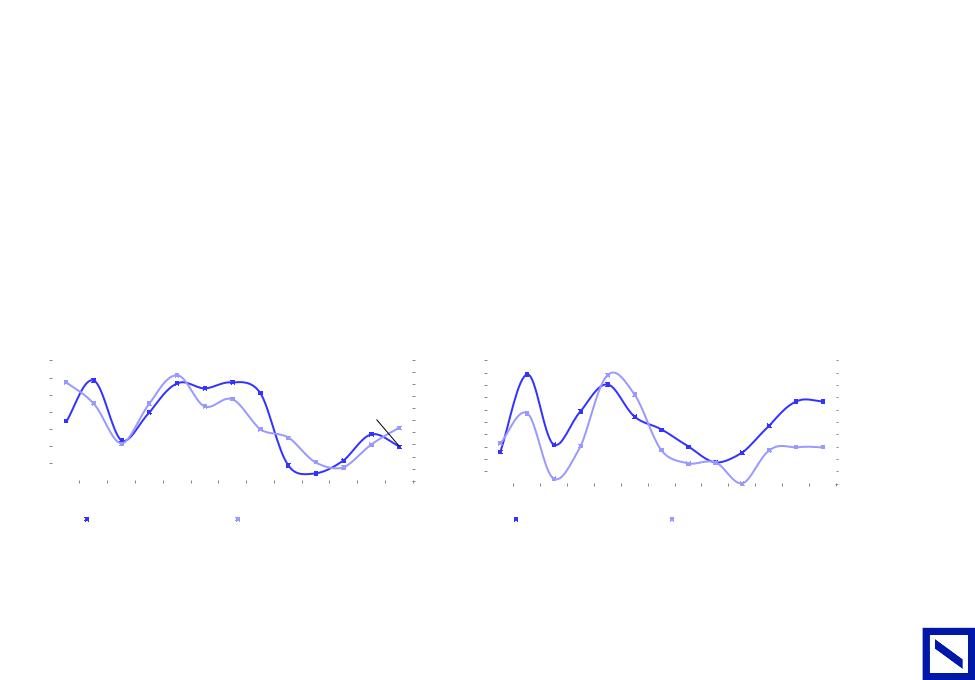
Europe renovation should be more resilient than residential new-build |
|
|
|
|
|
|
|
|
|
|
|
|
|
|||||||||||||||||||||||||||||||||||||||||||||||||||||||
|
■ |
Our historical analysis shows that the European renovation market is much more resilient and less volatile vs. new-build over the cycle. |
|
|
|
|
||||||||||||||||||||||||||||||||||||||||||||||||||||||||||||||||
|
|
■ |
2007-10 data even suggest they can be quite disconnected from new-build data with half of European countries still showing a positive renovation |
|||||||||||||||||||||||||||||||||||||||||||||||||||||||||||||||||||
|
|
|
|
market while newbuild was experiencing a severe downturn in Europe. |
|
|
|
|
|
|
|
|
|
|
|
|
|
|
|
|
||||||||||||||||||||||||||||||||||||||||||||||||||
|
|
■ |
In France, renovation market has surprised by its weakness in spite of strong lead indicators (incl. existing house transaction). This is potentially due to |
|||||||||||||||||||||||||||||||||||||||||||||||||||||||||||||||||||
|
|
|
|
a lack of skilled labor. Whether the slowdown of the new-build segment will free some workforce and translate into an acceleration of the renovation |
||||||||||||||||||||||||||||||||||||||||||||||||||||||||||||||||||
|
|
|
|
market remains however to be seen. |
|
|
|
|
|
|
|
|
|
|
|
|
|
|
|
|
|
|
|
|
|
|
|
|
|
|
|
|
|
|
|
|
|
|
|
|
|
|
|
|
|
|||||||||||||||||||||||||
|
|
|
|
|
|
|
|
|
|
|
|
|
|
|
|
|
|
|
|
|
|
|
|
|
|
|
|
|
|
|
|
|
|
|
|
|
||||||||||||||||||||||||||||||||||
|
|
Figure 44: Renovation vs. New build resi YoY growth over the cycle |
|
|
|
|
|
Figure 45: Renovation vs. New build resi 2007-10 % change |
|
|
|
|
||||||||||||||||||||||||||||||||||||||||||||||||||||||||||
|
15% |
|
|
|
|
|
|
|
|
|
|
|
|
|
|
|
|
|
|
|
|
|
|
|
|
|
|
|
|
|
|
|
|
|
|
|
|
|
|
|
|
|
|
|
|
|
|
|
|
|
|
|
|
|
|
|
|
|
|
|
|
|
|
|
20% |
|
|
|
|
|
|
10% |
|
|
|
|
|
|
|
|
|
|
|
|
|
|
|
|
|
|
|
|
|
|
|
|
|
|
|
|
|
|
|
|
|
|
|
|
|
|
|
|
|
|
|
|
|
|
|
|
|
|
|
|
|
|
|
|
|
|
|
|
|
|
Finland |
|
|
|
|
||
|
|
|
|
|
|
|
|
|
|
|
|
|
|
|
|
|
|
|
|
|
|
|
|
|
|
|
|
|
|
|
|
|
|
|
|
|
|
|
|
|
|
|
|
|
|
|
|
|
|
|
|
|
|
|
|
|
|
|
|
|
|
|
|
|
|
|
|
|||
|
|
|
|
|
|
|
|
|
|
|
|
|
|
|
|
|
|
|
|
|
|
|
|
|
|
|
|
|
|
|
|
|
|
|
|
|
|
|
|
|
|
|
|
|
|
|
|
|
|
|
|
|
|
|
|
|
|
|
|
|
|
|
|
|
15% |
|
|
|
|
|
|
5% |
|
|
|
|
|
|
|
|
|
|
|
|
|
|
|
|
|
|
|
|
|
|
|
|
|
|
|
|
|
|
|
|
|
|
|
|
|
|
|
|
|
|
|
|
|
|
|
|
|
|
|
|
|
|
|
|
|
|
|
|
|
|
|
|
change) |
||||
|
|
|
|
|
|
|
|
|
|
|
|
|
|
|
|
|
|
|
|
|
|
|
|
|
|
|
|
|
|
|
|
|
|
|
|
|
|
|
|
|
|
|
|
|
|
|
|
|
|
|
|
|
|
|
|
|
|
|
|
|
|
|
|
|
|
|||||
|
0% |
|
|
|
|
|
|
|
|
|
|
|
|
|
|
|
|
|
|
|
|
|
|
|
|
|
|
|
|
|
|
|
|
|
|
|
|
|
|
|
|
|
|
|
|
|
|
|
|
|
|
|
|
|
|
|
|
|
|
|
Belgium |
|
10% |
|
|
|
|
|||
|
|
|
|
|
|
|
|
|
|
|
|
|
|
|
|
|
|
|
|
|
|
|
|
|
|
|
|
|
|
|
|
|
|
|
|
|
|
|
|
|
|
|
|
|
|
|
|
|
|
|
|
|
|
|
Sweden |
|
|
|
|
|
|
|
|
|
|
|
|
|||
|
-5% |
|
|
|
|
|
|
|
|
|
|
|
|
|
|
|
|
|
|
|
|
|
|
|
|
|
|
|
|
|
|
|
|
|
|
|
|
|
|
|
|
|
|
|
|
|
|
|
|
|
|
|
|
|
|
|
|
|
|
|
Germany |
5% |
|
(% |
|
|||||
|
|
|
|
|
|
|
|
|
|
|
|
|
|
|
|
|
|
|
|
|
|
|
|
|
|
|
|
|
|
|
|
|
|
|
|
|
|
|
|
|
|
|
|
|
|
|
|
|
|
|
|
|
|
|
|
|
|
|
|
|
|
|
|
|
||||||
|
-10% |
|
|
|
|
|
|
|
|
|
|
|
|
|
|
|
|
|
|
|
|
|
|
|
|
|
|
|
|
|
|
|
|
|
|
|
|
|
|
|
|
|
|
|
|
|
|
|
|
New Resi 2007-10 (% change) |
|
|
|
|
|
|
|
Austria |
|
10 |
|
|||||||||
|
|
|
|
|
|
|
|
|
|
|
|
|
|
|
|
|
|
|
|
|
|
|
|
|
|
|
|
|
|
|
|
|
|
|
|
|
|
|
|
|
|
|
|
|
|
|
|
|
|
|
|
-25% |
-20% |
-15% |
-10% |
-5% |
0% |
2007- |
|
|||||||||||
|
|
|
|
|
|
|
|
|
|
|
|
|
|
|
|
|
|
|
|
|
|
|
|
|
|
|
|
|
|
|
|
|
|
|
|
|
|
|
|
|
|
|
|
|
|
|
|
|
-45% |
|
|
|
-40% |
-35% |
-30% |
|
||||||||||||||
|
-15% |
|
|
|
|
|
|
|
|
|
|
|
|
|
|
|
|
|
|
|
|
|
|
|
|
|
|
|
|
|
|
|
|
|
|
|
|
|
|
|
|
|
|
|
|
|
|
|
|
|
|
|
|
|
|
Norway |
|
|
|
|
|
|
|
0% |
|
|
|
|
||
|
-20% |
|
|
|
|
|
|
|
|
|
|
|
|
|
|
|
|
|
|
|
|
|
|
|
|
|
|
|
|
|
|
|
|
|
|
|
|
|
|
|
|
|
|
|
|
|
|
|
|
|
|
|
|
Italy |
UK |
France |
|
|
|
|
|
-5% |
|
Resi |
||||||
|
|
|
|
|
|
|
|
|
|
|
|
|
|
|
|
|
|
|
|
|
|
|
|
|
|
|
|
|
|
|
|
|
|
|
|
|
|
|
|
|
|
|
|
|
|
|
|
|
|
|
|
|
|
|
|
|
|
|
|
|
|
|
||||||||
|
-25% |
|
1995 |
1996 |
1997 |
1998 |
1999 |
2000 |
2001 |
2002 |
2003 |
2004 |
2005 |
2006 |
2007 |
2008 |
2009 |
2010 |
2011 |
2012 |
2013 |
2014 |
2015 |
2016 |
2017 |
2018E |
2019E |
2020E |
|
|
|
|
|
|
|
|
|
|
|
|
|
|
|
|
|
|
|
|||||||||||||||||||||||
|
|
|
|
|
|
|
|
|
|
|
|
|
|
|
|
|
|
|
|
|
||||||||||||||||||||||||||||||||||||||||||||||||||
|
1994 |
|
|
|
|
|
|
|
|
Netherlands |
|
|
|
|
|
|
|
-10% |
|
RMI |
||||||||||||||||||||||||||||||||||||||||||||||||||
|
|
|
|
|
|
|
|
|
|
|
|
|
|
|
|
|
|
|
|
|
|
|
|
|
|
|
|
|
|
|
|
|
|
|
|
|
|
|
|
|
|
|
|
|
|
|
|
|
|
|
|
|
|
|
|
|
|
|
|
|
|
|
|
|
|
|
|
|
||
|
|
|
|
|
|
|
|
|
|
|
|
|
|
NEW BUILD RESI |
|
|
|
|
|
|
|
|
|
|
|
RENOVATION RESI |
|
|
|
|
|
|
|
|
|
|
|
|
|
|
|
|
|
|
|
|
|
|
|
|
|
|
|
-15% |
|
|
|
|
||||||||||||
|
|
|
|
|
|
|
|
|
|
|
|
|
|
|
|
|
|
|
|
|
|
|
|
|
|
|
|
|
|
|
|
|
|
|
|
|
|
|
|
|
|
|
|
|
|
|
|
|
|
|
|
|
|
|
|
|
||||||||||||||
|
|
Source: Deutsche Bank, Euroconstruct |
|
|
|
|
|
|
|
|
|
|
|
|
|
|
|
|
|
|
|
|
|
|
|
|
|
|
|
|
|
|
|
|
|
|
Source: Deutsche Bank, Euroconstruct |
|
|
|
|
|
|
|
|
|
|
|
|
|
||||||||||||||||||||
|
|
|
|
|
|
|
|
|
|
|
|
|
|
|
|
|
|
|
|
|
|
|
|
|
|
|
|
|
|
|
|
|
|
|
|
|
|
|
|
|
|
|
|
|
|
|
|
|
||||||||||||||||||||||
|
|
|
|
|
|
|
|
|
|
|
|
|
|
|
|
|
|
|
|
|
|
|||||||||||||||||||||||||||||||||||||||||||||||||
|
|
|
|
|
|
|
|
|
|
|
|
|
|
|
|
|
|
|
|
|
|
|||||||||||||||||||||||||||||||||||||||||||||||||
|
|
Figure 46: New build Resi. Vs renovation Euroconstruct forecasts |
|
|
|
|
|
|
|
|
Figure 47: French existing house transactions vs. building permits |
|
|
|
|
|||||||||||||||||||||||||||||||||||||||||||||||||||||||
|
|
|
|
|
|
|
|
|
|
|
|
|
|
|
|
|
|
|
|
|
|
|
|
|
|
|
|
|
|
|
|
|
|
|
|
|
|
|
|
|
|
|
|
|
|
|
|
|
130 |
|
|
|
|
|
|
|
|
|
|
|
|
|
|
|
|
|
|
|
||
|
|
|
|
|
|
|
|
|
|
|
|
|
2015-18 New |
|
2015-18 Renovation |
|
|
|
2018-20 New |
2018-20 Renovation |
|
|
|
|
|
|
|
|
|
|
|
|
|
|
|
|
|
|
|
|||||||||||||||||||||||||||||||
|
|
|
|
|
|
|
|
|
|
|
|
|
|
|
|
|
|
|
|
|
|
|
|
|
|
|
|
|
|
|
|
|
|
|
||||||||||||||||||||||||||||||||||||
|
|
|
|
|
|
|
|
|
|
|
|
|
|
build Resi |
|
|
|
Resi |
|
|
|
|
|
|
|
build Resi |
|
|
|
|
Resi |
|
|
|
|
|
|
|
125 |
|
|
|
|
|
|
|
|
|
|
|
|
|
|
|
|
|
|
|
||||||||||||
|
|
Austria |
|
|
|
|
|
|
|
|
|
|
|
1.9% |
|
|
|
|
|
|
0.9% |
|
|
|
|
|
|
|
|
1.1% |
|
|
|
|
1.9% |
|
|
|
|
|
|
|
120 |
|
|
|
|
|
|
|
|
|
|
|
|
|
|
|
|
|
|
|
||||||||
|
|
Belgium |
|
|
|
|
|
|
|
|
|
|
|
5.1% |
|
|
|
|
|
|
2.2% |
|
|
|
|
|
|
|
|
-1.1% |
|
|
|
|
2.7% |
|
|
|
|
|
|
|
115 |
|
|
|
|
|
|
|
|
|
|
|
|
|
|
|
|
|
|
|
||||||||
|
|
Denmark |
|
|
|
|
|
|
|
|
|
|
|
9.3% |
|
|
|
|
|
|
2.0% |
|
|
|
|
|
|
|
|
6.0% |
|
|
|
|
2.5% |
|
|
|
|
|
|
|
|
|
|
|
|
|
|
|
|
|
|
|
|
|
|
|
|
|
|
|||||||||
|
|
|
|
|
|
|
|
|
|
|
|
|
|
|
|
|
|
|
|
|
|
|
|
|
|
|
|
|
|
|
|
|
|
|
|
|
|
110 |
|
|
|
|
|
|
|
|
|
|
|
|
|
|
|
|
|
|
|
|||||||||||||
|
|
Finland |
|
|
|
|
|
|
|
|
|
|
|
11.3% |
|
|
|
|
|
|
1.7% |
|
|
|
|
|
|
|
|
-5.9% |
|
|
|
|
1.7% |
|
|
|
|
|
|
|
|
|
|
|
|
|
|
|
|
|
|
|
|
|
|
|
|
|
|
|||||||||
|
|
|
|
|
|
|
|
|
|
|
|
|
|
|
|
|
|
|
|
|
|
|
|
|
|
|
|
|
|
|
|
|
|
|
|
|
|
|
|
|
|
|
|
|
|
|
|
|
|
|
|
|
|
|
|
|
|
|
|
|||||||||||
|
|
France |
|
|
|
|
|
|
|
|
|
|
|
4.1% |
|
|
|
|
|
|
0.9% |
|
|
|
|
|
|
|
|
-3.6% |
|
|
|
|
1.5% |
|
|
|
|
|
|
|
105 |
|
|
|
|
|
|
|
|
|
|
|
|
|
|
|
|
|
|
|
||||||||
|
|
Germany |
|
|
|
|
|
|
|
|
|
|
|
7.3% |
|
|
|
|
|
|
0.2% |
|
|
|
|
|
|
|
|
0.3% |
|
|
|
-0.3% |
|
|
|
|
|
|
100 |
|
|
|
|
|
|
|
|
|
|
|
|
|
|
|
|
|
|
|
||||||||||
|
|
Italy |
|
|
|
|
|
|
|
|
|
|
|
0.5% |
|
|
|
|
|
|
1.8% |
|
|
|
|
|
|
|
|
1.7% |
|
|
|
|
1.1% |
|
|
|
|
|
|
|
95 |
|
|
|
|
|
|
|
|
|
|
|
|
|
|
|
|
|
|
|
||||||||
|
|
Netherlands |
|
|
|
|
|
|
|
|
11.1% |
|
|
|
|
|
|
6.3% |
|
|
|
|
|
|
|
|
4.7% |
|
|
|
|
2.3% |
|
|
|
|
|
|
|
|
|
|
|
|
|
|
|
|
|
|
|
|
|
|
|
|
|
|
||||||||||||
|
|
|
|
|
|
|
|
|
|
|
|
|
|
|
|
|
|
|
|
|
|
|
|
|
|
|
|
|
|
|
|
|
|
|
90 |
|
|
|
|
|
|
|
|
|
|
|
|
|
|
|
|
|
|
|
||||||||||||||||
|
|
Norway |
|
|
|
|
|
|
|
|
|
|
|
8.7% |
|
|
|
|
|
|
1.9% |
|
|
|
|
|
|
|
|
-2.6% |
|
|
|
|
1.5% |
|
|
|
|
|
|
|
|
|
|
|
|
|
|
|
|
|
|
|
|
|
|
|
|
|
|
|||||||||
Deutsche |
|
|
|
|
|
|
|
|
|
|
|
|
|
|
|
|
|
|
|
|
|
|
|
|
|
|
|
|
|
|
|
|
|
|
|
|
|
|
Jan-16 |
Mar-16 Apr-16 |
May-16 Jun-16 Jul-16 Aug-16 |
Sep-16 Oct-16 Nov-16 Dec-16 |
Jan-17 Feb-17 Mar-17 |
Apr-17 |
|
Sep-17 Oct-17 |
Nov-17 Dec-17 Jan-18 |
Feb-18 Mar-18 Apr-18 May-18 Jun-18 |
Jul-18 |
Aug-18 |
||||||||||||||||||||
|
|
|
|
|
|
|
|
|
|
|
|
|
|
|
|
|
|
|
|
|
|
|
|
|
|
|
|
|
|
|
|
|
|
|
|
|
|
|
|
|
|
|||||||||||||||||||||||||||||
|
Sweden |
|
|
|
|
|
|
|
|
|
|
|
13.7% |
|
|
|
|
|
|
-0.8% |
|
|
|
|
|
|
|
|
-9.2% |
|
|
|
|
0.6% |
|
|
|
|
|
|
|
|
|
|
|
|
||||||||||||||||||||||||
|
UK |
|
|
|
|
|
|
|
|
|
|
|
7.9% |
|
|
|
|
|
|
3.3% |
|
|
|
|
|
|
|
|
2.8% |
|
|
|
|
1.9% |
|
|
|
|
|
|
|
|
|
|
|
Feb16- |
|
|
|
|
May17Jun17- |
Jul17Aug17- |
|
|
|
|||||||||||||||
|
|
Spain |
|
|
|
|
|
|
|
|
|
|
|
12.4% |
|
|
|
|
|
|
2.9% |
|
|
|
|
|
|
|
|
6.0% |
|
|
|
|
2.5% |
|
|
|
|
|
|
|
|
|
|
|
|
|
|
|
|
|
|
|
|
|
|
|
|
|
|
|
|
|
||||||
|
|
Switzerland |
|
|
|
|
|
|
|
|
0.8% |
|
|
|
|
|
|
0.8% |
|
|
|
|
|
|
|
|
-1.0% |
|
|
|
-1.3% |
|
|
|
|
|
|
|
|
|
|
|
|
|
12m cumulated exising house transactions |
|
|
12m cumulated building permits |
|
|
|
|||||||||||||||||||
|
|
|
|
|
|
|
|
|
|
|
|
|
|
|
|
|
|
|
|
|
|
|
|
|
|
|
|
|
|
|
|
|
|
|
|
|
|
|
|
|
|
|
|
|
|
|
|
|
|
|
|
|
|
|
|
|
|
|
|
|
||||||||||
|
|
|
|
|
|
|
|
|
|
|
|
|
|
|
|
|
|
|
|
|
|
|
|
|
|
|
|
|
|
|
|
|
|
|
|
|
|
|
|
|
|
|
|
|
|
|
|
|
|
|
|
|
|
|
|
|
|
|
|
|
|
|
|
|
||||||
Bank |
|
Average |
|
|
|
|
|
|
|
|
|
|
|
7.3% |
|
|
|
|
|
|
1.9% |
|
|
|
|
|
|
|
|
-0.1% |
|
|
|
|
1.4% |
|
|
|
|
|
|
|
|
|
|
|
|
|
|
|
|
|
|
|
|
|
|
|
|
|
|
|
|
|
||||||
|
Average SGO Mix |
|
|
|
|
6.7% |
|
|
|
|
|
|
1.4% |
|
|
|
|
|
|
|
|
-1.8% |
|
|
|
|
1.3% |
|
|
|
|
|
|
|
|
|
|
|
|
|
|
|
|
|
|
|
|
|
|
|
|
|
|
|
|
|
||||||||||||||
|
|
|
|
|
|
|
|
|
|
|
|
|
|
|
|
|
|
|
|
|
|
|
|
|
|
|
|
|
|
|
|
|
|
|
|
|
|
|
|
|
|
|
|
|
|
|
|
|
|
|
|
|
||||||||||||||||||
AG/London |
|
Source: Deutsche Bank, Euroconstruct |
|
|
|
|
|
|
|
|
|
|
|
|
|
|
|
|
|
|
|
|
|
|
|
|
|
|
|
|
|
|
|
|
|
|
Source: Deutsche Bank, Factset, Datastream |
|
|
|
|
|
|
|
|
|
|
|
|
|||||||||||||||||||||
|
|
|
|
|
|
|
|
|
|
|
|
|
|
|
|
|
|
|
|
|
|
|
|
|
|
|
|
|
|
|
|
|
|
|
|
|
|
|
|
|
|
|
|
|
|
|
||||||||||||||||||||||||
|
|
|
|
|
|
|
|
|
|
|
|
|
|
|
|
|
|
|
|
|
|
|
|
|
|
|
|
|
|
|
|
|
|
|
|
|
|
|
|
|
|
|
|
|
|
|
|
|||||||||||||||||||||||
|
|
|
|
|
|
|
|
|
|
|
|
|
|
|
|
|
|
|
|
|
|
|
|
|
|
|
|
|
|
|
|
|
|
|
|
|
|
|
|
|
|
|
|
|
|
|
|
|
|
|
|
|
|
|
|
|
|
|
|
|
|
|
|
|
|
|
|
|
|
|
|
|
|
|
|
|
|
|
|
|
|
|
|
|
|
|
|
|
|
|
|
|
|
|
|
|
|
|
|
|
|
|
|
|
|
|
|
|
|
|
|
|
|
|
|
|
|
|
|
|
|
|
|
|
|
|
|
|
|
|
|
|
|
|
|
|
|
|
|
|
|
Building European |
2018 December 3 Materials Building |
Construction & |
|
vk.com/id446425943
Deutsche |
Emerging Markets: More upside than downside potential |
|
|
|
|
|
|
|
|
|
|
|
|
|
|
|
|
|
|
|
|
|
|
|
|
|
|
|
||||||||||||||||||||||||
Improving demand growth profile in 2019 in EM |
|
|
|
|
|
|
|
|
|
|
|
|
|
|
|
|
|
|
|
|
|
|
|
|
|
|
|
|
|
|
|
|
||||||||||||||||||||
Bank |
|
|
|
■ |
Driven by a timid recovery in oil exporting countries (already initiated in 2018), we forecast an improvement of the cement demand in EM in 2019. |
|||||||||||||||||||||||||||||||||||||||||||||||
AG/London |
|
|
|
■ |
We believe the recent decrease of oil price should not impact 2019, as we usually see a 1 year lag between oil price and cement demand evolution. |
|||||||||||||||||||||||||||||||||||||||||||||||
|
|
|
|
|||||||||||||||||||||||||||||||||||||||||||||||||
|
|
|
|
■ |
Our country by country bottom-up analysis suggests, cement demand should improve on LafargeHolcim EM footprint to more than 4%. |
|||||||||||||||||||||||||||||||||||||||||||||||
|
|
|
|
■ |
This is significantly higher than the levels seen in 2015-16 which were impacted by negative demand evolution in oil exporting countries. |
|||||||||||||||||||||||||||||||||||||||||||||||
|
|
|
|
|
|
|
|
|
|
|
|
|
|
|
|
|
|
|
|
|
|
|
|
|
|
|
|
|
|
|||||||||||||||||||||||
|
|
Figure 48: Cement demand vs. GDP growth in Emerging countries |
|
|
|
|
|
Figure 49: Cement demand growth on cement companies’ EM |
|
|
|
|
||||||||||||||||||||||||||||||||||||||||
|
|
|
|
|
|
|
|
|
|
|
|
|
|
|
|
|
|
|
|
|
|
|
|
|
|
|
footprints |
|
|
|
|
|
|
|
|
|
|
|
|
|
|
|
|
|
|
|
|
|
||||
|
|
|
|
|
|
|
|
|
|
2013 |
|
2014 |
|
2015 |
2016 |
|
2017 |
2018E |
|
|
|
2019E |
|
|
|
|
|
|
|
|
|
|
2013 |
|
2014 |
2015 |
|
2016 |
|
|
|
2017 |
2018E |
|
|
2019E |
|
|||||
|
|
Cement Oil exp |
|
7.6% |
|
2.6% |
|
1.2% |
-2.8% |
|
-3.7% |
0.0% |
|
2.8% |
|
|
Buzzi |
|
|
|
-4.5% |
|
3.1% |
8.4% |
|
2.5% |
|
|
|
2.5% |
1.5% |
0.0% |
|
|||||||||||||||||||
|
|
Cement Others |
|
0.8% |
|
4.5% |
|
6.5% |
3.5% |
|
2.2% |
3.6% |
|
3.3% |
|
|
Cemex |
|
|
|
-2.0% |
|
4.5% |
8.4% |
|
2.2% |
|
|
|
1.7% |
1.9% |
1.4% |
|
|||||||||||||||||||
|
|
Total Cement |
|
1.9% |
|
4.2% |
|
5.7% |
2.5% |
|
1.3% |
3.1% |
|
3.2% |
|
|
CRH |
|
|
|
5.3% |
|
6.4% |
7.4% |
|
1.0% |
|
|
|
1.6% |
4.9% |
6.5% |
|
|||||||||||||||||||
|
|
GDP Oil exp. |
|
4.9% |
|
4.2% |
|
2.7% |
1.8% |
|
2.5% |
2.9% |
|
3.6% |
|
|
Heidelberg |
|
|
|
4.7% |
|
3.2% |
3.3% |
|
2.6% |
|
|
|
3.1% |
4.2% |
3.9% |
|
|||||||||||||||||||
|
|
GDP others EM |
|
3.9% |
|
4.0% |
|
4.6% |
4.2% |
|
4.2% |
4.4% |
|
4.5% |
|
|
LafargeHolcim |
|
|
|
5.1% |
|
3.5% |
3.8% |
|
0.8% |
|
|
|
0.9% |
3.5% |
4.1% |
|
|||||||||||||||||||
|
|
Total GDP |
|
|
|
|
|
4.1% |
|
4.0% |
|
4.3% |
3.8% |
|
3.9% |
4.1% |
|
4.4% |
|
|
Titan Cement |
|
|
|
0.1% |
|
5.4% |
1.5% |
|
4.8% |
|
|
|
-3.8% |
-0.5% |
0.9% |
|
|||||||||||||||
|
|
|
|
|
|
|
|
|
|
|
|
|
|
|
|
|
|
|
|
|
|
|
|
|
|
|
|
|
|
|
|
|
|
|
|
|
|
|
|
|
|
|||||||||||
|
Source:Deutsche Bank, IMF, Factset, Bloomberg Finance LP |
|
|
|
|
|
|
|
|
|
|
|
|
|
Source:Deutsche Bank, Company data, Bloomberg Finance LP |
|
|
|
|
|
|
|
|
|
|
|
|
|
|
|
||||||||||||||||||||||
|
|
|
|
|
|
|
|
|
|
|
|
|
|
|
|
|
|
|
|
|
|
|
|
|
|
|
|
|
||||||||||||||||||||||||
|
|
|
|
|
|
|
|
|
|
|
|
|
|
|
|
|
|
|
|
|
|
|
|
|
|
|
|
|
|
|
||||||||||||||||||||||
|
|
|
|
|
|
|
|
|
|
|
|
|
|
|
|
|
|
|
|
|
|
|
|
|
|
|
|
|
|
|
||||||||||||||||||||||
|
|
Figure 50: Cement demand growth vs. oil price in oil exporting |
|
|
|
|
|
|
Figure 51: Cement demand growth vs. coal price in Indonesia |
|
|
|
|
|||||||||||||||||||||||||||||||||||||||
|
|
countries |
|
|
|
|
|
|
|
|
|
|
|
|
|
|
|
|
|
|
|
|
|
|
|
|
|
|
|
|
|
|
|
|
|
|
|
|
|
|
|
|
|
|
|
|
||||||
|
110 |
|
|
|
|
|
|
|
|
|
|
|
|
|
|
|
|
|
|
|
14% |
|
140 |
|
|
|
|
|
|
|
|
|
|
|
|
|
|
|
|
|
|
|
|
|
|
20% |
|
|||||
|
100 |
|
|
|
|
|
|
|
|
|
|
|
|
|
|
|
|
|
|
|
12% |
|
130 |
|
|
|
|
|
|
|
|
|
|
|
|
|
|
|
|
|
|
|
|
|
|
18% |
|
|||||
|
|
|
|
|
|
|
|
|
|
|
|
|
|
|
|
|
|
|
|
10% |
|
120 |
|
|
|
|
|
|
|
|
|
|
|
|
|
|
|
|
|
|
|
|
|
|
16% |
|
||||||
|
|
|
|
|
|
|
|
|
|
|
|
|
|
|
|
|
|
|
|
|
|
|
|
|
|
|
|
|
|
|
|
|
|
|
|
|
|
|
|
|
|
|
|
|
|
|||||||
|
90 |
|
|
|
|
|
|
|
|
|
|
|
|
|
|
|
|
|
Bloomberg |
8% |
|
110 |
|
|
|
|
|
|
|
|
|
|
|
|
|
|
|
|
|
|
|
|
|
|
14% |
|
||||||
|
|
|
|
|
|
|
|
|
|
|
|
|
|
|
|
|
|
|
|
6% |
|
100 |
|
|
|
|
|
|
|
|
|
|
|
|
|
|
|
|
|
|
|
|
|
|
12% |
|
||||||
|
80 |
|
|
|
|
|
|
|
|
|
|
|
|
|
|
|
|
|
consensus $60 |
|
|
|
|
|
|
|
|
|
|
|
|
|
|
|
|
|
|
|
|
|
|
|
|
|||||||||
|
|
|
|
|
|
|
|
|
|
|
|
|
|
|
|
|
|
4% |
|
|
|
|
|
|
|
|
|
|
|
|
|
|
|
|
|
|
|
|
|
|
|
|
|
|
|
|
||||||
|
70 |
|
|
|
|
|
|
|
|
|
|
|
|
|
|
|
|
|
|
|
|
90 |
|
|
|
|
|
|
|
|
|
|
|
|
|
|
|
|
|
|
|
|
|
|
10% |
|
||||||
|
|
|
|
|
|
|
|
|
|
|
|
|
|
|
|
|
|
|
|
2% |
|
80 |
|
|
|
|
|
|
|
|
|
|
|
|
|
|
|
|
|
|
|
|
|
|
8% |
|
||||||
|
|
|
|
|
|
|
|
|
|
|
|
|
|
|
|
|
|
|
|
|
|
|
|
|
|
|
|
|
|
|
|
|
|
|
|
|
|
|
|
|
|
|
|
|
|
|||||||
|
60 |
|
|
|
|
|
|
|
|
|
|
|
|
|
|
|
|
|
|
|
|
0% |
|
70 |
|
|
|
|
|
|
|
|
|
|
|
|
|
|
|
|
|
|
|
|
|
|
6% |
|
||||
|
|
|
|
|
|
|
|
|
|
|
|
|
|
|
|
|
|
|
|
|
|
|
|
|
|
|
|
|
|
|
|
|
|
|
|
|
|
|
|
|||||||||||||
|
50 |
|
|
|
|
|
|
|
|
|
|
|
|
|
|
|
|
|
|
|
-2% |
|
60 |
|
|
|
|
|
|
|
|
|
|
|
|
|
|
|
|
|
|
|
|
|
|
4% |
|
|||||
|
|
|
|
|
|
|
|
|
|
|
|
|
|
|
|
|
|
|
|
|
|
|
|
|
|
|
|
|
|
|
|
|
|
|
|
|
|
|
|
|
|
|
|
|
|
|
||||||
|
|
|
|
|
|
|
|
|
|
|
|
|
|
|
|
|
|
|
|
-4% |
|
50 |
|
|
|
|
|
|
|
|
|
|
|
|
|
|
|
|
|
|
|
|
|
|
2% |
|
||||||
|
|
|
|
|
|
|
|
|
|
|
|
|
|
|
|
|
|
|
|
|
|
|
|
|
|
|
|
|
|
|
|
|
|
|
|
|
|
|
|
|
|
|
|
|
|
|||||||
|
|
|
|
|
|
|
|
|
|
|
|
|
|
|
|
|
|
|
|
|
|
|
|
|
|
|
|
|
|
|
|
|
|
|
|
|
|
|
|
|
|
|
|
|
|
|
|
|
||||
|
40 |
|
|
|
|
|
|
|
|
|
|
|
|
|
|
|
|
|
|
|
|
-6% |
|
40 |
|
|
|
|
|
|
|
|
|
|
|
|
|
|
|
|
|
|
|
|
|
|
|
0% |
|
|||
|
|
|
2008 |
|
|
2011 |
|
|
2014 |
|
|
|
2018E |
2019E |
|
|
|
|
|
|
|
|
|
|
|
|
|
|
|
|
|
|
|
|
|
|
|
|
|
|
||||||||||||
|
2007 |
2009 |
2010 |
2012 |
2013 |
2015 |
2016 |
2017 |
|
|
|
|
2007 |
|
|
2008 |
2009 |
2010 |
2011 |
2012 |
2013 |
|
|
2014 |
2015 |
2016 |
2017 |
2018E |
2019E |
|||||||||||||||||||||||
|
|
|
|
|
|
|
|
|
Brent crude ($/bbl, lhs) |
|
|
|
|
Cement demand growth oil exp. (%, rhs) |
|
|
|
|
|
|
|
|
|
|
|
Coal Newcastle ($/t, lhs) |
|
|
|
|
Cement demand growth in Indonesia |
|||||||||||||||||||||
|
|
|
|
|
|
|
|
|
|
|
|
|
|
|
|
|
|
|
|
|
|
|
|
|
|
|
|
|||||||||||||||||||||||||
|
Source:Deutsche Bank estimates, Bloomberg Finance LP. Note: Brent crude 2019 price forecast as of 28 Nov. |
|
|
|
|
|
Source:Deutsche Bank estimates, Bloomberg Finance LP |
|
|
|
|
|
|
|
|
|
|
|
|
|
|
|
||||||||||||||||||||||||||||||
|
|
|
|
|
|
|
|
|
|
|
|
|
|
|
|
|
|
|
|
|
||||||||||||||||||||||||||||||||
|
|
|
|
|
|
|
|
|
|
|
|
|
|
|
|
|
|
|
|
|
|
|
|
|
|
|
|
|
|
|
|
|
|
|
|
|
|
|
|
|
|
|
|
|
|
|
|
|
|
|
|
|
23 Page
Building European |
2018 December 3 Materials Building |
Construction & |
|

vk.com/id446425943
24Page |
|
Capacity utilisation to improve on most companies’ EM footprints |
|
|
|
|
|
||||||
|
■ |
Our bottom-up analysis of supply and demand on key EM countries suggest that capacity utilization on both LafargeHolcim and Heidelberg EM |
|||||||||||
|
|
|
footprints should improve in 2019. |
|
|
|
|
|
|
|
|
||
|
|
■ |
Algeria capacity utilization should continue to decrease in 2019E - we see however more limited risks on prices after the 15-20% price adjustment |
||||||||||
|
|
|
LafargeHolcim did in 2018 to align again vs. competition (we believe LafargeHolcim was enjoying a strong price premium when market was sold out) |
||||||||||
|
|
|
|
|
|
|
|
|
|||||
|
|
Figure 52: Supply / Demand evolution in 2019E in Middle East Africa |
|
Figure 53: Supply / Demand evolution in 2019E in Latin America |
|||||||||
|
|
|
|
|
|
|
|
|
|
|
Capacity utilization |
|
|
|
|
|
|
% demand growth |
% capacity growth |
Capacity utilization |
|
|
% demand growth |
% capacity growth |
|
|
|
|
|
|
|
change (bps) |
|
|
change (bps) |
|
|
||||
|
|
|
|
|
|
|
|
|
|
|
|
||
|
|
Tanzania |
7.0% |
0.0% |
560 |
|
Colombia |
3.0% |
0.0% |
240 |
|
|
|
|
|
Nigeria |
|
6.0% |
1.4% |
365 |
|
Costa Rica |
3.0% |
0.0% |
240 |
|
|
|
|
Iraq |
|
5.0% |
2.4% |
203 |
|
Brazil |
3.0% |
0.4% |
209 |
|
|
|
|
Morocco |
0.0% |
0.0% |
0 |
|
Ecuador |
1.0% |
0.0% |
80 |
|
|
|
|
|
South Africa |
0.0% |
0.0% |
0 |
|
Mexico |
0.0% |
1.2% |
-97 |
|
|
|
|
|
Kenya |
|
6.0% |
7.8% |
-134 |
|
Argentina |
-5.0% |
0.0% |
-400 |
|
|
|
|
Egypt |
|
4.0% |
6.8% |
-207 |
|
|
|
|
|
|
|
|
|
Ghana |
|
8.5% |
11.5% |
-215 |
|
|
|
|
|
|
|
|
|
Algeria |
|
-2.0% |
19.0% |
-1411 |
|
|
|
|
|
|
|
|
|
|
|
|
|
|
|
|
|
|
|
|
|
|
|
Turkey |
|
-25.0% |
2.2% |
-2130 |
|
|
|
|
|
|
|
|
|
Source:Deutsche Bank estimates |
|
|
|
Source:Deutsche Bank estimates |
|
|
|
|
|||
|
|
|
|
|
|
|
|
|
|||||
|
|
|
|
|
|
||||||||
|
|
|
|
|
|
||||||||
|
|
Figure 54: Supply / Demand evolution in 2019E in Asia Pacific |
|
Figure 55: Supply / Demand evolution in 2019E on companies’ EM |
|||||||||
|
|
|
|
|
|
|
|
footprint |
|
|
|
|
|
|
|
|
|
|
|
|
|
|
|
|
|
||
|
|
|
|
% demand growth |
% capacity growth |
Capacity utilization |
|
|
% demand growth |
% capacity growth |
Capacity utilization |
|
|
|
|
|
|
change (bps) |
|
|
change (bps) |
|
|
||||
|
|
|
|
|
|
|
|
|
|
|
|||
|
|
India |
|
8.5% |
2.8% |
441 |
|
Buzzi |
0.0% |
1.2% |
-97 |
|
|
|
|
Thailand |
5.0% |
0.0% |
400 |
|
Cemex |
1.4% |
1.7% |
-19 |
|
|
|
|
|
Philippines |
8.0% |
5.3% |
204 |
|
CRH |
6.5% |
3.8% |
206 |
|
|
|
|
|
|
Heidelberg |
3.9% |
3.5% |
36 |
|
|
|||||
|
|
Indonesia |
5.5% |
3.0% |
194 |
|
|
|
|||||
|
|
|
LafargeHolcim |
4.1% |
3.8% |
20 |
|
|
|||||
|
|
Malaysia |
0.0% |
0.0% |
0 |
|
|
|
|||||
|
|
|
Titan Cement |
0.9% |
5.0% |
-315 |
|
|
|||||
|
|
|
|
|
|
|
|
|
|
||||
|
|
Bangladesh |
6.5% |
8.1% |
-117 |
|
|
|
|
|
|
|
|
|
|
Source:Deutsche Bank estimates |
|
|
|
Source:Deutsche Bank estimates |
|
|
|
|
|||
|
|
|
|
|
|
|
|
|
|||||
AG/London Bank Deutsche |
|
|
|
|
|
|
|
|
|
|
|
|
|
|
|
|
|
|
|
|
|
|
|
|
|
|
|
Building European |
2018 December 3 Materials Building |
Construction & |
|

vk.com/id446425943
Deutsche |
ROCE analysis for new project suggests LHN & HEI EM footprints are largely derisked. |
|
|
|
|
|
|
|
|
|
|
|
|
|
||||||||||||||||||||||||||||||
|
|
|
|
|
|
|
|
|
|
|
|
|
|
|||||||||||||||||||||||||||||||
Bank |
|
■ |
After 6 years of Supply / Demand balance deterioration we believe LafargeHolcim and Heidelberg EM footprints should see an improvement in 2019. |
|||||||||||||||||||||||||||||||||||||||||
|
■ |
This is due to both demand improvement on their respective footprints but also to the moderation of the supply reflecting more normalized prices / |
||||||||||||||||||||||||||||||||||||||||||
|
|
|||||||||||||||||||||||||||||||||||||||||||
AG/London |
|
|
|
|
margins conditions. |
|
|
|
|
|
|
|
|
|
|
|
|
|
|
|
|
|
|
|
|
|
|
|
|
|
|
|
|
|
|
|
|
|
|
|
|
|
||
|
|
|
|
|
|
|
|
|
|
|
|
|
|
|
|
|
|
|
|
|
|
|
|
|
|
|
|
|
|
|
|
|
|
|
|
|
|
|
|
|
|
|
|
|
13% |
|
|
|
|
|
|
|
|
|
|
|
|
|
|
|
|
|
|
|
|
|
|
|
|
|
|
|
|
|
|
|
|
|
|
|
|
|
|
|
|
|
|
||
|
Figure 56:ROCE for a new project on LafargeHolcim EM footprint |
|
|
|
|
Figure 57:Supply / Demand evolution on LafargeHolcim EM footprint |
||||||||||||||||||||||||||||||||||||||
|
14% |
|
|
|
|
|
|
|
|
|
|
|
|
|
8% |
|
|
|
|
|
|
|
|
|
|
|
|
|
|
|
|
|
|
|
|
|
|
|
|
|
|
|
||
|
|
|
|
|
|
|
|
|
|
|
|
|
|
|
|
7% |
|
|
|
|
|
|
|
|
|
|
|
|
|
|
|
|
|
|
|
|
|
|
|
|
|
|
|
|
|
12% |
|
|
|
|
|
|
|
|
|
|
|
|
|
|
|
|
|
|
|
|
|
|
|
|
|
|
|
|
|
|
|
|
|
|
|
|
|
|
|
|
|
|
|
|
11% |
|
|
|
|
|
|
|
|
|
|
|
|
|
6% |
|
|
|
|
|
|
|
|
|
|
|
|
|
|
|
|
|
|
|
|
|
|
|
|
|
|
|
||
|
|
|
|
|
|
|
|
|
|
|
|
|
|
|
|
|
|
|
|
|
|
|
|
|
|
|
|
|
|
|
|
|
|
|
|
|
|
|
|
|
|
|
||
|
10% |
|
|
|
|
|
|
|
|
|
|
|
|
|
5% |
|
|
|
|
|
|
|
|
|
|
|
|
|
|
|
|
|
|
|
|
|
|
|
|
|
|
|
||
|
9% |
|
|
|
|
|
|
|
|
|
|
|
|
|
4% |
|
|
|
|
|
|
|
|
|
|
|
|
|
|
|
|
|
|
|
|
|
|
|
|
|
|
|
||
|
|
|
|
|
|
|
|
|
|
|
|
|
|
|
|
|
|
|
|
|
|
|
|
|
|
|
|
|
|
|
|
|
|
|
|
|
|
|
|
|
|
|
||
|
8% |
|
|
|
|
|
|
|
|
|
|
|
|
|
3% |
|
|
|
|
|
|
|
|
|
|
|
|
|
|
|
|
|
|
|
|
|
|
|
|
|
|
|
||
|
7% |
|
|
|
|
|
|
|
|
|
|
|
|
|
|
|
|
|
|
|
|
|
|
|
|
|
|
|
|
|
|
|
|
|
|
|
|
|
|
|
|
|||
|
|
|
|
|
|
|
|
|
|
|
|
|
|
|
|
|
|
|
|
|
|
|
|
|
|
|
|
|
|
|
|
|
|
|
|
|
|
|
|
|
|
|
||
|
6% |
|
|
|
|
|
|
|
|
|
|
|
|
|
2% |
|
|
|
|
|
|
|
|
|
|
|
|
|
|
|
|
|
|
|
|
|
|
|
|
|
|
|
||
|
|
|
|
|
|
|
|
|
|
|
|
|
|
|
|
|
|
|
|
|
|
|
|
|
|
|
|
|
|
|
|
|
|
|
|
|
|
|
|
|
|
|
||
|
5% |
|
|
|
|
|
|
|
|
|
|
|
|
|
1% |
|
|
|
|
|
|
|
|
|
|
|
|
|
|
|
|
|
|
|
|
|
|
|
|
|
|
|
||
|
4% |
|
|
|
|
|
|
|
|
|
|
|
|
|
0% |
|
|
|
|
|
|
|
|
|
|
|
|
|
|
|
|
|
|
|
|
|
|
|
|
|
|
|
||
|
|
|
|
|
2010 |
2011 |
2012 |
2013 |
2014 |
2015 |
2016 |
2017 |
2018E |
|
|
|
|
|
|
|
|
|
|
|
|
|
|
|
|
|
|
|
|
|
|
|
|
|
|
|
||||
|
|
|
|
|
2012 |
2013 |
2014 |
2015 |
2016 |
2017 |
2018E |
2019E |
2020E |
|||||||||||||||||||||||||||||||
|
|
|
|
|
|
|
|
|
|
|
|
|
|
|
|
|||||||||||||||||||||||||||||
|
|
|
|
|
|
|
|
|
|
|
|
|
|
|
|
|
|
|
|
|
|
|
|
|
|
|
|
YoY Demand growth % |
|
|
|
|
|
|
|
|
YoY Supply growth % |
|
|
|
|
|||
|
|
|
|
|
|
|
|
|
|
|
|
|
|
|
|
|
|
|
|
|
|
|
|
|
|
|
|
|
|
|
|
|
|
|
|
|
|
|||||||
|
Source:Deutsche Bank, Company data |
|
|
|
|
|
|
|
|
|
|
Source:Deutsche Bank estimates, Company data |
|
|
|
|
|
|
|
|
|
|
|
|
|
|
|
|||||||||||||||||
|
|
|
|
|
|
|
|
|
|
|
|
|
|
|
|
|
|
|
|
|
|
|
|
|
|
|||||||||||||||||||
|
|
|
|
|
|
|
|
|
|
|
|
|
|
|
|
|
|
|
|
|
|
|||||||||||||||||||||||
|
|
|
|
|
|
|
|
|
|
|
|
|
|
|
|
|
|
|
|
|
|
|||||||||||||||||||||||
|
Figure 58:ROCE for a new project on Heidelberg EM footprint |
|
|
|
|
Figure 59:Supply / Demand evolution on Heidelberg EM footprint |
|
|
|
|
||||||||||||||||||||||||||||||||||
|
14% |
|
|
|
|
|
|
|
|
|
|
|
|
|
|
14% |
|
|
|
|
|
|
|
|
|
|
|
|
|
|
|
|
|
|
|
|
|
|
|
|
|
|||
|
|
|
|
|
|
|
|
|
|
|
|
|
|
|
|
|
|
|
|
|
|
|
|
|
|
|
|
|
|
|
|
|
|
|
|
|
|
|
||||||
|
13% |
|
|
|
|
|
|
|
|
|
|
|
|
|
|
12% |
|
|
|
|
|
|
|
|
|
|
|
|
|
|
|
|
|
|
|
|
|
|
|
|
|
|||
|
12% |
|
|
|
|
|
|
|
|
|
|
|
|
|
|
|
|
|
|
|
|
|
|
|
|
|
|
|
|
|
|
|
|
|
|
|
|
|
|
|
||||
|
|
|
|
|
|
|
|
|
|
|
|
|
|
|
|
|
|
|
|
|
|
|
|
|
|
|
|
|
|
|
|
|
|
|
|
|
|
|
|
|
|
|
|
|
|
11% |
|
|
|
|
|
|
|
|
|
|
|
|
|
|
10% |
|
|
|
|
|
|
|
|
|
|
|
|
|
|
|
|
|
|
|
|
|
|
|
|
|
|||
|
10% |
|
|
|
|
|
|
|
|
|
|
|
|
|
|
8% |
|
|
|
|
|
|
|
|
|
|
|
|
|
|
|
|
|
|
|
|
|
|
|
|
|
|||
|
|
|
|
|
|
|
|
|
|
|
|
|
|
|
|
|
|
|
|
|
|
|
|
|
|
|
|
|
|
|
|
|
|
|
|
|
|
|
|
|
||||
|
9% |
|
|
|
|
|
|
|
|
|
|
|
|
|
|
|
|
|
|
|
|
|
|
|
|
|
|
|
|
|
|
|
|
|
|
|
|
|
|
|
|
|
|
|
|
8% |
|
|
|
|
|
|
|
|
|
|
|
|
|
|
6% |
|
|
|
|
|
|
|
|
|
|
|
|
|
|
|
|
|
|
|
|
|
|
|
|
|
|||
|
7% |
|
|
|
|
|
|
|
|
|
|
|
|
|
|
4% |
|
|
|
|
|
|
|
|
|
|
|
|
|
|
|
|
|
|
|
|
|
|
|
|
|
|||
|
|
|
|
|
|
|
|
|
|
|
|
|
|
|
|
|
|
|
|
|
|
|
|
|
|
|
|
|
|
|
|
|
|
|
|
|
|
|
|
|
||||
|
6% |
|
|
|
|
|
|
|
|
|
|
|
|
|
|
|
|
|
|
|
|
|
|
|
|
|
|
|
|
|
|
|
|
|
|
|
|
|
|
|
|
|
|
|
|
5% |
|
|
|
|
|
|
|
|
|
|
|
|
|
|
2% |
|
|
|
|
|
|
|
|
|
|
|
|
|
|
|
|
|
|
|
|
|
|
|
|
|
|||
|
4% |
|
|
|
|
|
|
|
|
|
|
|
|
|
|
0% |
|
|
|
|
|
|
|
|
|
|
|
|
|
|
|
|
|
|
|
|
|
|
|
|
|
|||
|
|
|
|
|
2010 |
2011 |
2012 |
2013 |
2014 |
2015 |
2016 |
2017 |
2018E |
|
|
|
|
|
|
|
|
YoY Demand growth % |
|
|
|
|
|
|
|
YoY Supply growth % |
|
|
|
|
||||||||||
|
|
|
|
|
|
|
|
|
|
|
|
|
|
|
|
2012 |
2013 |
2014 |
2015 |
2016 |
2017 |
2018E |
2019E |
2020E |
||||||||||||||||||||
|
|
|
|
|
|
|
|
|
|
|
|
|
|
|
|
|
|
|
|
|
|
|
|
|
|
|
|
|
|
|
||||||||||||||
|
Source:Deutsche Bank estimates, Company data |
|
|
|
|
|
|
|
|
|
Source:Deutsche Bank estimates, Company data |
|
|
|
|
|
|
|
|
|
|
|
|
|
|
|
||||||||||||||||||
|
|
|
|
|
|
|
|
|
|
|
|
|
|
|
|
|
|
|
|
|
|
|
|
|
||||||||||||||||||||
|
|
|
|
|
|
|
|
|
|
|
|
|
|
|
|
|
|
|
|
|
|
|
|
|
|
|
|
|
|
|
|
|
|
|
|
|
|
|
|
|
|
|
|
|
25 Page
Building European |
2018 December 3 Materials Building |
Construction & |
|

vk.com/id446425943
26 Page |
More upside than downside on LafargeHolcim and Heidelberg EM footprints. |
|
■ |
Our analysis shows a clear deterioration of EM profitabilties between 2014 and 2018. This is mainly due to aggressive pricing strategy from new |
|
|
|
entrants in a low demand growth environment. |
|
■ |
Since 2014, the number of ‘over-earning’ markets (where ROCE for a new project is > 10%) has decreased from 15 to 6. |
|
■ |
We see however limited risks on these six markets which enjoy currently high levels of prices / margins as no project from new entrant has been |
|
|
recorded in these countries. |
|
■ |
Conversely the number of ‘under-earning’ markets (ROCE for a new entrant < 5%) has increased from 1 to 12. |
|
■ |
Reflecting this, we believe that now both LafargeHolcim and Heidelberg EM footprints have more long-term upside than downside potential. |
Figure 60: ROCE for a new project in EM at 2014 economic conditions |
Figure 61: ROCE for a new project in EM at 2018 economic conditions |
|
40% |
25% |
|
35% |
||
20% |
||
30% |
||
|
||
25% |
15% |
|
|
||
20% |
10% |
|
|
||
15% |
5% |
|
|
||
10% |
0% |
|
|
||
5% |
-5% |
|
0% |
-10% |
Zambia |
Colombia |
Morocco |
Algeria |
Nigeria |
Costa Rica |
Ghana |
Mexico |
Kenya |
Ecuador |
Philippines |
Tanzania |
Indonesia |
South Africa |
Turkey |
Brazil |
Bangladesh |
Lebanon |
Egypt |
Malaysia |
Iraq |
Thailand |
India |
Argentina |
|
Morocco |
Mexico |
Ecuador |
Nigeria |
Costa Rica |
Lebanon |
Algeria |
Kenya |
Ghana |
India |
Argentina |
Iraq |
Philippines |
Colombia |
Bangladesh |
Thailand |
Indonesia |
Zambia |
Tanzania |
South Africa |
Turkey |
Brazil |
Egypt |
Malaysia |
Source: Deutsche Bank estimates, Company data |
|
|
|
|
|
|
|
|
|
|
|
|
|
|
|
|
Source: Deutsche Bank estimates, Company data |
|
|
|
|
|
|
|
|
|
|
|
|
|
|
|
|
|||||||||||||||
|
|
|
|
|
|
|
|
|
|
|
|
|
|
|
|
|
|
|
|
|
|
|
|
|
|
|
|
|
|
|
|
|||||||||||||||||
|
|
|
|
|
|
|
|
|
|
|
|
|
|
|
|
|
|
|
|
|
|
|
|
|
|
|
|
|
|
|
|
|
|
|
|
|
|
|
|
|
|
|
|
|
|
|
|
|
|
Figure 62: Share of LafargeHolcim sales by type of EM (2018 vs. 2014) |
|
Figure 63: Share of Heidelberg sales by type of EM (2018 vs. 2014) |
||||||||||||||||||||||
|
100% |
|
|
4% |
|
|
|
|
|
|
|
|
100% |
|
|
|
|
|
|
|
|
||||
|
90% |
|
|
|
|
|
30% |
|
|
|
90% |
|
|
|
|
|
|
|
|
||||||
|
80% |
|
|
|
|
|
|
|
|
80% |
|
|
|
|
|
|
|
|
|||||||
|
|
|
|
|
|
|
|
|
|
|
|
|
40% |
|
|
|
|
|
|
||||||
|
70% |
|
|
45% |
|
|
|
|
|
|
|
|
70% |
|
|
|
|
62% |
|
|
|||||
|
|
|
|
|
|
|
|
|
|
|
|
|
|
|
|
|
|
||||||||
|
60% |
|
|
|
|
|
|
|
|
|
|
|
60% |
|
|
|
|
|
|
|
|
||||
|
50% |
|
|
|
|
|
45% |
|
|
|
50% |
|
|
|
|
|
|
|
|
||||||
|
|
|
|
|
|
|
|
|
|
|
|
|
|
||||||||||||
|
|
|
|
|
|
|
|
|
|
|
|
|
|
|
|
|
|
|
|
|
|
|
|||
|
40% |
|
|
|
|
|
|
|
|
|
|
|
40% |
|
|
|
|
|
|
|
|
||||
|
|
|
|
|
|
|
|
|
|
|
|
|
|
|
|
|
|
|
|||||||
Deutsche |
30% |
|
|
51% |
|
|
|
|
|
|
|
|
30% |
|
60% |
|
|
25% |
|
|
|||||
|
20% |
|
|
|
|
|
|
|
|
|
|
20% |
|
|
|
|
|
|
|||||||
|
|
|
|
|
|
|
|
|
|
|
|
|
|
|
|
|
|
|
|
||||||
|
10% |
|
|
|
|
|
25% |
|
|
|
10% |
|
|
|
|
12% |
|
|
|||||||
|
|
|
|
|
|
|
|
|
|
|
|
|
|
|
0% |
|
|
|
|
|
|
||||
|
0% |
|
|
|
|
|
|
|
|
|
|
|
|
|
|
|
|
|
|
|
|||||
Bank |
|
|
|
|
|
2014 |
|
|
2018 |
|
|
|
|
|
|
|
2014 |
|
|
2018 |
|
|
|||
|
|
|
|
|
|
|
|
|
|
|
|
|
|
|
|
|
|
|
|
|
|||||
|
|
Over-earning (ROCE > 10%) |
|
Equilibrium (ROCE btw 5-10%) |
|
|
Under-earning (ROCE <5%) |
|
|
Over-earning (ROCE > 10%) |
|
Equilibrium (ROCE btw 5-10%) |
|
Under-earning (ROCE <5%) |
|||||||||||
AG/London |
|
|
|
|
|
|
|
|
|
||||||||||||||||
Source: Deutsche Bank estimates, Company data |
|
|
|
|
|
|
|
Source: Deutsche Bank estimates, Company data |
|
|
|
|
|
||||||||||||
|
|
|
|
|
|
|
|
|
|
|
|
||||||||||||||
|
|
|
|
|
|
|
|
|
|
|
|
|
|
|
|
|
|
|
|
|
|
|
|
|
|
Building European |
2018 December 3 Materials Building |
Construction & |
|
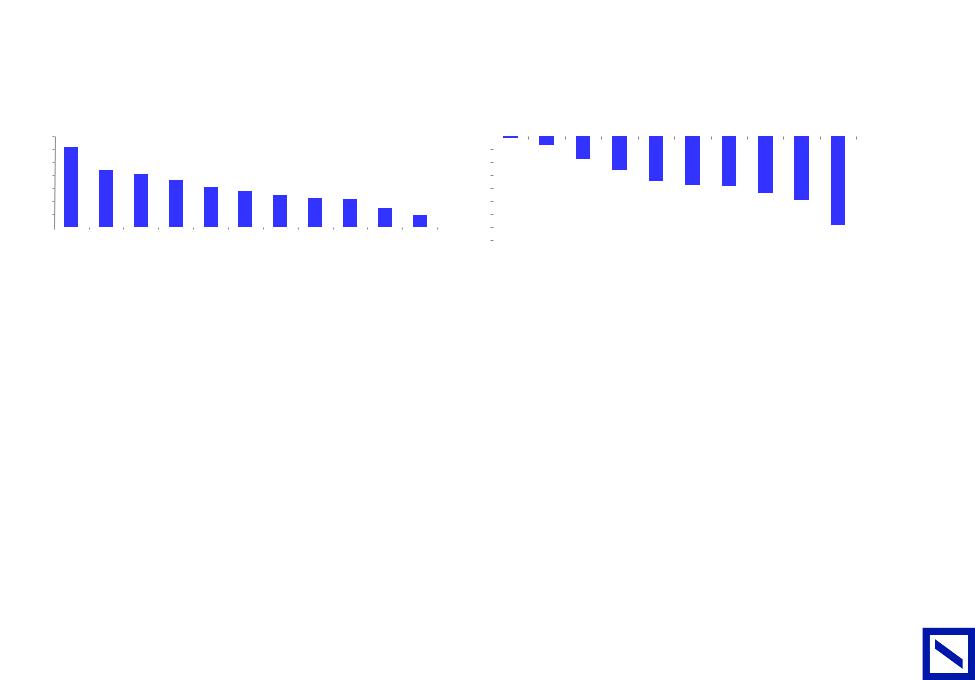
vk.com/id446425943
Deutsche |
Companies' exposure by region |
|
|
|
|
|
|
|
|
|
|
|
|
|
|
|
|
|
|
|
|
|
||||||||
■ |
Our historical analysis suggests that stocks with high renovation exposure in DM (Saint Gobain, Sika, Geberit) or high EM exposure have historically |
|||||||||||||||||||||||||||||
|
||||||||||||||||||||||||||||||
Bank |
|
|
resisted better to a sharp downturn. |
|
|
|
|
|
|
|
|
|
|
|
|
|
|
|
|
|
|
|
|
|
||||||
|
|
Conversely, Kingspan, CRH, Buzzi & Titan which have the highest exposure to new build in DM had in 2007-09 the lowest organic growth. |
||||||||||||||||||||||||||||
AG/London |
■ |
|||||||||||||||||||||||||||||
|
|
|
|
|
|
|
|
|
|
|
|
|
|
|
|
|
|
|
|
|
|
|
|
|
|
|
|
|
||
Figure 64: New-build in DM as % of Group Sales by company |
|
|
|
|
Figure 65: 2007-09 organic sales growth by company |
|
|
|
|
|||||||||||||||||||||
|
|
|
|
|
|
|
|
|
||||||||||||||||||||||
|
70% |
|
62% |
|
|
|
|
|
|
|
|
|
|
|
0% |
|
|
|
|
|
|
|
|
|
|
|
|
|
||
|
60% |
|
|
|
|
|
|
|
|
|
|
|
|
|
-5% |
|
-1% |
-4% |
|
|
|
|
|
|
|
|
|
|
||
|
|
|
|
|
|
|
|
|
|
|
|
|
|
|
-10% |
|
|
|
|
|
|
|
|
|
|
|
|
|||
|
50% |
|
|
44% |
41% |
|
|
|
|
|
|
|
|
|
|
|
|
-9% |
|
|
|
|
|
|
|
|
|
|||
|
40% |
|
|
|
37% |
|
|
|
|
|
|
|
|
-15% |
|
|
|
|
|
|
|
|
|
|
|
|
||||
|
|
|
|
|
|
|
|
|
|
|
|
|
|
|
|
|
|
|
|
|
|
|
|
|
|
|||||
|
|
|
|
|
|
31% |
|
|
|
|
|
|
|
|
|
|
|
-13% |
|
|
|
|
|
|
|
|
||||
|
|
|
|
|
|
|
28% |
|
|
|
|
|
|
|
|
|
|
|
|
|
|
|
|
|
|
|
|
|||
|
30% |
|
|
|
|
|
|
25% |
|
|
|
|
|
-20% |
|
|
|
|
|
-17% |
|
|
|
|
|
|
|
|||
|
|
|
|
|
|
|
|
23% |
22% |
|
|
|
|
|
|
|
|
-19% |
-19% |
|
|
|
|
|
||||||
|
|
|
|
|
|
|
|
|
|
|
|
|
|
|
|
|
|
|
|
|
|
|
|
|
||||||
|
20% |
|
|
|
|
|
|
|
|
|
|
15% |
|
-25% |
|
|
|
|
|
|
-22% |
|
|
|
||||||
|
|
|
|
|
|
|
|
|
|
|
|
|
|
|
|
|
|
|
|
|
|
|
||||||||
|
|
|
|
|
|
|
|
|
|
|
|
|
|
|
|
|
|
|
|
|
|
|
|
|
|
|
|
|||
|
10% |
|
|
|
|
|
|
|
|
|
|
|
9% |
|
-30% |
|
|
|
|
|
|
|
|
|
-24% |
|
|
|
||
|
|
|
|
|
|
|
|
|
|
|
|
|
|
|
|
|
|
|
|
|
|
|
|
|
|
|
||||
|
0% |
|
|
|
|
|
|
|
|
|
|
|
|
|
-35% |
|
|
|
|
|
|
|
|
|
|
|
|
|
||
|
|
Kingspan |
CRH |
Buzzi |
Titan |
Heidelberg |
Geberit |
GobainSaint |
Cemex |
LafargeHolcim |
Tarkett |
Sika |
Sika |
Geberit |
LafargeHolcim |
GobainSaint |
Heidelberg |
Cemex |
Titan |
Buzzi |
CRH |
Kingspan |
||||||||
|
|
|
|
|
|
|
|
|
|
|
|
|
|
|
-40% |
|
|
|
|
|
|
|
|
|
|
-34% |
|
|
||
|
|
|
|
|
|
|
|
|
|
|
|
|
|
|
|
|
|
|
|
|
|
|
|
|
|
|
|
|||
|
Source: Deutsche Bank estimates, Company data |
|
|
|
|
|
|
|
|
|
Source: Deutsche Bank, Company data |
|
|
|
|
|
|
|
|
|
|
|||||||||
|
|
|
|
|
|
|
|
|
|
|
|
|
|
|
|
|
|
|
|
|||||||||||
|
|
|
|
|
|
|
|
|
|
|
|
|
|
|
|
|
|
|
|
|||||||||||
|
|
|
|
|
|
|
|
|
|
|
|
|
|
|
|
|
|
|
|
|||||||||||
|
Figure 66: Companies' sales by geography and end markets |
|
|
|
|
|
|
|
|
|
|
|
|
|
|
|
|
|
|
|||||||||||
|
|
|
|
|
|
|
|
|
|
|
|
|
|
|
|
|
|
|
|
|
|
|
||||||||
|
|
|
|
|
|
|
|
Buzzi |
|
Cemex |
CRH |
|
Heidelberg |
LafargeHolcim |
Saint Gobain |
Tarkett |
|
Titan |
Geberit |
Kingspan |
Sika |
|
||||||||
|
|
|
|
|
|
|
|
|
|
|
|
|
|
|
|
|
|
|
|
|
|
|
|
|
||||||
|
North America New Build |
|
|
19% |
|
13% |
25% |
|
13% |
|
11% |
|
|
3% |
|
8% |
|
29% |
1% |
|
17% |
3% |
|
|
||||||
|
North America Infra |
|
|
|
13% |
|
9% |
19% |
|
9% |
|
8% |
|
|
1% |
|
0% |
|
20% |
0% |
|
0% |
6% |
|
|
|||||
|
North America Renovation |
|
|
6% |
|
4% |
8% |
|
4% |
|
3% |
|
|
5% |
|
34% |
|
9% |
2% |
|
2% |
8% |
|
|
||||||
|
W Europe New Build |
|
|
|
22% |
|
9% |
19% |
|
19% |
|
11% |
|
|
22% |
|
7% |
|
8% |
27% |
|
45% |
6% |
|
|
|||||
|
W Europe Infra |
|
|
|
|
13% |
|
5% |
7% |
|
11% |
|
7% |
|
|
5% |
|
0% |
|
5% |
0% |
|
0% |
11% |
|
|
||||
|
W Europe Renovation |
|
|
|
10% |
|
4% |
16% |
|
8% |
|
5% |
|
|
33% |
|
26% |
|
3% |
54% |
|
7% |
15% |
|
|
|||||
|
Eastern Europe Construction |
|
|
18% |
|
8% |
5% |
|
8% |
|
6% |
|
|
4% |
|
17% |
|
16% |
10% |
|
18% |
7% |
|
|
||||||
|
Emerging Markets Construction |
|
|
0% |
|
47% |
2% |
|
29% |
|
50% |
|
|
11% |
|
8% |
|
11% |
6% |
|
10% |
33% |
|
|
||||||
|
Others (Industrial segments) |
|
|
0% |
|
0% |
0% |
|
0% |
|
0% |
|
|
17% |
|
0% |
|
0% |
0% |
|
0% |
11% |
|
|
||||||
|
Total |
|
|
|
|
|
100% |
|
100% |
100% |
|
100% |
|
100% |
|
100% |
|
100% |
|
100% |
100% |
|
100% |
100% |
|
|
||||
|
Source: Deutsche Bank estimates, Company data |
|
|
|
|
|
|
|
|
|
|
|
|
|
|
|
|
|
|
|
|
|
|
|
||||||
|
|
|
|
|
|
|
|
|
|
|
|
|
|
|
|
|
|
|
|
|
|
|
|
|||||||
|
|
|
|
|
|
|
|
|
|
|
|
|
|
|
|
|
|
|
|
|
|
|
|
|
|
|
|
|
|
|
27 Page
Building European |
2018 December 3 Materials Building |
Construction & |
|
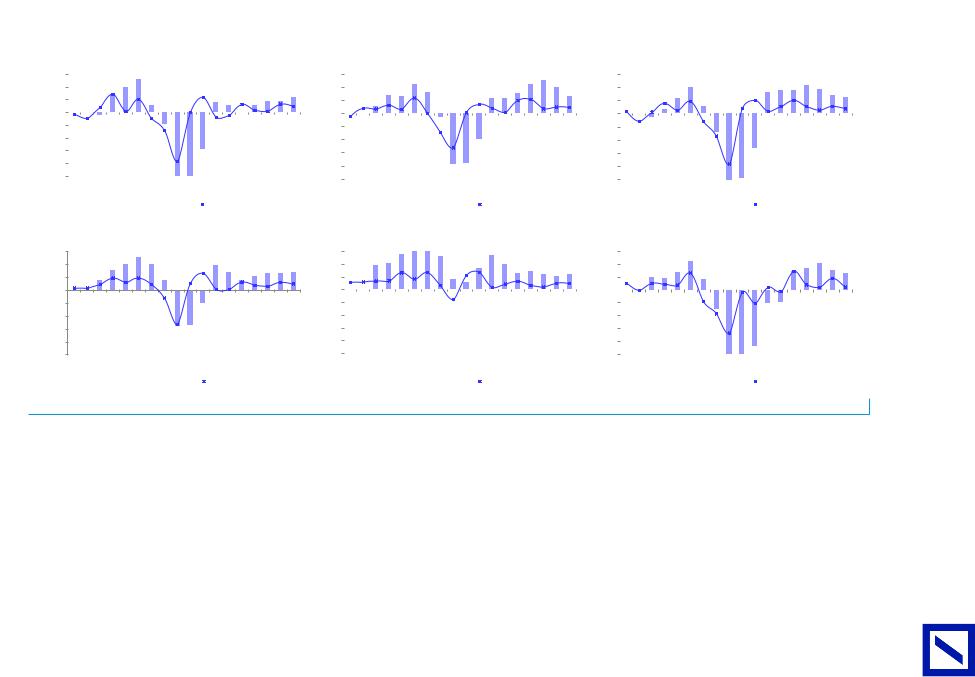
vk.com/id446425943
28Page |
LafargeHolcim EM exposure has historically smoothed cycle downturns |
|
|
|
|
|
|
|
|
|
|
|
|
|
|
|
|
|
|
|
|
|
|
|
|
|
|||||||||||||||||||||||||||||||||||||||||||||||||||||||
|
|
|
|
|
|
|
|
|
|
|
|
|
|
|
|
|
|
|
|
|
|
|
|
|
|
||||||||||||||||||||||||||||||||||||||||||||||||||||||||
|
|
|
|
|
|
|
|
|
|
|
|
|
|
|
|
|
|
|
|
|
|
|
|
|
|
|
|
|
|
|
|
|
|
|
|
|
|
|
|
|
|
|
|
|
|
|
|
|
|
|
|
|
|
|
|
||||||||||||||||||||||||||
|
Figure 67:Volumes growth evolution on companies' footprints over the cycle |
|
|
|
|
|
|
|
|
|
|
|
|
|
|
|
|
|
|
|
|
|
|
|
|
|
|
|
|
|
|
|
|
|
|
|
|
|
|
|
|||||||||||||||||||||||||||||||||||||||||
|
Buzzi |
|
|
|
|
|
|
|
|
|
|
|
|
|
|
|
|
|
|
|
|
|
|
|
|
|
Cemex |
|
|
|
|
|
|
|
|
|
|
|
|
|
|
|
|
|
|
|
|
|
|
|
|
|
CRH |
|
|
|
|
|
|
|
|
|
|
|
|
|
|
|
|
|
|
|
|
||||||||
|
15% |
|
|
|
|
|
|
|
|
|
|
|
|
|
|
|
|
|
|
|
|
|
|
|
|
|
|
15% |
|
|
|
|
|
|
|
|
|
|
|
|
|
|
|
|
|
|
|
|
|
|
|
|
|
|
|
15% |
|
|
|
|
|
|
|
|
|
|
|
|
|
|
|
|
|
|
|
|
|
|
|||
|
10% |
|
|
|
|
|
|
|
|
|
|
|
|
|
|
|
|
|
|
|
|
|
|
|
|
|
|
10% |
|
|
|
|
|
|
|
|
|
|
|
|
|
|
|
|
|
|
|
|
|
|
|
|
|
|
|
10% |
|
|
|
|
|
|
|
|
|
|
|
|
|
|
|
|
|
|
|
|
|
|
|||
|
5% |
|
|
|
|
|
|
|
|
|
|
|
|
|
|
|
|
|
|
|
|
|
|
|
|
|
|
5% |
|
|
|
|
|
|
|
|
|
|
|
|
|
|
|
|
|
|
|
|
|
|
|
|
|
|
|
5% |
|
|
|
|
|
|
|
|
|
|
|
|
|
|
|
|
|
|
|
|
|
|
|||
|
0% |
|
|
|
|
|
|
|
|
|
|
|
|
|
|
|
|
|
|
|
|
|
|
|
|
|
|
0% |
|
|
|
|
|
|
|
|
|
|
|
|
|
|
|
|
|
|
|
|
|
|
|
|
|
|
|
0% |
|
|
|
|
|
|
|
|
|
|
|
|
|
|
|
|
|
|
|
|
|
|
|||
|
-5% |
|
|
|
|
|
|
|
|
|
|
|
|
|
|
|
|
|
|
|
|
|
|
|
|
|
|
-5% |
|
|
|
|
|
|
|
|
|
|
|
|
|
|
|
|
|
|
|
|
|
|
|
|
|
|
|
-5% |
|
|
|
|
|
|
|
|
|
|
|
|
|
|
|
|
|
|
|
|
|
|
|||
|
-10% |
|
|
|
|
|
|
|
|
|
|
|
|
|
|
|
|
|
|
|
|
|
|
|
|
|
|
-10% |
|
|
|
|
|
|
|
|
|
|
|
|
|
|
|
|
|
|
|
|
|
|
|
|
|
|
|
-10% |
|
|
|
|
|
|
|
|
|
|
|
|
|
|
|
|
|
|
|
|
|
|
|||
|
-15% |
|
|
|
|
|
|
|
|
|
|
|
|
|
|
|
|
|
|
|
|
|
|
|
|
|
|
-15% |
|
|
|
|
|
|
|
|
|
|
|
|
|
|
|
|
|
|
|
|
|
|
|
|
|
|
|
-15% |
|
|
|
|
|
|
|
|
|
|
|
|
|
|
|
|
|
|
|
|
|
|
|||
|
|
|
|
|
|
|
|
|
|
|
|
|
|
|
|
|
|
|
|
|
|
|
|
|
|
|
|
|
|
|
|
|
|
|
|
|
|
|
|
|
|
|
|
|
|
|
|
|
|
|
|
|
|
|
|
|
|
|
|
|
|
|
|
|
|
|
|
|
|
|
|
|
|
|
|
|
|
||||
|
-20% |
|
|
|
|
|
|
|
|
|
|
|
|
|
|
|
|
|
|
|
|
|
|
|
|
|
|
-20% |
|
|
|
|
|
|
|
|
|
|
|
|
|
|
|
|
|
|
|
|
|
|
|
|
|
|
|
-20% |
|
|
|
|
|
|
|
|
|
|
|
|
|
|
|
|
|
|
|
|
|
|
|||
|
|
|
|
|
|
|
|
|
|
|
|
|
|
|
|
|
|
|
|
|
|
|
|
|
|
|
|
|
|
|
|
|
|
|
|
|
|
|
|
|
|
|
|
|
|
|
|
|
|
|
|
|
|
|
|
|
|
|
|
|
|
|
|
|
|
|
|
|
|
|
|
|
|
|
|
|
|
||||
|
-25% |
|
|
|
|
|
|
|
|
|
|
|
|
|
|
|
|
|
|
|
|
|
|
|
|
|
|
-25% |
|
|
|
|
|
|
|
|
|
|
|
|
|
|
|
|
|
|
|
|
|
|
|
|
|
|
|
-25% |
|
|
|
|
|
|
|
|
|
|
|
|
|
|
|
|
|
|
|
|
|
|
|||
|
2001 |
2002 |
2003 |
2004 |
2005 |
2006 |
2007 |
2008 |
2009 |
2010 |
2011 |
2012 |
2013 |
2014 |
2015 |
2016 |
2017 |
2018 |
2001 |
2002 |
2003 |
2004 |
2005 |
2006 |
2007 |
2008 |
2009 |
2010 |
2011 |
2012 |
2013 |
2014 |
2015 |
2016 |
2017 |
2018 |
2001 |
2002 |
2003 |
2004 |
2005 |
2006 |
2007 |
2008 |
2009 |
2010 |
2011 |
2012 |
2013 |
2014 |
2015 |
2016 |
2017 |
2018 |
|
||||||||||||||||||||||||||
|
|
|
3y cumulative cement demand growth |
|
|
|
|
|
|
YoY cement demand growth |
|
|
|
3y cumulative cement demand growth |
|
|
|
|
|
|
YoY cement demand growth |
|
|
|
3y cumulative cement demand growth |
|
|
|
|
YoY cement demand growth |
|||||||||||||||||||||||||||||||||||||||||||||||||||
|
|
|
|
|
|
|
|
|
|
|
|
|
|
|
|
|
|
|
|
|
|
|
|||||||||||||||||||||||||||||||||||||||||||||||||||||||||||
HeidelbergCement
15%
10%
5%
0%
-5%
-10%
-15%
-20%
-25%
2001 |
2002 |
2003 |
2004 |
2005 |
2006 |
2007 |
2008 |
2009 |
2010 |
2011 |
2012 |
2013 |
2014 |
2015 |
2016 |
2017 |
2018 |
|||
|
3y cumulative cement demand growth |
|
|
|
|
YoY cement demand growth |
||||||||||||||
|
|
|
|
|
||||||||||||||||
LafargeHolcim |
|
|
|
|
|
|
|
|
|
|
|
|
|
|
|
|
|
Titan |
|
|
|
|
|
|
|
|
|
|
|
|
|
|
|
|
|
|
|
|
|
||||||||
15% |
|
|
|
|
|
|
|
|
|
|
|
|
|
|
|
|
|
|
|
|
15% |
|
|
|
|
|
|
|
|
|
|
|
|
|
|
|
|
|
|
|
|
|
|
|
|
||
10% |
|
|
|
|
|
|
|
|
|
|
|
|
|
|
|
|
|
|
|
|
10% |
|
|
|
|
|
|
|
|
|
|
|
|
|
|
|
|
|
|
|
|
|
|
|
|
||
5% |
|
|
|
|
|
|
|
|
|
|
|
|
|
|
|
|
|
|
|
|
5% |
|
|
|
|
|
|
|
|
|
|
|
|
|
|
|
|
|
|
|
|
|
|
|
|
||
0% |
|
|
|
|
|
|
|
|
|
|
|
|
|
|
|
|
|
|
|
|
0% |
|
|
|
|
|
|
|
|
|
|
|
|
|
|
|
|
|
|
|
|
|
|
|
|
||
-5% |
|
|
|
|
|
|
|
|
|
|
|
|
|
|
|
|
|
|
|
|
-5% |
|
|
|
|
|
|
|
|
|
|
|
|
|
|
|
|
|
|
|
|
|
|
|
|
||
-10% |
|
|
|
|
|
|
|
|
|
|
|
|
|
|
|
|
|
|
|
|
-10% |
|
|
|
|
|
|
|
|
|
|
|
|
|
|
|
|
|
|
|
|
|
|
|
|
||
-15% |
|
|
|
|
|
|
|
|
|
|
|
|
|
|
|
|
|
|
|
|
-15% |
|
|
|
|
|
|
|
|
|
|
|
|
|
|
|
|
|
|
|
|
|
|
|
|
||
-20% |
|
|
|
|
|
|
|
|
|
|
|
|
|
|
|
|
|
|
|
|
-20% |
|
|
|
|
|
|
|
|
|
|
|
|
|
|
|
|
|
|
|
|
|
|
|
|
||
-25% |
|
|
|
|
|
|
|
|
|
|
|
|
|
|
|
|
|
|
|
|
-25% |
|
|
|
|
|
|
|
|
|
|
|
|
|
|
|
|
|
|
|
|
|
|
|
|
||
|
|
|
|
|
|
|
|
|
|
|
|
|
|
|
|
|
|
|
|
|
|
|
|
|
|
|
|
|
|
|
|
|
|
|
|
|
|
|
|
|
|
|
|||||
2001 |
2002 |
2003 |
2004 |
2005 |
2006 |
2007 |
2008 |
2009 |
2010 |
2011 |
2012 |
2013 |
2014 |
2015 |
2016 |
2017 |
2018 |
2001 |
2002 |
2003 |
2004 |
2005 |
2006 |
2007 |
2008 |
2009 |
2010 |
2011 |
2012 |
2013 |
2014 |
2015 |
2016 |
2017 |
2018 |
||||||||||||
|
|
3y cumulative cement demand growth |
|
|
|
|
YoY cement demand growth |
|
|
|
|
3y cumulative cement demand growth |
|
|
|
|
YoY cement demand growth |
||||||||||||||||||||||||||||||
|
|
|
|
|
|
|
|
|
|
|
|
|
|||||||||||||||||||||||||||||||||||
Source:Deutsche Bank estimates, Company data, Analysis based on markets historical volume growth on current companies' footprints
AG/London Bank Deutsche
Building European |
2018 December 3 Materials Building |
Construction & |
|

vk.com/id446425943
Deutsche |
Price vs. costs to remain an issue in H1 19 |
||
|
|
||
Bank |
■ |
While oil prices have recently decreased, we believe it is too early to call for cost inflation moderation and price vs. cost improvement as soon as |
|
|
|||
AG/London |
|
in H1 19. |
|
■ |
Oil is indeed a very limited portion of the costs structure for stocks in our sector as lightside products key raw materials include rather oil derivatives |
||
|
|||
|
|
which follow oil price evolution with at least a 4 to 6 months lag impact. We are also cautious that the exceptionally low level of the Rhine River could |
|
|
|
cause supply disruption and more expensive sourcing in Europe in H1 19. |
|
|
■ |
For heavyside stocks, we see energy cost inflation to remain high for most of H1 19 (c10%, in line with H2 18) as coal prices remain at an elevated |
|
|
|
level across the globe (in Europe, Asia and the US) and electricity prices in Europe have significantly picked-up in Q3 18. |
|
|
■ |
With the timing of price increase usually in April in DM and the full impact only to be seen in Q3, we remain cautious that price vs. cost should remain |
|
|
|
an issue in H1 19 before a significant improvement in H2 19. |
|
|
■ |
This drives our preference for LafargeHolcim (SG&A savings more than compensating potential margin squeeze) but also Sika (strong operational |
|
|
|
leverage and more flexibility for price increase implementation) as well as Saint Gobain (strong pricing momentum as seen in Q3 18). |
|
Figure 68: DB YoY margin improvement by company (bps)
|
Key margin metric |
Delta 2019 vs. 2018 (bps) |
Delta 2019 vs. 2018 (bps) incl. |
Comments |
|
|
underlying |
costs savings & one-offs |
|||
|
|
|
|||
|
|
|
|
|
|
Sika |
EBIT |
91 |
143 |
Gross margin improvement (+40bps) and op. leverage (+50bps). Saint Gobain one-off (-30bp) + |
|
dilutive impact of acquisition in 2018 (-20bps). |
|||||
|
|
|
|
||
LafargeHolcim |
Recurring EBITDA |
-21 |
70 |
Conservatively assumes negative underlying margin evolution in spite of improved capacity |
|
utilization in EM - +90bps expected from SG&A savings |
|||||
|
|
|
|
||
Cemex |
EBITDA |
-16 |
73 |
Assuming $130m of savings in 2019E |
|
Buzzi |
Recurring EBITDA |
17 |
62 |
2018 negatively impacted by one-offs in Italy and Germany (30bps) + synergies in Germany (+20bps) |
|
CRH |
EBITDA |
11 |
26 |
Synergies bring +15bps on margin |
|
Kingspan |
EBITA |
52 |
52 |
MDI price decrease should have positive impact on PIR cost inflation partly compensated by |
|
Kooltherm penetration rate slow-down |
|||||
|
|
|
|
||
Tarkett |
EBITDA |
21 |
43 |
Improved price vs. cost on lower oil-related costs + accretive impact of North America acquisition |
|
Saint Gobain |
EBIT |
21 |
33 |
Assuming E50m of savings in 2019E |
|
Geberit |
EBITDA |
22 |
22 |
Cost inflation to abate only in H2 19 |
|
Titan Cement |
EBITDA |
18 |
18 |
EBITDA margin improvement in the US but risks in Egypt |
|
Heidelberg |
EBITDA |
-16 |
1 |
Margin squeeze to continue in H1 - improvement only from Q3 |
Source: Deutsche Bank estimates, Company data
29 Page
Building European |
2018 December 3 Materials Building |
Construction & |
|

vk.com/id446425943
30 Page |
Reinflation of energy had an impact on operational leverage, esp. on the cyclical stocks |
|
|
|
|
|
|
|
|
|
|
|
|
|
|||||||||||||||||||||||||||||||||||||||||||
|
■ |
After 3 years of cost deflation in 2014-16, the reinflation of energy and raw materials end of 2016 had a clearly visible negative impact on the sector's |
|||||||||||||||||||||||||||||||||||||||||||||||||||||||
|
|
|
operational leverage. |
|
|
|
|
|
|
|
|
|
|
|
|
|
|
|
|
|
|
|
|
|
|
|
|
|
|
|
|
|
|
|
|
|
|
|
|
|
|
|
|
|
|
|
|
|
|
|
|
||||||
|
|
■ |
When we exclude the synergies / costs savings impact, we believe that cement stocks lfl EBITDA have been down in 2017-18 reflecting a negative |
||||||||||||||||||||||||||||||||||||||||||||||||||||||
|
|
|
price vs. cost environment |
|
|
|
|
|
|
|
|
|
|
|
|
|
|
|
|
|
|
|
|
|
|
|
|
|
|
|
|
|
|
|
|
|
|
|
|
|
|
|
|
|
|
|
|||||||||||
|
|
■ |
Conversely, reflecting a better pricing power, structural growth stocks continued to grow in EBITDA in 2017-18 at however a slower pace vs. previous |
||||||||||||||||||||||||||||||||||||||||||||||||||||||
|
|
|
years |
|
|
|
|
|
|
|
|
|
|
|
|
|
|
|
|
|
|
|
|
|
|
|
|
|
|
|
|
|
|
|
|
|
|
|
|
|
|
|
|
|
|
|
|
|
|
|
|
|
|
|
|
||
|
|
|
|
|
|
|
|
|
|
|
|
|
|
|
|
|
|
|
|
|
|
|
|
|
|
|
|
|
|
|
|
|
|
|
|
|
|
|
|
||||||||||||||||||
|
Figure 69: Sales, EBITDA and margin evolution - Cement & Structural stocks |
|
|
|
|
|
|
|
|
|
|
|
|
|
|
|
|
|
|
|
|
|
|
|
|
|
|
|
|
|
|
|
|||||||||||||||||||||||||
|
Lfl EBITDA growth vs. lfl Sales growth on cement stocks |
|
|
|
YoY EBITDA margin evolution vs. coal price |
|
|
|
|
|
|
|
|
|
|
|
|
|
Lfl EBITDA growth vs. lfl Sales growth - structural growth stocks |
|
|
|
|||||||||||||||||||||||||||||||||||
|
20% |
|
|
|
|
|
|
|
|
|
|
|
|
|
|
|
|
2.0% |
|
|
|
|
|
|
|
|
|
|
|
|
|
|
|
|
|
|
|
140 |
20% |
|
|
|
|
|
|
|
|
|
|
|
|
|
|
|
|
|
|
|
15% |
|
|
|
|
|
|
|
|
|
|
|
|
|
|
|
|
1.5% |
|
|
|
|
|
|
|
|
|
|
|
|
|
|
|
|
|
|
|
120 |
15% |
|
|
|
|
|
|
|
|
|
|
|
|
|
|
|
|
|
|
|
|
|
|
|
|
|
|
|
|
|
|
|
|
|
|
|
|
|
|
|
|
|
|
|
|
|
|
|
|
|
|
|
|
|
|
|
|
|
|
|
|
|
|
|
|
|
|
|
|
|
|
|
|
||||
|
10% |
|
|
|
|
|
|
|
|
|
|
|
|
|
|
|
|
1.0% |
|
|
|
|
|
|
|
|
|
|
|
|
|
|
|
|
|
|
|
|
|
10% |
|
|
|
|
|
|
|
|
|
|
|
|
|
|
|
|
|
|
|
|
|
|
|
|
|
|
|
|
|
|
|
|
|
|
|
|
|
|
|
|
|
|
|
|
|
|
|
|
|
|
|
|
|
|
100 |
|
|
|
|
|
|
|
|
|
|
|
|
|
|
|
|
|
|||
|
|
|
|
|
|
|
|
|
|
|
|
|
|
|
|
|
|
|
|
|
|
|
|
|
|
|
|
|
|
|
|
|
|
|
|
|
|
|
|
|
|
|
|
|
|
|
|
|
|
|
|
|
|
|
|
||
|
5% |
|
|
|
|
|
|
|
|
|
|
|
|
|
|
|
|
0.5% |
|
|
|
|
|
|
|
|
|
|
|
|
|
|
|
|
|
|
|
|
|
5% |
|
|
|
|
|
|
|
|
|
|
|
|
|
|
|
|
|
|
|
|
|
|
|
|
|
|
|
|
|
|
|
|
|
|
|
|
|
|
|
|
|
|
|
|
|
|
|
|
|
|
|
|
|
|
80 |
|
|
|
|
|
|
|
|
|
|
|
|
|
|
|
|
|
|||
|
0% |
|
|
|
|
|
|
|
|
|
|
|
|
|
|
|
|
0.0% |
|
|
|
|
|
|
|
|
|
|
|
|
|
|
|
|
|
|
|
0% |
|
|
|
|
|
|
|
|
|
|
|
|
|
|
|
|
|
||
|
|
|
|
|
|
|
|
|
|
|
|
|
|
|
|
|
|
|
|
|
|
|
|
|
|
|
|
|
|
|
|
|
|
|
|
|
|
|
|
|
|
|
|
|
|
|
|
|
|
|
|
|
|
|
|||
|
-5% |
|
|
|
|
|
|
|
|
|
|
|
|
|
|
|
|
|
|
|
|
|
|
|
|
|
|
|
|
|
|
|
|
|
|
|
|
|
|
|
|
|
|
|
|
|
|
|
|
|
|
|
|
|
|
||
|
|
|
|
|
|
|
|
|
|
|
|
|
|
|
|
|
|
|
|
|
|
|
|
|
|
|
|
|
|
|
|
|
|
|
|
60 |
|
|
|
|
|
|
|
|
|
|
|
|
|
|
|
||||||
|
|
|
|
|
|
|
|
|
|
|
|
|
|
|
|
|
|
|
|
|
|
|
|
|
|
|
|
|
|
|
|
|
|
|
|
|
|
|
|
|
|
|
|
|
|
|
|
|
|
|
|
|
|
|
|||
|
-10% |
|
|
|
|
|
|
|
|
|
|
|
|
|
|
|
|
-0.5% |
|
|
|
|
|
|
|
|
|
|
|
|
|
|
|
|
|
|
|
|
|
-5% |
|
|
|
|
|
|
|
|
|
|
|
|
|
|
|
|
|
|
|
|
|
|
|
|
|
|
|
|
|
|
|
|
|
|
|
|
|
|
|
|
|
|
|
|
|
|
|
|
|
|
|
|
|
|
40 |
|
|
|
|
|
|
|
|
|
|
|
|
|
|
|
|
|
|
||
|
|
|
|
|
|
|
|
|
|
|
|
|
|
|
|
|
|
-1.0% |
|
|
|
|
|
|
|
|
|
|
|
|
|
|
|
|
|
|
|
-10% |
|
|
|
|
|
|
|
|
|
|
|
|
|
|
|
|
|
||
|
-15% |
|
|
|
|
|
|
|
|
|
|
|
|
|
|
|
|
|
|
|
|
|
|
|
|
|
|
|
|
|
|
|
|
|
|
|
|
|
|
|
|
|
|
|
|
|
|
|
|
|
|
|
|
|
|
||
|
|
|
|
|
|
|
|
|
|
|
|
|
|
|
|
|
|
|
|
|
|
|
|
|
|
|
|
|
|
|
|
|
|
|
|
|
|
|
|
|
|
|
|
|
|
|
|
|
|
|
|
|
|
|
|
|
|
|
-20% |
|
|
|
|
|
|
|
|
|
|
|
|
|
|
|
|
-1.5% |
|
|
|
|
|
|
|
|
|
|
|
|
|
|
|
|
|
|
|
20 |
-15% |
|
|
|
|
|
|
|
|
|
|
|
|
|
|
|
|
|
|
|
|
|
|
|
|
|
|
|
|
|
|
|
|
|
|
|
|
|
|
|
|
|
|
|
|
|
|
|
|
|
|
|
|
|
|
|
|
|
|
|
|
|
|
|
|
|
|
|
|
|
|
|
|
|
|||
|
|
|
|
|
|
|
|
|
|
|
|
|
|
|
|
|
|
|
|
|
|
|
|
|
|
|
|
|
|
|
|
|
|
|
|
|
|
|
|
|
|
|
|
|
|
|
|
|
|
|
|
|
|
|
|
||
|
-25% |
|
|
|
|
|
|
|
|
|
|
|
|
|
|
|
|
-2.0% |
|
|
|
|
|
|
|
|
|
|
|
|
|
|
|
|
|
|
|
0 |
-20% |
|
|
|
|
|
|
|
|
|
|
|
|
|
|
|
|
|
|
|
2007 |
2008 |
2009 |
2010 |
2011 |
2012 |
2013 |
2014 |
2015 |
2016 |
2017 |
2018E |
2007 |
2008 |
2009 |
2010 |
2011 |
2012 |
2013 |
2014 |
2015 |
2016 |
2017 |
2018E |
|
|
2007 |
2008 |
2009 |
2010 |
2011 |
2012 |
2013 |
2014 |
2015 |
2016 |
2017 |
2018E |
|||||||||||||||||||
|
|
|
|
|
Cement lfl EBITDA growth |
|
|
|
|
|
|
Cement lfl Sales growth |
|
|
|
|
Cement EBITDA Margin evolution (lhs) |
|
|
|
|
|
|
Newcastle Coal price (rhs) |
|
|
|
|
|
|
lfl EBITDA growth (%) |
|
|
|
|
|
lfl Sales growth (%) |
|
|
|
|
||||||||||||||||
|
Source:Deutsche Bank estimates, Factset, Company data |
|
|
|
|
|
|
|
|
|
|
|
|
|
|
|
|
|
|
|
|
|
|
|
|
|
|
|
|
|
|
|
|
|
|
|
|
|
|
|
|
|
|
|
|
||||||||||||
|
|
|
|
|
|
|
|
|
|
|
|
|
|
|
|
|
|
|
|
|
|
|
|
|
|
|
|
|
|
|
|
|
|
|
|
|
|
|
|
|
|
|
|
|
|||||||||||||
|
|
|
|
|
|
|
|
|
|
|
|
|
|
|
|
|
|
|
|
|
|
|
|
|
|
|
|
|
|
|
|
|
|
|
|
|
|
|
|
|
|
|
|
|
|
|
|
|
|
|
|
|
|
|
|
|
|
AG/London Bank Deutsche
Building European |
2018 December 3 Materials Building |
Construction & |
|