


vk.com/id446425943 |
|
|
|
|
|
|
|
|
|
|
|
|
|
||
|
Primary energy |
|
|
|
|
|
|
|
|
|
|
|
|
|
|
|
Consumption* |
|
|
|
|
|
|
|
|
|
|
|
|
|
|
|
|
|
|
|
|
|
|
|
|
|
|
|
|
|
|
|
|
|
|
|
|
|
|
|
|
|
|
|
Growth rate per annum |
|
|
|
|
|
|
|
|
|
|
|
|
|
|
|
|
|
Share |
|
Million tonnes oil equivalent |
2008 |
2009 |
2010 |
2011 |
2012 |
2013 |
2014 |
2015 |
2016 |
2017 |
2018 |
2018 |
2007-17 |
2018 |
|
Canada |
321.5 |
304.9 |
312.0 |
327.2 |
324.7 |
337.0 |
341.8 |
339.0 |
338.2 |
343.7 |
344.4 |
0.2% |
0.7% |
2.5% |
|
Mexico |
170.8 |
169.5 |
174.6 |
183.1 |
184.2 |
185.0 |
184.1 |
184.0 |
186.4 |
189.3 |
186.9 |
-1.3% |
1.2% |
1.3% |
|
US |
2258.6 |
2148.7 |
2223.3 |
2204.1 |
2148.5 |
2208.0 |
2232.9 |
2213.2 |
2212.7 |
2222.5 |
2300.6 |
3.5% |
-0.4% |
16.6% |
|
Total North America |
2751.0 |
2623.1 |
2709.8 |
2714.4 |
2657.4 |
2730.1 |
2758.9 |
2736.2 |
2737.2 |
2755.5 |
2832.0 |
2.8% |
-0.2% |
20.4% |
|
Argentina |
74.7 |
73.3 |
77.2 |
78.7 |
81.0 |
84.5 |
84.1 |
86.1 |
85.9 |
86.1 |
85.1 |
-1.2% |
1.6% |
0.6% |
|
Brazil |
239.9 |
238.6 |
263.1 |
275.8 |
281.3 |
292.4 |
299.4 |
295.9 |
289.4 |
293.9 |
297.6 |
1.3% |
2.5% |
2.1% |
|
Chile |
32.2 |
31.5 |
31.7 |
34.5 |
35.3 |
35.7 |
35.1 |
35.9 |
37.7 |
38.3 |
40.1 |
4.7% |
1.7% |
0.3% |
|
Colombia |
33.3 |
31.8 |
34.1 |
35.7 |
38.3 |
38.9 |
41.0 |
41.3 |
44.2 |
45.5 |
46.9 |
3.2% |
4.0% |
0.3% |
|
Ecuador |
12.1 |
11.9 |
13.2 |
14.0 |
14.8 |
15.3 |
16.1 |
16.1 |
16.0 |
16.7 |
17.6 |
5.8% |
3.9% |
0.1% |
|
Peru |
16.6 |
17.0 |
18.8 |
20.9 |
21.3 |
21.9 |
22.6 |
24.2 |
25.5 |
25.4 |
27.0 |
6.3% |
5.2% |
0.2% |
|
Trinidad & Tobago |
15.9 |
16.0 |
17.5 |
17.6 |
16.7 |
17.2 |
16.8 |
16.9 |
15.4 |
15.2 |
15.3 |
0.1% |
-0.7% |
0.1% |
|
Venezuela |
84.6 |
84.4 |
79.7 |
83.4 |
86.9 |
84.9 |
82.1 |
79.3 |
72.3 |
73.6 |
64.6 |
-12.2% |
-1.0% |
0.5% |
|
Other S. & Cent. America |
91.6 |
89.6 |
91.8 |
94.6 |
95.1 |
95.1 |
95.7 |
99.5 |
104.6 |
105.1 |
107.8 |
2.6% |
1.3% |
0.8% |
|
Total S. & Cent. America |
600.8 |
594.2 |
627.1 |
655.3 |
670.9 |
685.9 |
692.9 |
695.3 |
691.1 |
699.8 |
702.0 |
0.3% |
1.8% |
5.1% |
|
Austria |
35.4 |
34.3 |
35.6 |
33.3 |
35.0 |
34.7 |
33.3 |
33.4 |
34.6 |
35.5 |
35.0 |
-1.5% |
0.2% |
0.3% |
|
Belgium |
67.7 |
63.4 |
67.5 |
63.0 |
60.7 |
62.2 |
58.2 |
59.1 |
63.9 |
64.1 |
62.2 |
-3.0% |
-0.4% |
0.4% |
|
Czech Republic |
43.9 |
42.2 |
44.0 |
43.0 |
42.8 |
42.1 |
41.2 |
40.5 |
39.9 |
41.8 |
42.1 |
0.9% |
-0.7% |
0.3% |
|
Finland |
31.4 |
29.3 |
31.9 |
29.7 |
28.8 |
29.1 |
28.1 |
28.0 |
28.8 |
28.1 |
29.3 |
4.2% |
-1.5% |
0.2% |
|
France |
261.9 |
248.0 |
256.0 |
246.9 |
247.3 |
250.1 |
240.4 |
241.9 |
238.4 |
237.5 |
242.6 |
2.2% |
-0.9% |
1.7% |
|
Germany |
335.5 |
315.1 |
327.9 |
316.1 |
320.5 |
329.8 |
316.4 |
322.5 |
328.1 |
333.9 |
323.9 |
-3.0% |
0.1% |
2.3% |
|
Greece |
35.3 |
34.2 |
32.5 |
31.7 |
30.0 |
28.5 |
26.8 |
27.0 |
26.6 |
28.0 |
28.3 |
1.0% |
-2.6% |
0.2% |
|
Hungary |
25.3 |
23.2 |
23.8 |
23.6 |
21.9 |
20.9 |
21.0 |
22.0 |
22.4 |
23.5 |
23.7 |
0.8% |
-0.9% |
0.2% |
|
Italy |
181.0 |
169.2 |
174.4 |
170.5 |
165.8 |
158.2 |
149.7 |
153.1 |
154.7 |
156.3 |
154.5 |
-1.1% |
-1.6% |
1.1% |
|
Netherlands |
93.8 |
92.4 |
97.8 |
93.7 |
90.6 |
87.9 |
83.1 |
84.1 |
85.7 |
84.5 |
84.8 |
0.3% |
-1.2% |
0.6% |
|
Norway |
46.4 |
43.1 |
41.6 |
42.4 |
47.3 |
44.3 |
45.7 |
46.5 |
47.2 |
47.6 |
47.4 |
-0.5% |
0.5% |
0.3% |
|
Poland |
97.4 |
93.9 |
100.0 |
100.5 |
97.5 |
97.8 |
94.2 |
95.2 |
99.4 |
103.4 |
105.2 |
1.7% |
0.8% |
0.8% |
|
Portugal |
24.4 |
24.5 |
25.8 |
24.7 |
22.6 |
24.7 |
24.9 |
24.8 |
26.2 |
25.8 |
26.0 |
0.8% |
0.2% |
0.2% |
|
Romania |
38.6 |
33.8 |
34.0 |
34.9 |
33.6 |
31.4 |
32.7 |
32.8 |
32.8 |
33.4 |
33.4 |
0.1% |
-1.4% |
0.2% |
|
Spain |
154.5 |
143.4 |
146.5 |
143.9 |
143.2 |
135.9 |
133.5 |
135.4 |
136.9 |
138.8 |
141.4 |
1.8% |
-1.3% |
1.0% |
|
Sweden |
53.0 |
48.7 |
51.8 |
51.4 |
54.7 |
51.5 |
51.5 |
53.3 |
52.6 |
54.4 |
53.6 |
-1.4% |
0.1% |
0.4% |
|
Switzerland |
29.9 |
29.9 |
29.2 |
27.8 |
29.4 |
30.3 |
29.0 |
28.4 |
26.8 |
26.9 |
27.8 |
3.5% |
-0.7% |
0.2% |
|
Turkey |
100.8 |
102.2 |
107.6 |
115.1 |
122.3 |
121.5 |
125.4 |
137.2 |
144.6 |
152.7 |
153.5 |
0.5% |
4.3% |
1.1% |
|
Ukraine |
133.5 |
113.4 |
121.5 |
126.3 |
123.1 |
117.3 |
103.2 |
85.7 |
89.8 |
83.4 |
84.0 |
0.8% |
-4.7% |
0.6% |
|
United Kingdom |
220.0 |
209.4 |
214.6 |
202.2 |
204.8 |
204.1 |
192.5 |
195.1 |
193.5 |
193.2 |
192.3 |
-0.5% |
-1.4% |
1.4% |
|
Other Europe |
163.5 |
154.9 |
160.6 |
156.9 |
150.3 |
152.3 |
147.4 |
150.8 |
154.7 |
157.3 |
159.8 |
1.6% |
-0.3% |
1.2% |
|
Total Europe |
2173.3 |
2048.4 |
2124.6 |
2077.7 |
2072.3 |
2054.7 |
1978.3 |
1996.8 |
2027.5 |
2050.0 |
2050.7 |
|
-0.6% |
14.8% |
|
|
|
|
|
|
|
|
|
|
|
|
|
|
|
|
|
Azerbaijan |
12.8 |
11.3 |
11.2 |
12.5 |
12.8 |
13.2 |
13.5 |
14.7 |
14.6 |
14.3 |
14.4 |
0.6% |
1.2% |
0.1% |
|
Belarus |
25.9 |
24.5 |
26.0 |
25.9 |
28.0 |
24.7 |
25.5 |
23.2 |
23.0 |
23.4 |
24.6 |
5.0% |
-0.9% |
0.2% |
|
Kazakhstan |
56.4 |
50.8 |
54.9 |
60.5 |
62.7 |
63.5 |
64.4 |
63.7 |
64.7 |
67.6 |
76.4 |
13.0% |
2.3% |
0.6% |
|
Russian Federation |
676.6 |
643.2 |
669.3 |
691.8 |
693.8 |
685.5 |
688.3 |
675.4 |
690.5 |
694.3 |
720.7 |
3.8% |
0.3% |
5.2% |
|
Turkmenistan |
12.2 |
19.9 |
21.5 |
23.8 |
26.0 |
23.1 |
23.9 |
28.6 |
27.5 |
28.7 |
31.5 |
9.8% |
6.8% |
0.2% |
|
Uzbekistan |
44.6 |
44.8 |
44.4 |
46.6 |
45.5 |
45.2 |
47.1 |
44.9 |
43.6 |
45.0 |
43.9 |
-2.4% |
-0.5% |
0.3% |
|
Other CIS |
16.2 |
15.6 |
15.9 |
17.0 |
18.0 |
17.1 |
17.5 |
17.4 |
17.5 |
18.0 |
19.0 |
5.9% |
0.7% |
0.1% |
|
Total CIS |
844.7 |
810.2 |
843.2 |
878.0 |
886.7 |
872.1 |
880.3 |
867.9 |
881.5 |
891.2 |
930.5 |
4.4% |
0.5% |
6.7% |
|
Iran |
205.8 |
212.7 |
213.4 |
224.9 |
226.2 |
237.9 |
249.0 |
249.2 |
257.2 |
272.0 |
285.7 |
5.0% |
3.2% |
2.1% |
|
Iraq |
29.2 |
32.6 |
34.7 |
36.7 |
39.0 |
42.0 |
40.2 |
40.1 |
46.2 |
47.1 |
53.7 |
14.1% |
5.3% |
0.4% |
|
Israel |
23.3 |
22.3 |
23.7 |
24.2 |
25.3 |
23.5 |
23.1 |
24.4 |
24.8 |
25.6 |
25.6 |
0.2% |
1.1% |
0.2% |
|
Kuwait |
29.7 |
31.1 |
33.5 |
33.6 |
37.3 |
38.7 |
35.4 |
38.5 |
38.9 |
38.7 |
39.0 |
0.7% |
3.5% |
0.3% |
|
Oman |
17.5 |
17.6 |
20.6 |
22.5 |
24.5 |
27.4 |
27.3 |
28.8 |
29.0 |
29.3 |
30.7 |
4.6% |
7.0% |
0.2% |
|
Qatar |
24.6 |
24.8 |
28.9 |
33.4 |
37.9 |
40.8 |
43.9 |
48.2 |
47.6 |
48.9 |
48.3 |
-1.2% |
8.2% |
0.3% |
|
Saudi Arabia |
184.3 |
194.3 |
213.0 |
219.8 |
233.1 |
234.0 |
250.8 |
259.0 |
262.2 |
262.8 |
259.2 |
-1.4% |
4.5% |
1.9% |
|
United Arab Emirates |
81.0 |
80.0 |
83.8 |
88.4 |
92.8 |
97.8 |
97.4 |
107.1 |
111.1 |
109.0 |
112.2 |
3.0% |
4.4% |
0.8% |
|
Other Middle East |
58.3 |
58.5 |
58.2 |
54.7 |
51.1 |
50.3 |
50.1 |
48.4 |
48.0 |
48.0 |
47.9 |
-0.2% |
-1.6% |
0.3% |
|
Total Middle East |
653.7 |
673.8 |
709.8 |
738.4 |
767.3 |
792.5 |
817.2 |
843.7 |
864.9 |
881.4 |
902.3 |
2.4% |
3.8% |
6.5% |
|
Algeria |
36.4 |
38.6 |
37.6 |
39.9 |
43.6 |
46.2 |
50.4 |
53.1 |
53.0 |
53.1 |
56.7 |
6.7% |
4.5% |
0.4% |
|
Egypt |
71.7 |
74.6 |
78.4 |
79.7 |
83.8 |
83.2 |
83.0 |
85.3 |
89.9 |
92.6 |
94.5 |
2.1% |
3.2% |
0.7% |
|
Morocco |
15.4 |
15.0 |
16.7 |
17.5 |
17.8 |
18.3 |
18.6 |
18.9 |
19.1 |
20.0 |
21.0 |
4.9% |
3.7% |
0.2% |
|
South Africa |
125.4 |
125.1 |
126.3 |
124.6 |
122.7 |
123.2 |
124.8 |
121.9 |
123.9 |
121.8 |
121.5 |
-0.2% |
0.4% |
0.9% |
|
Other Africa |
116.5 |
118.7 |
124.8 |
123.6 |
131.3 |
138.9 |
145.9 |
150.9 |
153.5 |
161.0 |
167.8 |
4.2% |
3.8% |
1.2% |
|
Total Africa |
365.4 |
372.0 |
383.8 |
385.3 |
399.2 |
409.7 |
422.6 |
430.1 |
439.4 |
448.6 |
461.5 |
2.9% |
2.7% |
3.3% |
|
Australia |
132.3 |
131.4 |
131.9 |
136.4 |
134.6 |
135.3 |
137.5 |
139.2 |
142.1 |
140.5 |
144.3 |
2.7% |
0.8% |
1.0% |
|
Bangladesh |
18.8 |
20.6 |
21.6 |
23.0 |
25.0 |
25.5 |
27.0 |
31.3 |
31.8 |
33.0 |
35.8 |
8.6% |
6.4% |
0.3% |
|
China |
2230.4 |
2330.1 |
2491.6 |
2690.5 |
2799.5 |
2907.5 |
2974.7 |
3009.6 |
3047.1 |
3139.0 |
3273.5 |
4.3% |
3.9% |
23.6% |
|
China Hong Kong SAR |
24.3 |
26.6 |
27.6 |
28.3 |
27.2 |
28.0 |
27.3 |
28.1 |
28.8 |
30.9 |
31.1 |
0.6% |
1.7% |
0.2% |
|
India |
477.9 |
514.3 |
539.2 |
571.4 |
601.0 |
624.5 |
667.5 |
689.8 |
719.3 |
750.1 |
809.2 |
7.9% |
5.2% |
5.8% |
|
Indonesia |
132.7 |
137.6 |
151.1 |
164.6 |
173.4 |
178.2 |
167.2 |
165.7 |
170.2 |
176.9 |
185.5 |
4.9% |
2.8% |
1.3% |
|
Japan |
517.8 |
473.1 |
504.7 |
479.1 |
475.7 |
472.3 |
460.3 |
453.3 |
450.8 |
455.2 |
454.1 |
-0.2% |
-1.4% |
3.3% |
|
Malaysia |
80.0 |
77.7 |
80.1 |
82.9 |
89.0 |
93.1 |
93.6 |
95.1 |
96.6 |
96.7 |
99.3 |
2.7% |
2.3% |
0.7% |
|
New Zealand |
19.3 |
19.2 |
19.9 |
19.7 |
20.0 |
20.2 |
21.2 |
21.4 |
21.6 |
22.2 |
21.7 |
-1.9% |
1.4% |
0.2% |
|
Pakistan |
62.4 |
63.2 |
63.4 |
63.5 |
64.1 |
64.9 |
66.9 |
70.4 |
76.6 |
81.0 |
85.0 |
5.0% |
2.7% |
0.6% |
|
Philippines |
28.0 |
28.3 |
29.3 |
29.9 |
30.9 |
33.1 |
34.9 |
38.3 |
41.8 |
45.7 |
47.0 |
2.9% |
5.4% |
0.3% |
|
Singapore |
59.3 |
63.8 |
68.6 |
71.3 |
71.6 |
73.6 |
75.8 |
80.6 |
83.8 |
86.5 |
87.6 |
1.2% |
4.5% |
0.6% |
|
South Korea |
241.4 |
242.6 |
261.3 |
273.4 |
276.3 |
276.7 |
279.5 |
285.3 |
292.2 |
297.1 |
301.0 |
1.3% |
2.3% |
2.2% |
|
Sri Lanka |
5.1 |
5.3 |
5.7 |
5.9 |
6.0 |
6.1 |
5.5 |
7.0 |
7.5 |
7.8 |
8.1 |
3.3% |
3.7% |
0.1% |
|
Taiwan |
106.6 |
104.7 |
110.9 |
109.3 |
109.1 |
111.1 |
113.8 |
112.9 |
115.0 |
117.0 |
118.4 |
1.2% |
0.4% |
0.9% |
|
Thailand |
95.2 |
98.5 |
104.8 |
108.9 |
116.5 |
118.3 |
121.6 |
124.7 |
127.3 |
130.2 |
133.0 |
2.1% |
3.3% |
1.0% |
|
Vietnam |
38.5 |
39.4 |
44.6 |
51.0 |
53.4 |
57.2 |
62.6 |
69.1 |
73.9 |
75.8 |
85.8 |
13.1% |
9.4% |
0.6% |
|
Other Asia Pacific |
46.2 |
42.2 |
45.4 |
45.2 |
48.3 |
48.8 |
52.7 |
53.9 |
60.5 |
62.4 |
65.4 |
4.8% |
3.5% |
0.5% |
|
Total Asia Pacific |
4316.2 |
4418.7 |
4701.5 |
4954.5 |
5121.6 |
5274.4 |
5389.6 |
5475.7 |
5587.0 |
5748.0 |
5985.8 |
4.1% |
3.2% |
43.2% |
|
Total World |
11705.1 |
11540.3 |
12099.9 |
12403.7 |
12575.5 |
12819.4 |
12939.8 |
13045.6 |
13228.6 |
13474.6 |
13864.9 |
2.9% |
1.5% |
100.0% |
|
of which: OECD |
5636.3 |
5365.1 |
5570.8 |
5517.5 |
5463.8 |
5522.7 |
5483.5 |
5495.7 |
5530.6 |
5586.9 |
5669.0 |
1.5% |
-0.2% |
40.9% |
|
Non-OECD |
6068.8 |
6175.2 |
6529.1 |
6886.2 |
7111.7 |
7296.8 |
7456.3 |
7549.9 |
7698.0 |
7887.7 |
8195.9 |
3.9% |
3.0% |
59.1% |
|
European Union |
1818.1 |
1714.8 |
1777.1 |
1719.1 |
1705.8 |
1694.4 |
1631.7 |
1652.9 |
1670.4 |
1691.8 |
1688.2 |
-0.2% |
-0.8% |
12.2% |
*In this review, primary energy comprises commercially-traded fuels, including modern renewables used to generate electricity.Less than 0.05%.
8 |
BP Statistical Review of World Energy 2019 |
vk.com/id446425943
Primary energy: consumption by fuel*
|
|
|
|
2017 |
|
|
|
|
|
|
|
|
|
2018 |
|
|
|
|
|
|
|
|
|
|
|
|
|
|
|
|
|
|
|
|
|
||
|
|
Natural |
|
Nuclear |
Hydro- |
Renew- |
|
|
|
Natural |
|
Nuclear |
Hydro- |
Renew- |
|
|
||
Million tonnes oil equivalent |
Oil |
gas |
Coal |
energy |
electricity |
ables |
Total |
Oil |
gas |
Coal |
energy |
electricity |
ables |
Total |
||||
Canada |
108.8 |
94.3 |
18.6 |
22.7 |
89.7 |
9.5 |
343.7 |
|
110.0 |
99.5 |
14.4 |
22.6 |
87.6 |
10.3 |
344.4 |
|||
Mexico |
85.8 |
74.3 |
15.2 |
2.5 |
7.2 |
4.3 |
189.3 |
|
82.8 |
77.0 |
11.9 |
3.1 |
7.3 |
4.8 |
186.9 |
|||
US |
902.0 |
635.8 |
331.3 |
191.7 |
67.2 |
94.5 |
2222.5 |
|
919.7 |
702.6 |
317.0 |
192.2 |
65.3 |
103.8 |
2300.6 |
|||
Total North America |
1096.6 |
804.4 |
365.1 |
216.9 |
164.1 |
108.4 |
2755.5 |
|
1112.5 |
879.1 |
343.3 |
217.9 |
160.3 |
118.8 |
2832.0 |
|||
Argentina |
32.0 |
41.5 |
1.1 |
1.4 |
9.4 |
0.7 |
86.1 |
|
30.1 |
41.9 |
1.2 |
1.6 |
9.4 |
0.9 |
85.1 |
|||
Brazil |
136.1 |
32.4 |
16.6 |
3.6 |
83.9 |
21.4 |
293.9 |
|
135.9 |
30.9 |
15.9 |
3.5 |
87.7 |
23.6 |
297.6 |
|||
Chile |
17.7 |
4.8 |
7.7 |
|
– |
4.8 |
3.3 |
38.3 |
|
18.1 |
5.5 |
7.7 |
|
– |
5.2 |
3.5 |
40.1 |
|
Colombia |
16.5 |
10.5 |
5.2 |
|
– |
13.0 |
0.5 |
45.5 |
|
16.6 |
11.2 |
5.9 |
|
– |
12.8 |
0.5 |
46.9 |
|
Ecuador |
11.3 |
0.7 |
– |
|
– |
4.5 |
0.1 |
16.7 |
|
12.2 |
0.6 |
– |
|
– |
4.7 |
0.1 |
17.6 |
|
Peru |
12.0 |
5.8 |
0.6 |
|
– |
6.6 |
0.4 |
25.4 |
|
12.4 |
6.1 |
0.9 |
|
– |
7.0 |
0.7 |
27.0 |
|
Trinidad & Tobago |
2.1 |
13.1 |
– |
|
– |
– |
† |
15.2 |
|
2.1 |
13.2 |
– |
|
– |
– |
† |
15.3 |
|
Venezuela |
22.1 |
33.4 |
0.1 |
|
– |
18.0 |
† |
73.6 |
|
19.5 |
28.7 |
0.1 |
|
– |
16.3 |
† |
64.6 |
|
Other S. & Cent. America |
67.4 |
6.2 |
3.5 |
|
– |
22.8 |
5.2 |
105.1 |
|
68.3 |
6.8 |
4.3 |
|
– |
22.3 |
6.1 |
107.8 |
|
Total S. & Cent. America |
317.2 |
148.4 |
34.8 |
4.9 |
163.0 |
31.5 |
699.8 |
|
315.3 |
144.8 |
36.0 |
5.1 |
165.5 |
35.4 |
702.0 |
|
||
Austria |
13.1 |
7.8 |
3.1 |
|
– |
8.7 |
2.8 |
35.5 |
|
13.4 |
7.5 |
2.9 |
|
– |
8.5 |
2.8 |
35.0 |
|
Belgium |
33.7 |
14.1 |
3.1 |
9.6 |
0.1 |
3.5 |
64.1 |
|
34.1 |
14.5 |
3.3 |
6.4 |
0.1 |
3.8 |
62.2 |
|
||
Czech Republic |
10.4 |
7.2 |
15.6 |
6.4 |
0.4 |
1.8 |
41.8 |
|
10.6 |
6.9 |
15.7 |
6.8 |
0.4 |
1.7 |
42.1 |
|
||
Finland |
10.3 |
1.6 |
4.0 |
5.1 |
3.3 |
3.8 |
28.1 |
|
10.7 |
1.8 |
4.3 |
5.2 |
3.0 |
4.3 |
29.3 |
|
||
France |
79.1 |
38.5 |
9.3 |
90.1 |
11.1 |
9.4 |
237.5 |
|
78.9 |
36.7 |
8.4 |
93.5 |
14.5 |
10.6 |
242.6 |
|
||
Germany |
119.0 |
77.2 |
71.5 |
17.3 |
4.6 |
44.4 |
333.9 |
|
113.2 |
75.9 |
66.4 |
17.2 |
3.8 |
47.3 |
323.9 |
|
||
Greece |
16.0 |
4.1 |
4.8 |
|
– |
0.9 |
2.2 |
28.0 |
|
16.0 |
4.1 |
4.7 |
|
– |
1.3 |
2.4 |
28.3 |
|
Hungary |
8.3 |
8.5 |
2.2 |
3.6 |
† |
0.7 |
23.5 |
|
8.8 |
8.3 |
2.2 |
3.6 |
0.1 |
0.8 |
23.7 |
|
||
Italy |
62.0 |
61.5 |
9.6 |
|
– |
7.8 |
15.3 |
156.3 |
|
60.8 |
59.5 |
8.9 |
|
– |
10.4 |
14.9 |
154.5 |
|
Netherlands |
39.6 |
31.0 |
9.1 |
0.8 |
† |
3.9 |
84.5 |
|
40.9 |
30.7 |
8.2 |
0.8 |
† |
4.2 |
84.8 |
|
||
Norway |
10.1 |
3.9 |
0.8 |
|
– |
32.1 |
0.7 |
47.6 |
|
10.4 |
3.9 |
0.8 |
|
– |
31.3 |
0.9 |
47.4 |
|
Poland |
31.7 |
16.5 |
49.8 |
|
– |
0.6 |
4.9 |
103.4 |
|
32.8 |
17.0 |
50.5 |
|
– |
0.4 |
4.4 |
105.2 |
|
Portugal |
12.0 |
5.5 |
3.2 |
|
– |
1.3 |
3.8 |
25.8 |
|
11.5 |
5.0 |
2.7 |
|
– |
2.8 |
3.9 |
26.0 |
|
Romania |
10.3 |
9.6 |
5.4 |
2.6 |
3.3 |
2.2 |
33.4 |
|
10.2 |
9.3 |
5.3 |
2.6 |
4.0 |
2.0 |
33.4 |
|||
Spain |
65.0 |
27.3 |
13.4 |
13.1 |
4.2 |
15.7 |
138.8 |
|
66.6 |
27.1 |
11.1 |
12.6 |
8.0 |
16.0 |
141.4 |
|||
Sweden |
15.4 |
0.7 |
2.0 |
14.9 |
14.7 |
6.8 |
54.4 |
|
14.8 |
0.7 |
2.0 |
15.5 |
14.0 |
6.6 |
53.6 |
|||
Switzerland |
10.9 |
2.7 |
0.1 |
4.6 |
7.7 |
0.8 |
26.9 |
|
10.5 |
2.6 |
0.1 |
5.8 |
7.9 |
0.9 |
27.8 |
|||
Turkey |
49.2 |
44.3 |
39.5 |
|
– |
13.2 |
6.6 |
152.7 |
|
48.6 |
40.7 |
42.3 |
|
– |
13.5 |
8.5 |
153.5 |
|
Ukraine |
9.9 |
26.0 |
25.7 |
19.4 |
2.0 |
0.4 |
83.4 |
|
9.6 |
26.3 |
26.2 |
19.1 |
2.2 |
0.6 |
84.0 |
|||
United Kingdom |
78.0 |
67.8 |
9.1 |
15.9 |
1.3 |
21.1 |
193.2 |
|
77.0 |
67.8 |
7.6 |
14.7 |
1.2 |
23.9 |
192.3 |
|||
Other Europe |
62.5 |
26.1 |
34.1 |
8.4 |
14.9 |
11.4 |
157.3 |
|
62.4 |
25.9 |
33.6 |
8.3 |
17.9 |
11.7 |
159.8 |
|||
Total Europe |
746.2 |
481.9 |
315.5 |
211.8 |
132.3 |
162.3 |
2050.0 |
|
742.0 |
472.0 |
307.1 |
212.1 |
145.3 |
172.2 |
2050.7 |
|||
Azerbaijan |
4.7 |
9.1 |
† |
|
– |
0.4 |
† |
14.3 |
|
4.6 |
9.3 |
† |
|
– |
0.4 |
† |
14.4 |
|
Belarus |
6.7 |
15.7 |
0.8 |
|
– |
0.1 |
0.1 |
23.4 |
|
6.8 |
16.6 |
1.0 |
|
– |
0.1 |
0.1 |
24.6 |
|
Kazakhstan |
15.0 |
13.7 |
36.4 |
|
– |
2.5 |
0.1 |
67.6 |
|
16.4 |
16.7 |
40.8 |
|
– |
2.3 |
0.1 |
76.4 |
|
Russian Federation |
151.5 |
370.7 |
83.9 |
46.0 |
41.9 |
0.3 |
694.3 |
|
152.3 |
390.8 |
88.0 |
46.3 |
43.0 |
0.3 |
720.7 |
|
||
Turkmenistan |
6.9 |
21.8 |
– |
|
– |
– |
† |
28.7 |
|
7.1 |
24.4 |
– |
|
– |
– |
† |
31.5 |
|
Uzbekistan |
2.7 |
37.1 |
3.5 |
|
– |
1.7 |
– |
45.0 |
|
2.6 |
36.6 |
3.1 |
|
– |
1.6 |
– |
43.9 |
|
Other CIS |
3.6 |
4.3 |
1.8 |
0.6 |
7.7 |
† |
18.0 |
|
3.7 |
4.9 |
2.0 |
0.5 |
8.0 |
† |
19.0 |
|
||
Total CIS |
191.1 |
472.3 |
126.4 |
46.6 |
54.3 |
0.5 |
891.2 |
|
193.5 |
499.4 |
134.9 |
46.7 |
55.4 |
0.6 |
930.5 |
|
||
Iran |
84.5 |
180.5 |
1.4 |
1.6 |
3.9 |
0.1 |
272.0 |
|
86.2 |
193.9 |
1.5 |
1.6 |
2.4 |
0.1 |
285.7 |
|
||
Iraq |
35.6 |
11.0 |
– |
|
– |
0.5 |
† |
47.1 |
|
38.4 |
14.7 |
– |
|
– |
0.7 |
† |
53.7 |
|
Israel |
11.7 |
8.5 |
5.0 |
|
– |
† |
0.4 |
25.6 |
|
11.5 |
9.0 |
4.7 |
|
– |
† |
0.5 |
25.6 |
|
Kuwait |
20.4 |
18.1 |
0.2 |
|
– |
– |
† |
38.7 |
|
20.0 |
18.7 |
0.2 |
|
– |
– |
† |
39.0 |
|
Oman |
9.2 |
20.0 |
0.1 |
|
– |
– |
† |
29.3 |
|
9.2 |
21.4 |
0.1 |
|
– |
– |
† |
30.7 |
|
Qatar |
11.8 |
37.0 |
– |
|
– |
– |
† |
48.9 |
|
12.2 |
36.0 |
– |
|
– |
– |
† |
48.3 |
|
Saudi Arabia |
168.8 |
93.9 |
0.1 |
|
– |
– |
† |
262.8 |
|
162.6 |
96.4 |
0.1 |
|
– |
– |
† |
259.2 |
|
United Arab Emirates |
43.8 |
64.0 |
1.0 |
|
– |
– |
0.1 |
109.0 |
|
45.1 |
65.8 |
1.1 |
|
– |
– |
0.2 |
112.2 |
|
Other Middle East |
26.6 |
20.1 |
0.4 |
|
– |
0.3 |
0.5 |
48.0 |
|
26.8 |
19.5 |
0.4 |
|
– |
0.3 |
0.8 |
47.9 |
|
Total Middle East |
412.5 |
453.2 |
8.2 |
1.6 |
4.7 |
1.3 |
881.4 |
|
412.1 |
475.6 |
7.9 |
1.6 |
3.4 |
1.7 |
902.3 |
|||
Algeria |
19.4 |
33.4 |
0.2 |
|
– |
† |
0.1 |
53.1 |
|
19.6 |
36.7 |
0.2 |
|
– |
† |
0.1 |
56.7 |
|
Egypt |
39.2 |
48.1 |
1.6 |
|
– |
3.0 |
0.6 |
92.6 |
|
36.7 |
51.2 |
2.8 |
|
– |
3.1 |
0.8 |
94.5 |
|
Morocco |
13.5 |
1.0 |
4.5 |
|
– |
0.3 |
0.8 |
20.0 |
|
13.2 |
0.9 |
5.4 |
|
– |
0.4 |
1.1 |
21.0 |
|
South Africa |
27.5 |
3.8 |
84.3 |
3.6 |
0.2 |
2.4 |
121.8 |
|
26.3 |
3.7 |
86.0 |
2.5 |
0.2 |
2.8 |
121.5 |
|||
Other Africa |
92.4 |
34.7 |
7.0 |
|
– |
24.7 |
2.2 |
161.0 |
|
95.5 |
36.4 |
7.0 |
|
– |
26.4 |
2.4 |
167.8 |
|
Total Africa |
192.1 |
121.0 |
97.6 |
3.6 |
28.2 |
6.1 |
448.6 |
|
191.3 |
129.0 |
101.4 |
2.5 |
30.1 |
7.2 |
461.5 |
|||
Australia |
51.1 |
35.5 |
45.1 |
|
– |
3.1 |
5.8 |
140.5 |
|
53.3 |
35.6 |
44.3 |
|
– |
3.9 |
7.2 |
144.3 |
|
Bangladesh |
7.9 |
22.9 |
1.9 |
|
– |
0.2 |
0.1 |
33.0 |
|
9.0 |
24.4 |
2.1 |
|
– |
0.2 |
0.1 |
35.8 |
|
China |
610.7 |
206.7 |
1890.4 |
56.1 |
263.6 |
111.4 |
3139.0 |
|
641.2 |
243.3 |
1906.7 |
66.6 |
272.1 |
143.5 |
3273.5 |
|||
China Hong Kong SAR |
21.9 |
2.7 |
6.3 |
|
– |
– |
† |
30.9 |
|
22.2 |
2.6 |
6.3 |
|
– |
– |
† |
31.1 |
|
India |
227.1 |
46.2 |
415.9 |
8.5 |
30.7 |
21.7 |
750.1 |
|
239.1 |
49.9 |
452.2 |
8.8 |
31.6 |
27.5 |
809.2 |
|
||
Indonesia |
79.3 |
33.1 |
57.2 |
|
– |
4.2 |
3.0 |
176.9 |
|
83.4 |
33.5 |
61.6 |
|
– |
3.7 |
3.3 |
185.5 |
|
Japan |
187.8 |
100.6 |
119.9 |
6.6 |
17.9 |
22.4 |
455.2 |
|
182.4 |
99.5 |
117.5 |
11.1 |
18.3 |
25.4 |
454.1 |
|
||
Malaysia |
36.0 |
35.9 |
19.3 |
|
– |
5.2 |
0.3 |
96.7 |
|
36.9 |
35.5 |
21.1 |
|
– |
5.5 |
0.3 |
99.3 |
|
New Zealand |
8.5 |
4.3 |
1.2 |
|
– |
5.7 |
2.4 |
22.2 |
|
8.4 |
3.7 |
1.3 |
|
– |
6.0 |
2.4 |
21.7 |
|
Pakistan |
29.2 |
35.0 |
7.1 |
1.9 |
6.9 |
0.9 |
81.0 |
|
24.3 |
37.5 |
11.6 |
2.2 |
8.1 |
1.2 |
85.0 |
|
||
Philippines |
21.7 |
3.2 |
15.5 |
|
– |
2.2 |
3.1 |
45.7 |
|
22.0 |
3.5 |
16.3 |
|
– |
2.1 |
3.2 |
47.0 |
|
Singapore |
74.8 |
10.6 |
0.9 |
|
– |
– |
0.2 |
86.5 |
|
75.8 |
10.6 |
0.9 |
|
– |
– |
0.3 |
87.6 |
|
South Korea |
130.0 |
42.8 |
86.2 |
33.6 |
0.6 |
4.0 |
297.1 |
|
128.9 |
48.1 |
88.2 |
30.2 |
0.7 |
5.0 |
301.0 |
|
||
Sri Lanka |
5.4 |
– |
1.4 |
|
– |
0.9 |
0.1 |
7.8 |
|
5.3 |
– |
1.2 |
|
– |
1.4 |
0.1 |
8.1 |
|
Taiwan |
50.1 |
20.0 |
39.4 |
5.1 |
1.2 |
1.2 |
117.0 |
|
50.0 |
20.3 |
39.3 |
6.3 |
1.0 |
1.5 |
118.4 |
|
||
Thailand |
64.4 |
43.1 |
18.3 |
|
– |
1.1 |
3.4 |
130.2 |
|
65.8 |
42.9 |
18.5 |
|
– |
1.7 |
4.0 |
133.0 |
|
Vietnam |
23.6 |
8.2 |
27.9 |
|
– |
16.0 |
0.1 |
75.8 |
|
24.9 |
8.3 |
34.3 |
|
– |
18.3 |
0.1 |
85.8 |
|
Other Asia Pacific |
21.9 |
9.8 |
16.9 |
|
– |
13.6 |
0.2 |
62.4 |
|
22.5 |
10.3 |
18.0 |
|
– |
14.2 |
0.3 |
65.4 |
|
Total Asia Pacific |
1651.3 |
660.6 |
2770.8 |
111.7 |
373.2 |
180.2 |
5748.0 |
|
1695.4 |
709.6 |
2841.3 |
125.3 |
388.9 |
225.4 |
5985.8 |
|||
Total World |
4607.0 |
3141.9 |
3718.4 |
597.1 |
919.9 |
490.2 |
13474.6 |
|
4662.1 |
3309.4 |
3772.1 |
611.3 |
948.8 |
561.3 |
13864.9 |
|||
of which: OECD |
2196.5 |
1435.2 |
892.9 |
443.4 |
314.6 |
304.3 |
5586.9 |
|
2204.8 |
1505.2 |
861.3 |
446.1 |
321.3 |
330.4 |
5669.0 |
|||
Non-OECD |
2410.5 |
1706.7 |
2825.6 |
153.7 |
605.3 |
185.9 |
7887.7 |
|
2457.3 |
1804.2 |
2910.8 |
165.2 |
627.5 |
230.8 |
8195.9 |
|||
European Union |
649.5 |
400.4 |
234.2 |
187.8 |
67.4 |
152.4 |
1691.8 |
|
646.8 |
394.2 |
222.4 |
187.2 |
78.0 |
159.6 |
1688.2 |
|||
*In this review, primary energy comprises commercially-traded fuels, including modern renewables used to generate electricity.
†Less than 0.05.
BP Statistical Review of World Energy 2019 |
9 |
vk.com/id446425943
World consumption
Million tonnes oil equivalent
|
|
Coal |
|
|
|
|
|
|
|
|
|
|
|
|
|
|
|
|
|
|
|
|
|
|
|
|
14000 |
|
|
|
|
|
|
|
|
|
|
|
|
|
|
|
|
|
|
|
|
|
|
|
|
|
|
|
|
|
|
Renewables |
|
|
|
|
|
|
|
|
|
|
|
|
|
|
|
|
|
|
|
|
|
|
|
|
|
|
|
|
|
|
|
|
|
|
|
|
|
|
|
|
|
|
|
|
|
|
|
|
|
|
|
||
|
|
|
|
|
|
|
|
|
|
|
|
|
|
|
|
|
|
|
|
|
|
|
|
|
13000 |
||
|
|
Hydroelectricity |
|
|
|
|
|
|
|
|
|
|
|
|
|
|
|
|
|
|
|
|
|
|
|
||
|
|
|
|
|
|
|
|
|
|
|
|
|
|
|
|
|
|
|
|
|
|
|
|
|
|||
|
|
|
|
|
|
|
|
|
|
|
|
|
|
|
|
|
|
|
|
|
|
|
|
|
|
||
|
|
Nuclear energy |
|
|
|
|
|
|
|
|
|
|
|
|
|
|
|
|
|
|
|
|
|
|
|
|
|
|
|
|
|
|
|
|
|
|
|
|
|
|
|
|
|
|
|
|
|
|
|
|
|
|
|
||
|
|
Natural gas |
|
|
|
|
|
|
|
|
|
|
|
|
|
|
|
|
|
|
|
|
|
|
|
12000 |
|
|
|
|
|
|
|
|
|
|
|
|
|
|
|
|
|
|
|
|
|
|
|
|
|
|
|||
|
|
|
|
|
|
|
|
|
|
|
|
|
|
|
|
|
|
|
|
|
|
|
|
|
|
||
|
|
Oil |
|
|
|
|
|
|
|
|
|
|
|
|
|
|
|
|
|
|
|
|
|
|
|
|
|
|
|
|
|
|
|
|
|
|
|
|
|
|
|
|
|
|
|
|
|
|
|
|
|
|
|
|
|
|
|
|
|
|
|
|
|
|
|
|
|
|
|
|
|
|
|
|
|
|
|
|
|
|
|
|
|
|
|
|
|
|
|
|
|
|
|
|
|
|
|
|
|
|
|
|
|
|
|
|
|
|
|
|
11000 |
|
|
|
|
|
|
|
|
|
|
|
|
|
|
|
|
|
|
|
|
|
|
|
|
|
|
|
|
|
|
|
|
|
|
|
|
|
|
|
|
|
|
|
|
|
|
|
|
|
|
|
|
|
|
|
10000 |
|
|
|
|
|
|
|
|
|
|
|
|
|
|
|
|
|
|
|
|
|
|
|
|
|
|
|
|
|
|
|
|
|
|
|
|
|
|
|
|
|
|
|
|
|
|
|
|
|
|
|
|
|
|
|
9000 |
|
|
|
|
|
|
|
|
|
|
|
|
|
|
|
|
|
|
|
|
|
|
|
|
|
|
|
|
|
|
|
|
|
|
|
|
|
|
|
|
|
|
|
|
|
|
|
|
|
|
|
|
|
|
|
8000 |
|
|
|
|
|
|
|
|
|
|
|
|
|
|
|
|
|
|
|
|
|
|
|
|
|
|
|
|
|
|
|
|
|
|
|
|
|
|
|
|
|
|
|
|
|
|
|
|
|
|
|
|
|
|
|
7000 |
|
|
|
|
|
|
|
|
|
|
|
|
|
|
|
|
|
|
|
|
|
|
|
|
|
|
|
|
|
|
|
|
|
|
|
|
|
|
|
|
|
|
|
|
|
|
|
|
|
|
|
|
|
|
|
6000 |
|
|
|
|
|
|
|
|
|
|
|
|
|
|
|
|
|
|
|
|
|
|
|
|
|
|
|
|
|
|
|
|
|
|
|
|
|
|
|
|
|
|
|
|
|
|
|
|
|
|
|
|
|
|
|
5000 |
|
|
|
|
|
|
|
|
|
|
|
|
|
|
|
|
|
|
|
|
|
|
|
|
|
|
|
|
|
|
|
|
|
|
|
|
|
|
|
|
|
|
|
|
|
|
|
|
|
|
|
|
|
|
|
4000 |
|
|
|
|
|
|
|
|
|
|
|
|
|
|
|
|
|
|
|
|
|
|
|
|
|
|
|
|
|
|
|
|
|
|
|
|
|
|
|
|
|
|
|
|
|
|
|
|
|
|
|
|
|
|
|
3000 |
|
|
|
|
|
|
|
|
|
|
|
|
|
|
|
|
|
|
|
|
|
|
|
|
|
|
|
|
|
|
|
|
|
|
|
|
|
|
|
|
|
|
|
|
|
|
|
|
|
|
|
|
|
|
|
2000 |
|
|
|
|
|
|
|
|
|
|
|
|
|
|
|
|
|
|
|
|
|
|
|
|
|
|
|
|
|
|
|
|
|
|
|
|
|
|
|
|
|
|
|
|
|
|
|
|
|
|
|
|
|
|
|
1000 |
|
|
|
|
|
|
|
|
|
|
|
|
|
|
|
|
|
|
|
|
|
|
|
|
|
|
|
|
93 |
94 |
95 |
96 |
97 |
98 |
99 |
00 |
01 |
02 |
03 |
04 |
05 |
06 |
07 |
08 |
09 |
10 |
11 |
12 |
13 |
14 |
15 |
16 |
17 |
18 |
0 |
|
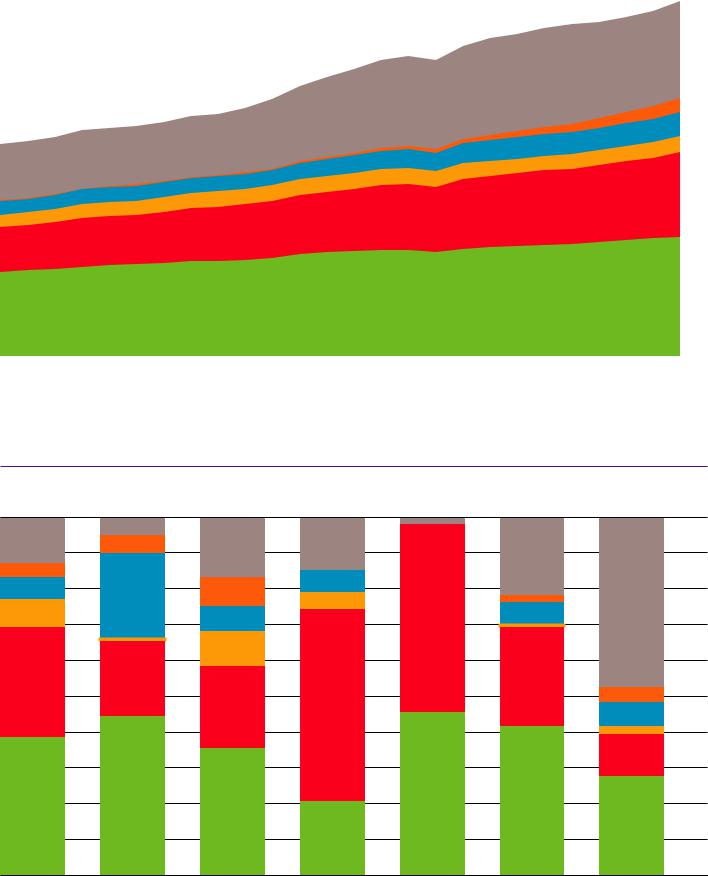
Global energy consumption increased by 2.9% in 2018. Growth was the strongest since 2010 and almost double the 10-year average. The demand for all fuels increased but growth was particularly strong in the case of gas (168 mtoe, accounting for 43% of the global increase) and renewables (71 mtoe, 18% of the global increase). In the OECD, energy demand increased by 82 mtoe on the back of strong gas demand growth (70 mtoe). In the non-OECD, energy demand growth (308 mtoe) was more evenly distributed with gas (98 mtoe), coal (85 mtoe) and oil (47 mtoe) accounting for most of the growth.
Regional consumption by fuel 2018 |
|
|
|
|
|
|
|
Percentage |
|
|
|
|
|
|
|
|
|
|
|
|
|
|
100 |
|
|
|
|
|
|
|
90 |
|
|
|
|
|
|
|
80 |
|
|
|
|
|
|
|
70 |
|
|
|
|
|
|
|
60 |
|
|
|
|
|
|
|
50 |
|
|
|
|
|
|
|
40 |
|
|
|
|
|
|
|
30 |
|
|
|
|
|
|
|
20 |
|
|
|
|
|
|
|
10 |
North America |
S. & Cent. America |
Europe |
CIS |
Middle East |
Africa |
Asia Pacific |
0 |
Oil remains the dominant fuel in Africa, Europe and the Americas, while natural gas dominates in CIS and the Middle East, accounting for more than half of the energy mix in both regions. Coal is the dominant fuel in the Asia Pacific region. In 2018 coal’s share of primary energy fell to its lowest level in our data series in North America and Europe.
10 |
BP Statistical Review of World Energy 2019 |
vk.com/id446425943
Fuel consumption by region 2018
Percentage
|
Asia Pacific |
|
Europe |
|
North America |
|
|
|
|||
|
|
|
|||
|
Africa |
|
CIS |
|
|
|
|
|
|
||
|
|
|
|
||
|
Middle East |
|
S. & Cent. America |
|
|
|
|
|
|
||
|
|
|
|
|
|
|
|
|
|
100 |
|
|
|
|
|
|
90 |
|
|
|
|
|
|
80 |
|
|
|
|
|
|
70 |
|
|
|
|
|
|
60 |
|
|
|
|
|
|
50 |
|
|
|
|
|
|
40 |
|
|
|
|
|
|
30 |
|
|
|
|
|
|
20 |
|
|
|
|
|
|
10 |
Oil |
Natural gas |
Coal |
Nuclear energy |
Hydroelectricity |
Renewables |
0 |
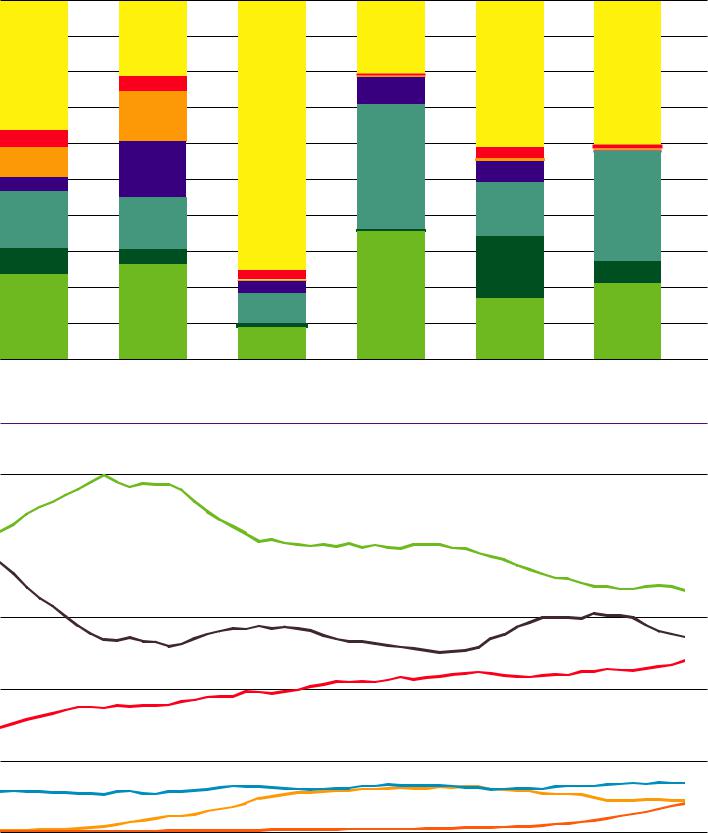
Oil is mostly consumed in Asia Pacific and North America. Together, these regions account for 60% of global consumption. Global coal consumption is heavily concentrated in Asia Pacific while more than two thirds of nuclear consumption is concentrated in North America and Europe. Asia Pacific and South & Central America account for almost 60% of hydro. More than 90% of renewables are consumed in Asia Pacific, Europe and North America.
Shares of global primary energy consumption by fuel
Percentage
|
|
Oil |
|
Hydroelectricity |
50 |
|
|
|
|||
|
|
Coal |
|
Nuclear energy |
|
|
|
|
|
||
|
|
|
|
||
|
|
Natural gas |
|
Renewables |
|
|
|
|
|
||
|
|
|
|
|
|
|
|
|
|
|
40 |
30
20
10
85 |
86 |
87 |
88 |
89 |
90 |
91 |
92 |
93 |
94 |
95 |
96 |
97 |
98 |
99 |
00 |
01 |
02 |
03 |
04 |
05 |
06 |
07 |
08 |
09 |
10 |
11 |
12 |
13 |
14 |
15 |
16 |
17 |
18 |
0 |
Oil remains the most used fuel in the energy mix. Coal is the second largest fuel but lost share in 2018 to account for 27%, its lowest level in 15 years. The share of natural gas increased to 24% such that the gap between coal and gas has narrowed to three percentage points. The contribution of hydro and nuclear remained relatively flat in 2018 at 7% and 4%, respectively. Strong growth pushed up renewables share to 4%, just behind nuclear.
BP Statistical Review of World Energy 2019 |
11 |

vk.com/id446425943 |
|
|
|
|
|
|
|
|
|
|
|
|
|
|
|
Primary energy: consumption per capita* |
|
|
|
|
|
|
|
|
|
|
|
||
|
|
|
|
|
|
|
|
|
|
|
|
|
Growth rate per annum |
|
|
Gigajoules per capita |
2008 |
2009 |
2010 |
2011 |
2012 |
2013 |
2014 |
2015 |
2016 |
2017 |
2018 |
2018 |
2007-17 |
|
Canada |
403.0 |
377.8 |
382.3 |
396.6 |
389.6 |
400.2 |
401.9 |
394.9 |
390.2 |
392.9 |
390.2 |
-0.7% |
-0.4% |
|
Mexico |
62.9 |
61.5 |
62.3 |
64.4 |
63.8 |
63.2 |
62.1 |
61.2 |
61.2 |
61.4 |
59.8 |
-2.5% |
-0.2% |
|
US |
311.7 |
293.9 |
301.6 |
296.7 |
287.1 |
293.0 |
294.2 |
289.6 |
287.5 |
286.8 |
294.8 |
2.8% |
-1.2% |
|
Total North America |
255.7 |
241.2 |
246.6 |
244.6 |
237.2 |
241.5 |
241.9 |
237.8 |
235.8 |
235.3 |
239.8 |
1.9% |
-1.1% |
|
Argentina |
77.4 |
75.2 |
78.4 |
79.1 |
80.6 |
83.2 |
81.9 |
83.0 |
82.0 |
81.4 |
79.7 |
-2.1% |
0.6% |
|
Brazil |
52.1 |
51.3 |
56.0 |
58.1 |
58.7 |
60.5 |
61.4 |
60.2 |
58.4 |
58.8 |
59.1 |
0.5% |
1.6% |
|
Chile |
80.8 |
78.5 |
78.1 |
84.2 |
85.4 |
85.6 |
83.4 |
84.7 |
88.1 |
88.8 |
92.3 |
3.8% |
0.7% |
|
Colombia |
31.0 |
29.3 |
31.1 |
32.2 |
34.2 |
34.4 |
35.9 |
35.9 |
38.1 |
38.8 |
39.7 |
2.3% |
3.0% |
|
Ecuador |
35.1 |
33.8 |
37.1 |
38.7 |
40.2 |
41.0 |
42.4 |
41.7 |
41.0 |
42.0 |
43.8 |
4.3% |
2.3% |
|
Peru |
24.3 |
24.6 |
26.7 |
29.5 |
29.6 |
30.1 |
30.5 |
32.3 |
33.6 |
33.1 |
34.7 |
5.1% |
3.8% |
|
Trinidad & Tobago |
505.0 |
508.2 |
551.8 |
551.6 |
521.8 |
534.6 |
517.8 |
521.1 |
473.0 |
466.2 |
465.5 |
-0.1% |
-1.1% |
|
Venezuela |
125.9 |
123.6 |
114.9 |
118.5 |
121.8 |
117.3 |
111.9 |
106.6 |
95.8 |
96.4 |
83.6 |
-13.3% |
-2.5% |
|
Other S. & Cent. America |
37.5 |
36.2 |
36.7 |
37.3 |
37.1 |
36.7 |
36.5 |
37.5 |
39.0 |
38.7 |
39.3 |
1.4% |
0.1% |
|
Total S. & Cent. America |
53.6 |
52.4 |
54.7 |
56.5 |
57.2 |
57.9 |
57.9 |
57.5 |
56.6 |
56.7 |
56.4 |
-0.6% |
0.8% |
|
Austria |
177.9 |
171.8 |
177.0 |
164.7 |
171.9 |
169.1 |
161.7 |
161.3 |
166.1 |
170.3 |
167.4 |
-1.7% |
-0.3% |
|
Belgium |
263.0 |
244.4 |
258.5 |
239.6 |
229.3 |
233.7 |
217.1 |
219.3 |
235.4 |
234.8 |
226.4 |
-3.6% |
-1.0% |
|
Czech Republic |
176.5 |
168.5 |
174.9 |
170.5 |
169.4 |
166.2 |
162.6 |
159.9 |
157.4 |
164.7 |
166.0 |
0.8% |
-0.9% |
|
Finland |
247.5 |
229.2 |
248.7 |
230.8 |
223.1 |
224.2 |
215.7 |
213.8 |
218.7 |
212.9 |
221.1 |
3.8% |
-1.9% |
|
France |
175.9 |
165.6 |
170.1 |
163.2 |
162.7 |
163.8 |
156.8 |
157.1 |
154.2 |
153.0 |
155.7 |
1.8% |
-1.4% |
|
Germany |
173.2 |
162.9 |
169.7 |
163.5 |
165.5 |
169.9 |
162.6 |
165.3 |
167.7 |
170.2 |
164.8 |
-3.2% |
|
|
Greece |
129.5 |
125.1 |
119.1 |
116.3 |
110.5 |
105.3 |
99.7 |
100.9 |
99.6 |
105.2 |
106.4 |
1.2% |
-2.4% |
|
Hungary |
106.1 |
97.7 |
100.2 |
99.9 |
93.1 |
88.8 |
89.4 |
94.3 |
96.3 |
101.4 |
102.5 |
1.1% |
-0.6% |
|
Italy |
127.4 |
118.7 |
122.3 |
119.5 |
116.2 |
111.0 |
105.2 |
107.7 |
109.0 |
110.2 |
109.1 |
-1.0% |
-1.6% |
|
Netherlands |
237.0 |
232.8 |
245.6 |
234.3 |
226.0 |
218.7 |
206.0 |
208.0 |
211.1 |
207.7 |
207.8 |
0.1% |
-1.5% |
|
Norway |
407.0 |
373.4 |
356.1 |
358.7 |
394.9 |
365.4 |
372.3 |
374.7 |
376.3 |
375.9 |
370.6 |
-1.4% |
-0.6% |
|
Poland |
106.4 |
102.6 |
109.3 |
109.8 |
106.6 |
106.9 |
103.0 |
104.2 |
108.9 |
113.4 |
115.5 |
1.9% |
0.8% |
|
Portugal |
95.8 |
96.4 |
101.4 |
97.1 |
89.2 |
98.4 |
99.8 |
99.6 |
105.7 |
104.4 |
105.7 |
1.2% |
0.5% |
|
Romania |
77.6 |
68.5 |
69.7 |
72.1 |
69.8 |
65.5 |
68.6 |
69.0 |
69.5 |
71.0 |
71.4 |
0.6% |
-0.8% |
|
Spain |
140.6 |
129.2 |
131.1 |
128.4 |
127.9 |
121.8 |
120.2 |
122.2 |
123.7 |
125.4 |
127.6 |
1.7% |
-1.5% |
|
Sweden |
240.4 |
218.8 |
230.9 |
227.4 |
240.0 |
224.3 |
222.5 |
228.4 |
223.7 |
229.7 |
224.8 |
-2.1% |
-0.7% |
|
Switzerland |
163.9 |
162.0 |
156.1 |
146.9 |
153.5 |
156.0 |
147.7 |
143.0 |
133.4 |
132.8 |
136.3 |
2.6% |
-1.8% |
|
Turkey |
59.9 |
60.0 |
62.3 |
65.6 |
68.7 |
67.1 |
68.2 |
73.4 |
76.1 |
79.2 |
78.5 |
-0.9% |
2.7% |
|
Ukraine |
121.0 |
103.3 |
111.1 |
116.1 |
113.7 |
108.9 |
96.3 |
80.3 |
84.6 |
78.9 |
79.9 |
1.3% |
-4.2% |
|
United Kingdom |
148.4 |
139.8 |
141.9 |
132.7 |
133.5 |
132.2 |
124.0 |
124.9 |
123.1 |
122.2 |
120.9 |
-1.1% |
-2.2% |
|
Other Europe |
108.1 |
102.6 |
106.5 |
104.4 |
100.2 |
101.9 |
98.8 |
101.3 |
104.1 |
105.9 |
107.6 |
1.6% |
-0.1% |
|
Total Europe |
138.9 |
130.4 |
134.8 |
131.5 |
130.8 |
129.3 |
124.2 |
125.0 |
126.6 |
127.7 |
127.4 |
-0.2% |
-0.9% |
|
Azerbaijan |
60.9 |
53.2 |
51.9 |
57.0 |
58.0 |
58.9 |
59.3 |
64.1 |
62.8 |
60.9 |
60.7 |
-0.3% |
|
|
Belarus |
113.8 |
108.2 |
115.0 |
114.4 |
123.6 |
108.9 |
112.5 |
102.2 |
101.7 |
103.4 |
108.8 |
5.2% |
-0.8% |
|
Kazakhstan |
147.7 |
131.5 |
140.2 |
152.1 |
155.1 |
154.5 |
154.3 |
150.1 |
150.6 |
155.5 |
173.8 |
11.8% |
0.8% |
|
Russian Federation |
198.0 |
188.2 |
195.8 |
202.2 |
202.5 |
199.9 |
200.5 |
196.5 |
200.8 |
201.9 |
209.6 |
3.8% |
0.3% |
|
Turkmenistan |
103.6 |
166.5 |
176.6 |
192.7 |
206.4 |
179.9 |
183.1 |
215.3 |
203.1 |
208.6 |
225.4 |
8.1% |
5.0% |
|
Uzbekistan |
67.3 |
66.6 |
65.0 |
67.1 |
64.5 |
63.0 |
64.7 |
60.7 |
58.1 |
59.1 |
56.8 |
-3.8% |
-2.1% |
|
Other CIS |
34.6 |
33.0 |
33.2 |
35.1 |
36.6 |
34.4 |
34.8 |
34.1 |
33.9 |
34.3 |
35.9 |
4.6% |
-0.5% |
|
Total CIS |
154.0 |
147.1 |
152.3 |
157.7 |
158.4 |
154.8 |
155.3 |
152.2 |
153.8 |
154.8 |
160.9 |
3.9% |
|
|
|
|
|
|
|
|
|
|
|
|
|
|
|
|
|
Iran |
118.3 |
120.9 |
119.8 |
124.8 |
123.9 |
128.6 |
132.9 |
131.5 |
134.1 |
140.3 |
145.9 |
4.0% |
2.0% |
|
Iraq |
42.0 |
45.6 |
47.3 |
48.4 |
49.9 |
52.0 |
48.1 |
46.5 |
52.0 |
51.5 |
57.2 |
11.0% |
2.2% |
|
Israel |
137.7 |
128.7 |
133.5 |
134.1 |
137.7 |
125.9 |
122.0 |
126.7 |
126.9 |
128.7 |
127.0 |
-1.3% |
-0.8% |
|
Kuwait |
469.4 |
461.4 |
467.4 |
440.7 |
460.4 |
450.3 |
392.4 |
409.2 |
402.2 |
391.7 |
388.5 |
-0.8% |
-1.5% |
|
Oman |
266.1 |
255.2 |
284.1 |
291.6 |
296.2 |
308.9 |
288.2 |
287.1 |
274.1 |
264.9 |
266.0 |
0.4% |
1.2% |
|
Qatar |
740.8 |
653.7 |
680.1 |
717.2 |
753.2 |
759.7 |
773.5 |
813.8 |
775.0 |
775.1 |
749.7 |
-3.3% |
-0.1% |
|
Saudi Arabia |
297.5 |
305.1 |
325.1 |
326.0 |
335.5 |
327.2 |
341.2 |
343.6 |
340.1 |
334.1 |
323.4 |
-3.2% |
1.8% |
|
United Arab Emirates |
491.8 |
436.7 |
424.1 |
426.6 |
436.5 |
454.7 |
449.4 |
489.9 |
501.7 |
485.3 |
492.3 |
1.5% |
-0.1% |
|
Other Middle East |
41.9 |
40.8 |
39.7 |
36.5 |
33.5 |
32.5 |
31.9 |
30.4 |
29.7 |
29.2 |
28.7 |
-1.8% |
-3.5% |
|
Total Middle East |
132.3 |
132.8 |
136.5 |
138.8 |
141.1 |
142.7 |
144.3 |
146.2 |
147.2 |
147.5 |
148.5 |
0.7% |
1.5% |
|
Algeria |
43.7 |
45.6 |
43.6 |
45.4 |
48.6 |
50.4 |
53.9 |
55.8 |
54.7 |
53.8 |
56.5 |
5.0% |
2.5% |
|
Egypt |
37.1 |
37.9 |
39.0 |
38.8 |
39.9 |
38.8 |
37.8 |
38.1 |
39.4 |
39.8 |
39.8 |
0.2% |
1.2% |
|
Morocco |
20.4 |
19.7 |
21.5 |
22.3 |
22.4 |
22.7 |
22.7 |
22.7 |
22.7 |
23.5 |
24.3 |
3.6% |
2.3% |
|
South Africa |
104.1 |
102.7 |
102.5 |
99.8 |
97.0 |
95.9 |
95.8 |
92.3 |
92.6 |
89.9 |
88.6 |
-1.4% |
-0.9% |
|
Other Africa |
6.1 |
6.0 |
6.2 |
6.0 |
6.2 |
6.3 |
6.5 |
6.5 |
6.4 |
6.6 |
6.7 |
1.4% |
1.0% |
|
Total Africa |
15.3 |
15.2 |
15.3 |
15.0 |
15.1 |
15.1 |
15.2 |
15.1 |
15.0 |
15.0 |
15.0 |
0.3% |
0.1% |
|
Australia |
259.5 |
253.0 |
249.7 |
254.0 |
247.0 |
244.7 |
245.2 |
244.9 |
246.7 |
240.6 |
243.9 |
1.4% |
-0.8% |
|
Bangladesh |
5.3 |
5.7 |
5.9 |
6.3 |
6.7 |
6.8 |
7.1 |
8.1 |
8.2 |
8.4 |
9.0 |
7.5% |
5.2% |
|
China |
69.5 |
72.2 |
76.7 |
82.4 |
85.2 |
88.0 |
89.6 |
90.2 |
90.9 |
93.2 |
96.9 |
3.9% |
3.3% |
|
China Hong Kong SAR |
146.7 |
159.2 |
164.6 |
167.8 |
160.4 |
163.8 |
159.0 |
162.3 |
165.2 |
175.6 |
175.1 |
-0.2% |
1.0% |
|
India |
16.7 |
17.7 |
18.3 |
19.2 |
19.9 |
20.5 |
21.6 |
22.1 |
22.7 |
23.5 |
25.0 |
6.7% |
3.9% |
|
Indonesia |
23.5 |
24.1 |
26.1 |
28.1 |
29.2 |
29.6 |
27.4 |
26.9 |
27.3 |
28.1 |
29.1 |
3.8% |
1.5% |
|
Japan |
168.6 |
154.1 |
164.4 |
156.1 |
155.1 |
154.1 |
150.4 |
148.3 |
147.7 |
149.5 |
149.5 |
|
-1.3% |
|
Malaysia |
123.5 |
117.9 |
119.3 |
121.2 |
127.7 |
131.2 |
129.7 |
129.6 |
129.6 |
128.1 |
129.7 |
1.3% |
0.5% |
|
New Zealand |
189.1 |
186.4 |
190.5 |
187.1 |
187.2 |
187.3 |
194.4 |
193.7 |
193.7 |
197.2 |
191.6 |
-2.8% |
0.4% |
|
Pakistan |
16.0 |
15.8 |
15.6 |
15.3 |
15.1 |
14.9 |
15.1 |
15.6 |
16.6 |
17.2 |
17.7 |
3.0% |
0.6% |
|
Philippines |
12.9 |
12.9 |
13.1 |
13.1 |
13.3 |
14.1 |
14.6 |
15.8 |
17.0 |
18.2 |
18.5 |
1.4% |
3.7% |
|
Singapore |
512.1 |
538.0 |
565.8 |
576.7 |
568.7 |
574.8 |
582.6 |
609.7 |
624.3 |
634.3 |
633.0 |
-0.2% |
2.5% |
|
South Korea |
205.4 |
205.7 |
220.8 |
230.1 |
231.6 |
230.9 |
232.3 |
236.1 |
240.9 |
244.0 |
246.3 |
1.0% |
1.9% |
|
Sri Lanka |
10.7 |
11.0 |
11.7 |
12.2 |
12.3 |
12.5 |
11.2 |
14.2 |
15.0 |
15.7 |
16.2 |
2.9% |
3.2% |
|
Taiwan |
194.6 |
190.5 |
201.1 |
197.4 |
196.3 |
199.2 |
203.4 |
201.3 |
204.4 |
207.4 |
209.2 |
0.9% |
|
|
Thailand |
59.9 |
61.7 |
65.3 |
67.5 |
71.9 |
72.7 |
74.4 |
76.1 |
77.4 |
79.0 |
80.5 |
1.9% |
2.9% |
|
Vietnam |
18.6 |
18.8 |
21.1 |
23.9 |
24.7 |
26.2 |
28.3 |
30.9 |
32.7 |
33.2 |
37.2 |
12.0% |
8.2% |
|
Other Asia Pacific |
11.9 |
10.7 |
11.4 |
11.2 |
11.8 |
11.7 |
12.5 |
12.6 |
13.9 |
14.1 |
14.6 |
3.5% |
2.1% |
|
Total Asia Pacific |
47.8 |
48.4 |
51.0 |
53.2 |
54.4 |
55.5 |
56.2 |
56.6 |
57.2 |
58.3 |
60.2 |
3.3% |
2.2% |
|
Total World |
72.2 |
70.3 |
72.8 |
73.7 |
73.8 |
74.4 |
74.2 |
74.0 |
74.2 |
74.7 |
76.0 |
1.8% |
0.3% |
|
of which: OECD |
192.8 |
182.2 |
187.9 |
184.9 |
182.0 |
182.9 |
180.6 |
180.0 |
180.1 |
181.0 |
182.6 |
0.9% |
-0.8% |
|
Non-OECD |
45.6 |
45.8 |
47.8 |
49.7 |
50.7 |
51.3 |
51.8 |
51.8 |
52.1 |
52.8 |
54.2 |
2.7% |
1.7% |
|
European Union |
152.0 |
142.9 |
147.7 |
142.6 |
141.2 |
140.1 |
134.8 |
136.4 |
137.6 |
139.2 |
138.7 |
-0.4% |
-1.0% |
*Primary energy comprises commercially-traded fuels, including modern renewables used to generate electricity.Less than 0.05%.
12 |
BP Statistical Review of World Energy 2019 |